Tag: Stock Analysis

  • Navigating the High Seas of Luxury: A Comprehensive Research Feature on Viking Holdings Ltd (VIK)

    Navigating the High Seas of Luxury: A Comprehensive Research Feature on Viking Holdings Ltd (VIK)

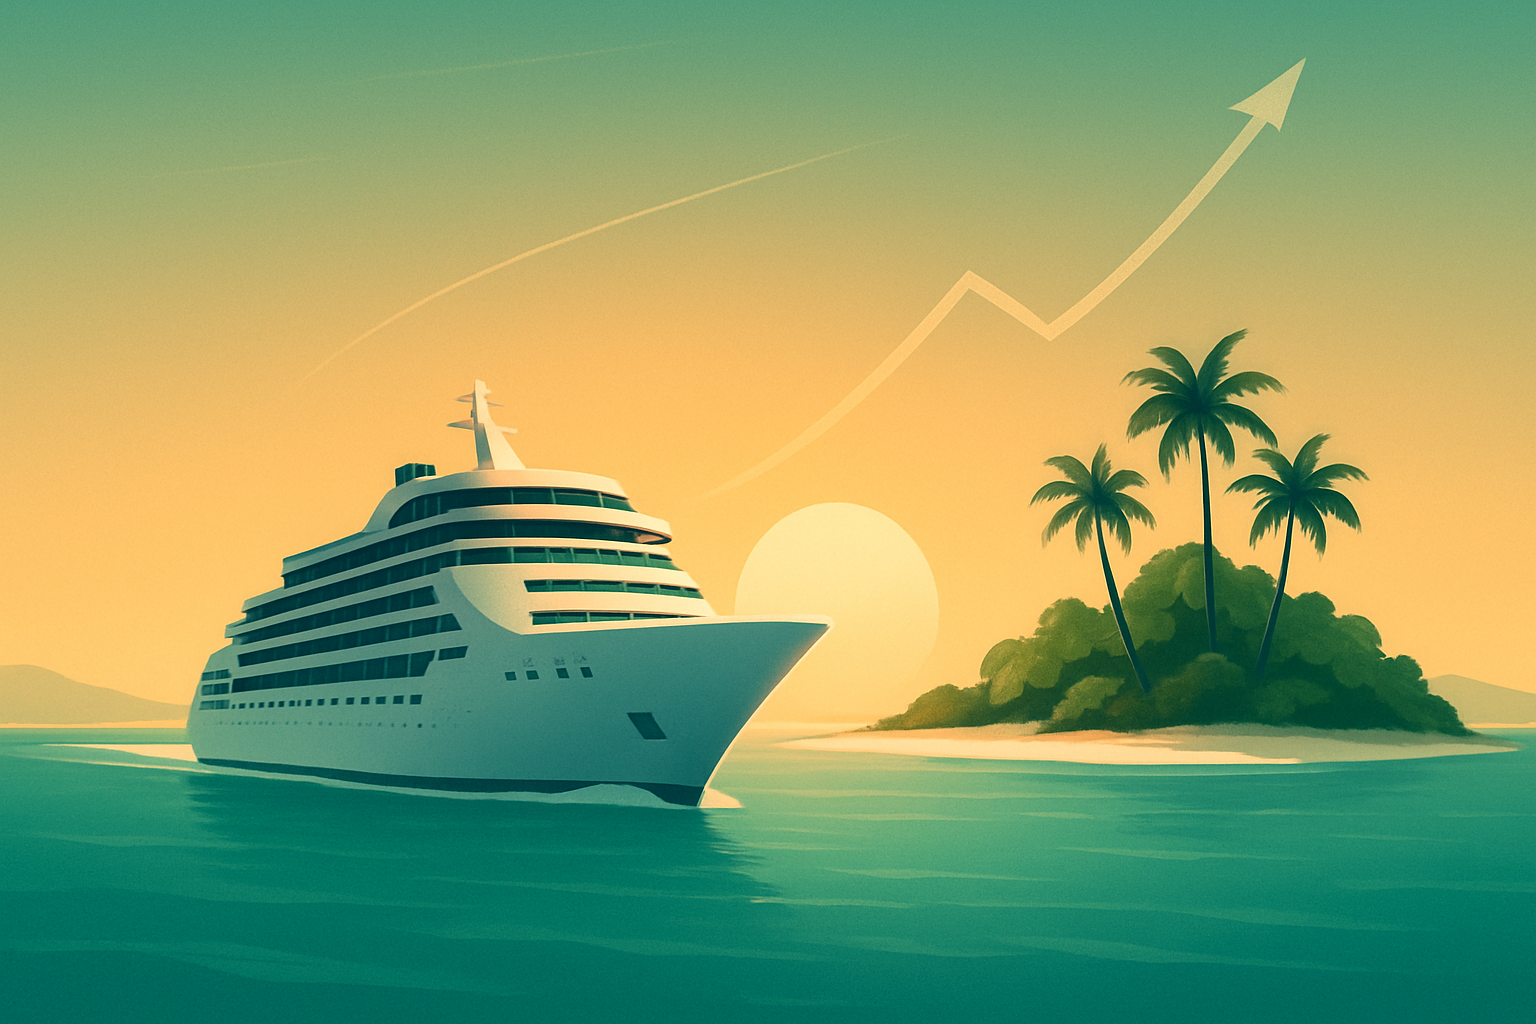
    As of December 26, 2025, the luxury travel sector has witnessed a profound transformation, led by the meteoric rise of Viking Holdings Ltd (NYSE: VIK). Since its highly anticipated initial public offering in May 2024, Viking has evolved from a niche European river cruise operator into a global powerhouse of "experiential travel." The company is currently in focus for its industry-leading margins, a unique "no-nonsense" luxury philosophy, and its resilience in an era of fluctuating macroeconomic conditions. With a fleet that recently surpassed the 100-ship milestone, Viking stands as a prime example of how a clear, destination-focused brand identity can command premium pricing and investor confidence.

    Historical Background

    Viking’s journey began in 1997 when Norwegian entrepreneur Torstein Hagen purchased four Russian river vessels. Hagen’s vision was contrarian from the start: he sought to build a cruise line for the "Thinking Person." Unlike the industry giants of the time, which focused on family entertainment and onboard spectacle, Viking prioritized cultural immersion and intellectual enrichment.

    The company entered the North American market in 2000, utilizing aggressive direct-to-consumer marketing and high-profile sponsorships of programs like PBS Masterpiece to build a loyal following among affluent retirees. By 2012, Viking had become the largest river cruise line in the world. Its boldest transformation occurred in 2015 with the launch of its ocean division, applying its "small ship" aesthetic to the high seas. Most recently, the 2022 expansion into expedition cruises and the 2024 IPO marked the company’s transition into a mature, multi-billion-dollar public entity.

    Business Model

    Viking operates a vertically integrated model focused on the "English-speaking affluent traveler over 55." Its revenue is derived from three primary segments:

    • River Cruises: The company’s foundation, where it holds more than 50% of the North American outbound market share.
    • Ocean Cruises: Small, all-veranda ships that accommodate roughly 930 guests, offering a more intimate experience than mass-market competitors.
    • Expedition Cruises: Specialized voyages to the Arctic and Antarctica on state-of-the-art "Polar Class" vessels.

    Viking’s "pre-sold" strategy is a cornerstone of its model. By December 2025, the company has already sold nearly 96% of its capacity for the year and 70% for 2026. This provides exceptional revenue visibility and allows for precise yield management.

    Stock Performance Overview

    Since its IPO on May 1, 2024, at an initial price of $24.00, VIK has been one of the strongest performers in the leisure and hospitality sector.

    • 1-Year Performance: In 2025, the stock rose from approximately $45 in January to its current level of ~$74.20, a gain of over 60%.
    • Since IPO: The stock has seen a cumulative gain of approximately 209% since its debut 19 months ago.
    • Relative Strength: VIK has significantly outperformed its mass-market peers, including Carnival Corporation (NYSE: CCL) and Norwegian Cruise Line Holdings (NYSE: NCLH), as investors have rewarded Viking’s superior margin profile and higher-income customer base.

    Financial Performance

    Viking’s financial results for 2025 have solidified its reputation as a "margin machine."

    • Revenue: For FY 2025, the company is on track to report revenue of ~$6.44 billion, a substantial increase from $5.33 billion in 2024.
    • Margins: Adjusted EBITDA margins stand at an industry-leading 33.6%, compared to the 20-26% range typically seen at Royal Caribbean Cruises Ltd (NYSE: RCL).
    • Earnings: Q3 2025 reported an Adjusted EPS that beat analyst expectations, driven by a 7% increase in net yields.
    • Debt & Valuation: While Viking carries a significant debt load (~$5 billion) associated with its rapid fleet expansion, its Net Debt/EBITDA ratio has improved to below 3.5x. The stock currently trades at a premium P/E multiple compared to the broader cruise industry, reflecting its luxury status.

    Leadership and Management

    Founder Torstein Hagen continues to serve as Chairman and CEO at 82. Hagen remains the primary architect of the brand's identity, famously banning "casinos, children, and umbrella drinks." His daughter, Karine Hagen, serves as Executive Vice President, ensuring the family-led ethos and brand consistency remain intact.

    The management team is noted for its "lean" operational style and long-term strategic focus. Through Viking Capital Ltd, Hagen retains approximately 87% of the voting power, a dual-class share structure that has allowed the company to resist short-term market pressures in favor of long-term capital investments in its fleet.

    Products, Services, and Innovations

    Viking’s competitive edge lies in its "Scandinavian Modern" design and standardized fleet. Whether on the Rhine or the Mediterranean, guests encounter nearly identical ship layouts, which reduces training costs and operational complexity.

    • In-Price Inclusions: Unlike mass-market lines that "nickel and dime" guests, Viking includes one shore excursion in every port, Wi-Fi, and beer/wine with meals.
    • Environmental Innovation: Viking is currently testing its first hydrogen-powered ocean vessels, slated for delivery in 2026, and has outfitted its newest river ships with hybrid battery engines to meet tightening European emissions standards.

    Competitive Landscape

    Viking occupies a unique "sweet spot" in the market:

    • Versus Mass Market: It offers a more sophisticated, adult-only experience than Carnival (NYSE: CCL) or Royal Caribbean (NYSE: RCL).
    • Versus Ultra-Luxury: It undercuts the pricing of ultra-luxury players like Regent Seven Seas or Silversea while providing a comparable level of design and destination focus.
    • River Market Dominance: In the river segment, Viking’s scale allows it to dominate the best docking locations in European cities, a significant logistical advantage that smaller rivals cannot match.

    Industry and Market Trends

    The "silver economy" is the primary tailwind for Viking. The aging Baby Boomer demographic in North America and Western Europe has shifted spending from "goods" to "experiences." Furthermore, the trend toward "slow travel"—longer voyages that focus on history and culture—perfectly aligns with Viking’s "Grand Voyage" itineraries. Despite global inflation, the affluent traveler segment has shown remarkable resilience, continuing to book luxury travel 12-18 months in advance.

    Risks and Challenges

    Despite its success, Viking faces several headwinds:

    • Geopolitical Instability: Tensions in Eastern Europe and the Middle East can impact specific river and ocean itineraries, requiring costly rerouting.
    • Fuel Volatility: Like all maritime operators, Viking is sensitive to fluctuations in the price of Marine Gas Oil (MGO).
    • Regulatory Scrutiny: Increasing environmental regulations from the International Maritime Organization (IMO) regarding carbon intensity (CII) require ongoing capital expenditure for fleet retrofitting.
    • Leadership Transition: Given Torstein Hagen’s age, succession planning remains a point of focus for institutional investors.

    Opportunities and Catalysts

    • New Market Entry: Viking is planning a significant push into the Indian river market by 2027 and is expanding its presence on the Yangtze in China through its partnership with China Merchants Shekou.
    • Fleet Expansion: With 12 more river ships and 7 ocean ships on order through 2030, Viking is poised to capture the continued growth in luxury demand.
    • Loyalty Monetization: With over 50% of guests being repeat travelers, Viking’s high "customer lifetime value" reduces marketing acquisition costs over time.

    Investor Sentiment and Analyst Coverage

    Wall Street sentiment remains largely bullish. As of late December 2025, the consensus rating is a "Moderate Buy." Major institutions like TPG and CPP Investments remain significant shareholders, and analysts from banks such as UBS and Jefferies have set price targets in the $80–$85 range, citing Viking’s superior cash flow generation and defensive positioning within the consumer discretionary sector.

    Regulatory, Policy, and Geopolitical Factors

    The cruise industry is currently navigating the "Green Deal" in Europe, which mandates shore-side power capabilities and the use of cleaner fuels. Viking has been proactive in this area, but the cost of compliance remains a factor. Additionally, U.S. policy regarding travel to certain regions (such as the Mississippi River's Jones Act compliance) continues to influence the company’s domestic expansion strategy.

    Conclusion

    Viking Holdings Ltd has proven that there is a massive, underserved market for intelligent, quiet, and luxury-focused travel. By December 2025, the company’s stock performance has validated its high-margin business model and its dominant position in both river and ocean cruising. While the company carries the risks typical of the capital-intensive maritime industry—including high debt and geopolitical sensitivity—its pre-sold inventory and exceptionally high repeat-guest rate provide a safety net that few competitors can claim. For investors, VIK represents a premium play on the global aging demographic, though the current valuation requires the company to continue its flawless operational execution as it approaches the 2026 season.


    This content is intended for informational purposes only and is not financial advice.

  • Cruising Toward the Horizon: An In-Depth Analysis of Carnival Corporation & plc (CCL)

    Cruising Toward the Horizon: An In-Depth Analysis of Carnival Corporation & plc (CCL)

    Date: December 26, 2025

    Introduction

    As the final week of 2025 unfolds, the global tourism sector finds itself in the midst of a historic transformation, and no company better exemplifies this shift than Carnival Corporation & plc (NYSE: CCL). After a tumultuous half-decade defined by the existential threat of the COVID-19 pandemic and a Herculean effort to deleverage one of the most debt-laden balance sheets in the leisure industry, Carnival has emerged as a leaner, more focused titan. Today, as the world’s largest cruise operator, Carnival is no longer just "recovering"—it is redefining its role in the $1.5 trillion global experience economy. With record-breaking bookings and the highly anticipated opening of its flagship private destination, Celebration Key, in July 2025, the company has successfully pivoted from survival mode to a strategic offensive.

    Historical Background

    The Carnival story is one of the most storied in American entrepreneurship. Founded in 1972 by Israeli-American visionary Ted Arison, the company began with a single ship, the TSS Mardi Gras, which famously ran aground on its maiden voyage. Despite this rocky start, Arison’s genius lay in his philosophy of "democratizing" the cruise experience. By stripping away the stuffy, elite connotations of mid-century ocean liners and replacing them with a focus on "fun," Arison brought cruising to the middle class.

    In 1974, Arison took full control of the company for a symbolic $1 plus the assumption of $5 million in debt. Under his leadership, and later that of his son Micky Arison, Carnival transformed through aggressive acquisition. The 1980s and 90s saw the company swallow iconic names like Holland America Line and Princess Cruises. By the turn of the millennium, Carnival had established itself as the dominant force in the industry, eventually forming a dual-listed structure (comprising Carnival Corporation in the U.S. and Carnival plc in the UK) to cement its global reach.

    Business Model

    Carnival operates as a house of brands, catering to every conceivable demographic in the cruising market. As of late 2025, the company manages a portfolio of eight primary brands—having successfully sunsetted and integrated the P&O Cruises (Australia) operations into the flagship Carnival Cruise Line earlier this year to enhance economies of scale.

    The revenue model is split into two primary streams:

    1. Passenger Tickets (~65% of revenue): This represents the base fare paid by guests. In 2025, pricing power reached all-time highs as demand for value-oriented vacations outpaced hotel price increases.
    2. Onboard Revenue (~35% of revenue): This is the high-margin engine of the business, encompassing spending on casinos, specialty dining, beverages (the "Cheers!" package), shore excursions, and spas.

    By operating across the value spectrum—from the mass-market "Fun Ships" of Carnival to the ultra-luxury, small-ship intimacy of Seabourn—the company maintains a diversified cash flow that is resilient across different economic cycles.

    Stock Performance Overview

    The stock performance of CCL tells a tale of two eras.

    • 1-Year Performance: Over the course of 2025, CCL has been a standout performer in the consumer discretionary sector, rising approximately 35% as investors reacted to the reinstatement of a $0.15 quarterly dividend and the successful deleveraging milestones.
    • 5-Year Performance: Looking back to 2020, the stock remains significantly below its pre-pandemic highs. The massive share dilution used to survive the industry-wide shutdown in 2020-2022 means that while the company's enterprise value has recovered, the per-share price continues to face headwinds.
    • 10-Year Performance: On a decade-long horizon, CCL has significantly underperformed the S&P 500. Investors who held through the pandemic saw their equity value decimated, though the 2023-2025 "Great Recovery" has salvaged much of the lost ground for those who entered at the 2022 lows.

    Financial Performance

    Carnival’s fiscal year 2024 was a watershed moment, with total revenue hitting a record $25 billion. Projections for the full year 2025 suggest a climb to approximately $26.6 billion.

    The most critical metric for investors, however, is not revenue but the company’s debt management. Peak debt reached nearly $35 billion during the pandemic; as of late 2025, that figure has been whittled down to roughly $27 billion. Adjusted EBITDA for 2025 is expected to land between $6.8 billion and $7.2 billion, a significant jump that reflects both higher occupancy and improved fuel efficiencies. With net income projected to reach the $2.5 billion range, the company's focus has shifted from interest coverage to aggressive capital returns and reinvestment in new capacity.

    Leadership and Management

    The architect of the modern Carnival is CEO Josh Weinstein, who took the helm in August 2022. Weinstein has been credited with a "no-nonsense" approach to financial management, spearheading the "SEA Change" program. This strategy focused on three pillars: Sustainability, EBITDA growth, and Adjusted Return on Invested Capital (ROIC).

    By mid-2025, Weinstein’s team announced they had achieved several 2026 financial targets early, a move that bolstered his reputation on Wall Street as a disciplined operator. His leadership is seen as a departure from the high-growth, high-expenditure era of the 2010s, focusing instead on optimizing the existing fleet and high-margin private destinations.

    Products, Services, and Innovations

    Innovation at Carnival is currently centered on two fronts: the guest experience and environmental technology.

    • The Medallion Class: Princess Cruises' "Medallion" technology remains the gold standard in the industry, allowing for touchless check-ins, on-demand food delivery anywhere on the ship, and personalized guest services.
    • Excel-Class Ships: The company continues to roll out its Excel-class vessels (like the Carnival Jubilee), which are powered by Liquefied Natural Gas (LNG). These ships are not only more environmentally friendly but also offer significantly higher guest capacity and revenue potential.
    • Celebration Key: Opened in July 2025 on Grand Bahama, this private destination serves as a massive catalyst. By controlling the entire shore experience, Carnival captures 100% of the excursion and food revenue while offering guests a bespoke experience they cannot find elsewhere.

    Competitive Landscape

    Carnival remains the volume leader in the cruise industry, controlling roughly 40% of the global market. However, it faces intense competition:

    • Royal Caribbean Group (NYSE: RCL): Often viewed as the primary "innovator," Royal Caribbean has historically traded at a premium to Carnival due to its higher margins and younger fleet.
    • Norwegian Cruise Line Holdings (NYSE: NCLH): A smaller player that focuses on a premium-mass demographic and "freestyle" cruising, posing a threat in the high-spend segment.
    • MSC Cruises: A private European giant that has been aggressively expanding its footprint in the North American market, often sparking price wars in the Caribbean.

    Carnival’s competitive advantage remains its scale and its brand diversity, allowing it to move ships between brands (e.g., Costa to Carnival) to follow shifting global demand.

    Industry and Market Trends

    Three major trends are currently shaping the industry in late 2025:

    1. The Experience Economy: Post-pandemic consumers continue to prioritize "doing" over "having," a trend that has kept cruise ships at 100%+ occupancy levels.
    2. Multi-Generational Travel: Cruising has become the go-to for large family reunions, a segment Carnival’s "Fun Ships" dominate.
    3. Sustainability Mandates: The industry is under immense pressure to decarbonize, leading to a massive wave of retrofitting and new fuel research.

    Risks and Challenges

    Despite the upbeat 2025 performance, significant risks remain:

    • Macroeconomic Sensitivity: While cruising is a "value" vacation, a severe global recession could still dampen demand.
    • Fuel and Geopolitics: Volatility in oil prices directly impacts the bottom line. Furthermore, continued instability in regions like the Red Sea has forced costly rerouting of the global fleet.
    • Interest Rates: Although Carnival is paying down debt, the remaining $27 billion is still subject to refinancing risks if interest rates remain "higher for longer."

    Opportunities and Catalysts

    The primary catalyst for 2026 and beyond is the full-year integration of Celebration Key. Initial data from the late 2025 season suggests that the destination is driving a 10-15% premium on Caribbean itineraries. Additionally, the planned expansion of Half Moon Cay (adding a pier to accommodate larger ships) will further lower operational costs and increase guest satisfaction scores. There is also ongoing speculation regarding the eventual return of a regular dividend program to pre-pandemic levels, which could attract a new class of income-seeking institutional investors.

    Investor Sentiment and Analyst Coverage

    Sentiment among Wall Street analysts has shifted from "cautious" to "bullish" over the last 12 months. As of late 2025, the consensus rating sits at a "Strong Buy." Major institutional holders, including Vanguard and BlackRock, have maintained or increased their positions, signaling confidence in the company’s deleveraging trajectory. Retail sentiment remains high, bolstered by the "cruiser-to-investor" pipeline, where loyal fans of the brands also hold the stock to benefit from shareholder on-board credits.

    Regulatory, Policy, and Geopolitical Factors

    Regulatory compliance is the "hidden" cost of the cruise business. The International Maritime Organization (IMO) has set stringent targets for carbon intensity reduction by 2030. Carnival has managed to pull forward its 2030 goals to 2026, largely through the adoption of LNG and shore-power capabilities in over 60% of its fleet. However, evolving environmental laws in the European Union (such as the Emissions Trading System) continue to add operational complexity and cost to the company’s European brands like Costa and AIDA.

    Conclusion

    As we close out 2025, Carnival Corporation & plc stands as a testament to corporate resilience. By successfully navigating a debt crisis that would have sunk a lesser company, it has reclaimed its throne as the king of the high seas. While the shadow of the 2020 debt accumulation will linger for several more years, the company’s operational excellence and pricing power have never been stronger. For investors, the story of CCL is now shifting from a "recovery play" to a "compounding growth story." The key to the next three years will be the company’s ability to maintain its pricing discipline while continuing to chip away at its mountain of debt in an increasingly carbon-conscious world.


    This content is intended for informational purposes only and is not financial advice.

  • The Salvage Giant’s New Playbook: Analyzing LKQ Corporation’s Pivot to Operational Excellence

    The Salvage Giant’s New Playbook: Analyzing LKQ Corporation’s Pivot to Operational Excellence

    As of late 2025, LKQ Corporation (NASDAQ: LKQ) stands at a critical crossroads. Long celebrated as the undisputed king of the automotive "circular economy," the company has spent two decades aggressively rolling up salvage yards and aftermarket distributors across North America and Europe. However, 2025 has marked a fundamental shift in its narrative. No longer just a "growth-by-acquisition" story, LKQ is currently navigating a rigorous internal transformation under new leadership. Following its high-profile move from the S&P 500 to the S&P 600 in December 2025, the company is being viewed by Wall Street through a new lens: as a "deep value" play focused on margin expansion and portfolio simplification in an era of aging vehicle fleets and complex automotive technology.

    Historical Background

    Founded in 1998 by Donald Flynn—a veteran of Waste Management and AutoNation—LKQ was built on a simple but revolutionary premise: the fragmentation of the salvage yard industry was an opportunity for professionalization. By consolidating hundreds of local "junkyards," LKQ created the first national, and later global, network for recycled automotive parts.

    The company’s history is defined by several eras. The 2000s were about North American dominance in salvage. The 2010s saw a massive expansion into the European aftermarket and the "specialty" truck and off-road markets. In 2023, the $2.1 billion acquisition of Uni-Select cemented its position in the refinish paint and Canadian markets. By late 2024, the "Zarcone Era" ended with the retirement of CEO Dominick Zarcone, handing the reins to Justin Jude to lead what is now being called the "Operational Excellence" era.

    Business Model

    LKQ operates as a global distributor of vehicle parts and accessories, with a business model centered on the life cycle of the automobile. Its revenue is derived from three primary segments:

    1. Wholesale – North America: The core of the business, providing recycled (OEM), aftermarket, and refurbished collision and mechanical parts.
    2. Europe: The largest aftermarket parts distributor in Europe, serving a diverse market across the UK, Benelux, and Central Europe.
    3. Specialty: Focused on equipment and accessories for trucks, SUVs, and recreational vehicles.

    Notably, in October 2025, LKQ completed the $410 million sale of its "Self Service" (Pick Your Part) segment. This move signaled a definitive exit from the lower-margin, retail-facing "pull-your-own-part" business to focus exclusively on high-margin wholesale distribution to professional repair shops and insurance companies.

    Stock Performance Overview

    The performance of LKQ stock in 2025 has been a tale of two realities. Year-to-date, the stock has struggled, down approximately 19% to trade near the $30 mark. This decline was accelerated by its removal from the S&P 500 in December 2025—a result of its market capitalization ($7.8 billion) falling below the threshold for large-cap inclusion.

    Over a 5-year horizon, LKQ has provided a modest total return of roughly 8%, significantly underperforming the broader S&P 500. However, its 10-year performance reflects a more resilient 4% CAGR. While the "easy money" from the roll-up phase has been made, the current valuation metrics suggest a stock that has been oversold, with a trailing P/E of 11.2x and a forward P/E of 9.4x, making it one of the most affordable names in the industrial distribution space.

    Financial Performance

    Financial results for FY 2024 and the first three quarters of 2025 show a company under pressure but generating significant cash. In 2024, LKQ reported $14.4 billion in revenue. By the end of Q3 2025, revenue has remained stable at approximately $3.5 billion per quarter.

    The challenge has been on the bottom line. Net income fell in 2024 due to volatile scrap metal prices and a decline in North American collision claims. However, the company’s 2025 "Lean" initiative has targeted $200 million in annual cost savings. For the full year 2025, management has narrowed adjusted EPS guidance to $3.00–$3.15. Most impressively, LKQ continues to be a cash-flow machine, with projected free cash flow exceeding $800 million for 2025, much of which is being directed toward dividends and debt reduction.

    Leadership and Management

    On July 1, 2024, Justin Jude succeeded Dominick Zarcone as CEO. Jude, who previously ran the North American Wholesale segment, has brought a "ruthless prioritization" to the C-suite. His strategy is built on three pillars: portfolio simplification, margin expansion, and "Lean" operations.

    Under Jude, the leadership team has been refreshed, particularly in Europe, where nearly 25% of senior management was replaced in early 2025 to drive better integration. Jude is widely respected by analysts for his deep operational knowledge, and his focus on divesting non-core assets (like the Self Service and certain Eastern European operations) has been praised as a necessary "pruning" of the company's complex structure.

    Products, Services, and Innovations

    LKQ’s product catalog is a blend of traditional salvage and high-tech solutions. The FinishMaster refinish paint business, inherited via Uni-Select, has become a cornerstone of the North American segment.

    Innovation in 2025 is focused on two areas:

    1. ADAS Calibration: As vehicles become more complex, LKQ has expanded its "workshop concepts" to include calibration services for Advanced Driver Assistance Systems (sensors/cameras).
    2. EV Battery Life Cycle: Through its LKQ Synetiq venture in the UK and partnerships with Princeton NuEnergy, LKQ is pioneering "green parts" for electric vehicles and lithium-ion battery remanufacturing, positioning itself as a leader in the inevitable EV salvage market.

    Competitive Landscape

    LKQ operates in a bifurcated competitive environment. In the traditional aftermarket space, its primary rival is Genuine Parts Company (NYSE: GPC), the parent of NAPA. While GPC has a stronger retail footprint, LKQ dominates the "alternative" part (recycled and refurbished) market, where it often acts as the lower-cost provider for insurance companies.

    In the salvage space, LKQ faces rising competition from regional consolidators like Fenix Parts and Parts Authority. Fenix, in particular, has been aggressive in the US Midwest throughout 2025, pressuring LKQ’s local margins. However, LKQ’s global scale and logistics network remain a formidable moat that smaller players cannot easily replicate.

    Industry and Market Trends

    The "age of the fleet" is the single most important macro driver for LKQ. In 2025, the average age of a vehicle on US roads reached a record 12.6 years. Older cars are more likely to require the recycled and aftermarket parts that LKQ specializes in.

    Furthermore, the complexity of modern cars (ADAS) has led to an increase in "total loss" rates for minor accidents. When a car is totaled by an insurance company, it often ends up in an LKQ facility, providing the company with a steady supply of high-value inventory. Paradoxically, the high cost of new car repairs is a tailwind for the salvage business.

    Risks and Challenges

    The primary risk to LKQ is a persistent decline in "repairable claims." In late 2024 and throughout 2025, a combination of fewer accidents (due to ADAS) and lower used car values has led to lower organic volume.

    Additionally, commodity price volatility—specifically the price of scrap steel and precious metals in catalytic converters—can cause significant fluctuations in quarterly earnings. Finally, the rapid transition to EVs in Europe presents a long-term challenge to the traditional internal combustion engine (ICE) part supply chain, though LKQ is actively investing to mitigate this.

    Opportunities and Catalysts

    The divestment of the Self Service segment and the potential sale of further non-core assets provide a significant catalyst for margin re-rating. Analysts expect that if LKQ can stabilize organic growth in 2026, the stock’s low valuation could lead to a rapid upward correction.

    Another major opportunity lies in the European margin expansion. Historically, LKQ Europe has had lower margins than the North American segment. By applying Justin Jude’s "Lean" principles and fully integrating the Uni-Select logistics, management aims to bring European EBITDA margins into the double digits by 2026.

    Investor Sentiment and Analyst Coverage

    Despite the stock's poor price action in 2025, Wall Street sentiment remains surprisingly bullish. The consensus rating among analysts is a "Buy" or "Strong Buy," with average price targets ranging from $41 to $44—representing a potential 40% to 50% upside.

    The investment thesis among institutional owners is that LKQ is a "broken stock, not a broken company." The move to the S&P 600 has flushed out many index-tracking sellers, leaving a shareholder base composed of value-oriented funds who see the $800M+ in free cash flow as a safety net.

    Regulatory, Policy, and Geopolitical Factors

    The "Right to Repair" movement has been a significant tailwind for LKQ. In 2025, the implementation of the Maine Automotive Right to Repair law and progress on the EU’s Right to Repair Directive have mandated that automakers provide diagnostic data to independent shops. This ensures that LKQ’s primary customer base—independent mechanics—can continue to service modern vehicles.

    On the environmental front, stricter EU "Fit-for-55" standards and new California safety inspection rules for salvaged parts are actually strengthening LKQ’s competitive position. These regulations require sophisticated tracking and documentation of parts, which smaller "mom-and-pop" salvage yards struggle to provide, further consolidating the market in LKQ's favor.

    Conclusion

    LKQ Corporation at the end of 2025 is a company in the middle of a necessary and disciplined evolution. The transition from a large-cap growth darling to a small-cap value play has been painful for long-term shareholders, but it has created an entry point that is hard for disciplined investors to ignore.

    With an aging global car fleet, a dominant position in the circular economy, and a CEO focused squarely on operational efficiency, LKQ is better positioned than ever to weather economic cyclicality. While 2025 was a year of "pruning," 2026 is shaping up to be the year where the market finally recognizes the cash-generating power of the world’s largest salvage network. Investors should watch for continued margin improvement in Europe and a stabilization of North American organic volumes as the key signals for a recovery.


    This content is intended for informational purposes only and is not financial advice

  • The Great Resurgence: A Comprehensive Analysis of Carvana’s (CVNA) Rise to Market Dominance

    The Great Resurgence: A Comprehensive Analysis of Carvana’s (CVNA) Rise to Market Dominance

    Date: December 26, 2025

    Introduction

    In the history of the American equity markets, few stories of corporate resurrection are as dramatic as that of Carvana Co. (NYSE: CVNA). Once a darling of the pandemic era that nearly collapsed under the weight of debt and cooling demand in 2022, Carvana has spent the last 24 months rewriting its narrative. Today, it stands not just as a survivor, but as a dominant powerhouse that recently achieved the prestigious milestone of inclusion in the S&P 500 Index.

    As of late December 2025, Carvana has transitioned from a speculative "short-squeeze" candidate to a fundamental market leader. Its stock price, which languished in the single digits only three years ago, has recently touched all-time highs, reflecting a profound transformation in operational efficiency and financial health. This research feature examines the mechanics of the "New Carvana"—a leaner, more profitable, and technologically superior version of the e-commerce pioneer.

    Historical Background

    Founded in 2012 by Ernie Garcia III, Ryan Keeton, and Ben Huston, Carvana was born as a subsidiary of the used-car retailer DriveTime. Its mission was radical: to move the entire car-buying experience online, eliminating the friction, pressure, and overhead of traditional brick-and-mortar dealerships. The introduction of the "Car Vending Machine"—multi-story glass towers that dispensed vehicles via oversized coins—became a viral marketing masterstroke that defined the company’s brand.

    Carvana went public in 2017 and experienced exponential growth during the COVID-19 pandemic as consumers avoided physical showrooms. However, the aggressive expansion and the $2.2 billion acquisition of the ADESA physical auction business in 2022 coincided with a spike in interest rates and a cooling used-car market. By late 2022, many analysts predicted bankruptcy as the company burned through cash. The 2023 debt restructuring deal was the turning point, providing the "runway" for management to pivot from "growth at all costs" to a laser focus on unit economics and profitability.

    Business Model

    Carvana operates a vertically integrated e-commerce platform for buying and selling used vehicles. Its revenue is derived from three primary streams:

    1. Retail Vehicle Sales: The core business of selling used cars to consumers via its website and app.
    2. Wholesale Vehicle Sales: Selling trade-ins that do not meet retail standards through its ADESA auction network.
    3. Other Sales and Revenues: This includes the lucrative financing of vehicle purchases (which are later packaged and sold as asset-backed securities), the sale of extended service plans (VSCs), and gap insurance.

    The company’s competitive edge lies in its proprietary logistics network and its Inspection and Reconditioning Centers (IRCs). By reconditioning vehicles in-house and using its own fleet of haulers, Carvana captures margins that traditional dealers lose to third-party vendors.

    Stock Performance Overview

    The stock performance of CVNA has been nothing short of a roller coaster:

    • 10-Year Horizon: Investors who held from the 2017 IPO through the 2021 peak ($370) and the 2022 crash ($4) experienced extreme volatility. However, those who entered during the 2023-2024 recovery have seen generational wealth creation.
    • 1-Year Performance (2025): Throughout 2025, CVNA gained approximately 130%, fueled by consistent earnings beats and the technical demand sparked by its S&P 500 inclusion on December 22, 2025.
    • 5-Year Horizon: Despite the near-death experience of 2022, the 5-year CAGR is now significantly positive, outperforming the S&P 500 and most retail benchmarks by a wide margin.

    Financial Performance

    Carvana’s financial results for the first three quarters of 2025 showcase a company that has mastered its cost structure.

    • Revenue & Growth: Q3 2025 revenue reached a record $5.647 billion, driven by a surge in retail units sold (155,941).
    • Gross Profit per Unit (GPU): This is the company’s most critical metric. In Q3 2025, Total GPU hit an industry-leading $7,362, a stark contrast to the ~$2,000 levels seen during the 2022 crisis.
    • EBITDA & Margins: The company reported an Adjusted EBITDA of $637 million in Q3, with margins expanding to 11.3%.
    • Debt Status: Total debt has been reduced from a peak of $8.8 billion to approximately $5.6 billion. A Net Debt to Adjusted EBITDA ratio of 1.5x indicates a vastly improved credit profile compared to previous years.

    Leadership and Management

    The company remains under the firm control of the Garcia family, with CEO Ernie Garcia III at the helm. Garcia’s leadership through the 2022 crisis earned him significant respect on Wall Street; rather than retreating, he doubled down on operational improvements and "unit-level math."

    While the dual-class share structure gives the Garcia family significant voting power (a point of contention for some governance purists), the management team’s ability to execute the 2023 turnaround has largely silenced critics. The strategy for 2026 is centered on scaling to 3 million retail units annually while maintaining double-digit EBITDA margins.

    Products, Services, and Innovations

    Carvana continues to lead the industry in "AutoTech" innovations:

    • AI-Driven Reconditioning: In 2025, Carvana integrated AI into its reconditioning process to predict mechanical failures before they occur and to automate cosmetic assessment.
    • Same-Day Delivery: Leveraging the ADESA infrastructure, Carvana now offers same-day delivery in over 40 major U.S. markets.
    • Megasites: The full integration of ADESA sites into "Megasites" in cities like Atlanta and Dallas has allowed the company to store and recondition tens of thousands of cars closer to the end consumer, drastically reducing logistics costs.

    Competitive Landscape

    The used car market is highly fragmented, but Carvana has effectively "de-coupled" from its closest rival, CarMax (NYSE: KMX). While CarMax relies on a heavy physical footprint, Carvana’s digital-first model allows for higher scalability.

    In 2025, while CarMax struggled with stagnating growth, Carvana's market share grew to roughly 1.5% of the total U.S. used car market. Other competitors like AutoNation (NYSE: AN) have been forced to invest heavily in digital tools to keep pace, but they lack Carvana’s dedicated logistics infrastructure.

    Industry and Market Trends

    Several macro factors have favored Carvana in 2025:

    • Normalization of Used Car Prices: The Manheim Used Vehicle Value Index stabilized in 2025, providing a more predictable environment for inventory management.
    • Interest Rate Environment: After a period of high rates, a gradual easing by the Federal Reserve in late 2024 and 2025 lowered the cost of financing for consumers, boosting retail demand.
    • E-commerce Adoption: Consumer comfort with high-value online purchases continues to grow, with younger demographics showing a clear preference for the "no-hassle" Carvana model over traditional dealerships.

    Risks and Challenges

    Despite its success, Carvana is not without risks:

    • Valuation: Trading at over 60x forward earnings, the stock has priced in significant future growth. Any miss in unit guidance could trigger a sharp correction.
    • Cyclicality: The used car market is inherently sensitive to the health of the U.S. consumer. A recession or a spike in unemployment would disproportionately affect Carvana’s high-growth trajectory.
    • Debt Maturity: While the 2023 restructuring pushed maturities out, the company still carries $5.6 billion in debt that will eventually need refinancing or repayment.

    Opportunities and Catalysts

    • S&P 500 Tailwinds: Continued buying from passive index funds throughout 2026 will provide a structural floor for the stock price.
    • ADESA Expansion: The company has only integrated 15 of its 56 ADESA sites into its retail network. Activating the remaining sites represents a massive opportunity for inventory expansion.
    • Ancillary Services: Carvana is increasingly looking at "after-sale" revenue, including car insurance and high-margin maintenance services, to further boost GPU.

    Investor Sentiment and Analyst Coverage

    Wall Street is overwhelmingly bullish as 2025 closes. Institutional ownership has climbed to nearly 90%, with major hedge funds and mutual funds participating in the 2025 rally. Analysts at Jefferies and Wedbush have set price targets as high as $550, citing Carvana’s "path to becoming the Amazon of the used car market." Conversely, some value-oriented analysts remain cautious, suggesting the stock’s inclusion in the S&P 500 marks the "peak" of the narrative.

    Regulatory, Policy, and Geopolitical Factors

    Carvana has faced regulatory scrutiny in the past regarding vehicle titles and licensing in several states (notably Illinois and North Carolina). In 2025, the company invested heavily in its "Regulatory Compliance Center" to automate titling and registration. Federal oversight from the FTC regarding online advertising and consumer financing remains a constant factor, but Carvana has largely moved past the "broken" licensing status that plagued it in 2021-2022.

    Conclusion

    Carvana’s journey from the brink of bankruptcy in 2022 to S&P 500 inclusion in 2025 is a testament to the power of operational pivot and disciplined execution. By leveraging its ADESA acquisition to build a logistics moat and prioritizing unit economics over raw growth, the company has transformed into a high-margin cash flow machine.

    For investors, the "New Carvana" presents a compelling case as the definitive winner in the digitization of the automotive industry. While the valuation is rich and the macro environment remains a factor, the company’s ability to generate record gross profits per unit suggests its business model is now fundamentally sound. As we move into 2026, the key watchpoint will be whether Carvana can maintain its efficiency gains while scaling toward its ambitious 3-million-unit goal.


    This content is intended for informational purposes only and is not financial advice.

  • Fine Casual at Scale: The 2025 Strategic Outlook for Shake Shack (SHAK)

    Fine Casual at Scale: The 2025 Strategic Outlook for Shake Shack (SHAK)

    Today’s Date: December 26, 2025

    Introduction

    As 2025 draws to a close, Shake Shack Inc. (NYSE: SHAK) stands at a pivotal crossroads in its corporate evolution. Once a cult-favorite hot dog cart in Manhattan’s Madison Square Park, the company has transformed into a global "fine casual" titan, redefining the intersection of fast-food convenience and gourmet quality. In the past year, Shake Shack has been under intense investor scrutiny as it navigates a leadership transition, an aggressive suburban expansion strategy, and a volatile macroeconomic environment characterized by fluctuating commodity prices and tightening labor regulations.

    With its stock price showing significant volatility over the last twelve months—hitting record highs before a late-year correction—Shake Shack is a focal point for market analysts. The company is no longer just selling a "better burger"; it is selling an operational turnaround led by a new executive team focused on throughput, digital innovation, and the high-stakes world of drive-thrus. This feature explores the narrative, financials, and strategic future of the "Shack" as it prepares for 2026.

    Historical Background

    The Shake Shack story is one of the most celebrated in modern American hospitality. Founded by Danny Meyer’s Union Square Hospitality Group (USHG), it began in 2001 as a humble hot dog cart to support the restoration of Madison Square Park. Its popularity was so immense that it became a permanent kiosk in 2004, evolving into a neighborhood fixture.

    The brand's identity was built on "Enlightened Hospitality"—a philosophy prioritizing employees and community, which Meyer believed would naturally lead to guest satisfaction and shareholder value. After a decade of organic growth, Shake Shack went public in January 2015, with its Initial Public Offering (IPO) priced at $21.00. The stock famously "popped" to nearly $45 on its first day of trading, signaling the market's hunger for a premium alternative to traditional fast food. Over the subsequent decade, the company expanded from a handful of New York locations to over 500 restaurants worldwide, shifting from an urban phenomenon to a global brand found in airports, suburban drive-thrus, and major international hubs.

    Business Model

    Shake Shack operates through two primary revenue streams: Company-operated Shacks and Licensed Shacks.

    1. Company-Operated (Domestic): The majority of revenue is generated from nearly 300 company-owned locations in the United States. These units serve as the brand's primary growth engine and operational testing grounds.
    2. Licensed Shacks: This segment includes partnerships in international markets (e.g., Middle East, Asia, UK) and domestic high-traffic hubs like airports and stadiums. Licensing is a high-margin business for SHAK, allowing for global brand scaling with minimal capital expenditure.

    The company's customer base is traditionally skewed toward urban, higher-income demographics, but its recent push into suburban "Drive-Thru" formats has expanded its reach to families and convenience-seeking commuters. The "Fine Casual" model remains its core differentiator—offering a menu that uses premium ingredients (e.g., Angus beef, non-GMO buns) served in a modern, architecturally designed setting that sits between traditional fast food and casual dining.

    Stock Performance Overview

    Over its ten-year history as a public entity, SHAK has been a volatile performer, often trading at a "growth premium" that leaves little room for operational error.

    • 10-Year Performance (2015–2025): From its IPO price of $21.00, the stock has risen to approximately $85.11 (as of late December 2025). This represents a total return of roughly 305%, a respectable figure, though it has trailed some of its high-growth peers like Chipotle.
    • 5-Year Performance (2020–2025): The stock has experienced a "U-shaped" recovery. After hitting highs in the $100 range during the 2021 post-pandemic boom, it languished during the 2022-2023 inflation scare before recovering under new management in 2024.
    • 1-Year Performance (2025): 2025 was a year of extremes. The stock surged to an all-time high of $142.03 in July following strong earnings and "viral" product launches, only to pull back by ~34% in the second half of the year as valuation concerns and rising beef prices cooled investor enthusiasm.

    Financial Performance

    In the 2025 fiscal year, Shake Shack demonstrated a sharpened focus on profitability. Total revenue is projected to finish the year between $1.45 billion and $1.48 billion, representing a ~15% year-over-year increase.

    Key financial metrics for late 2025 include:

    • Restaurant-Level Operating Profit (RLOP): Margins reached approximately 22.0% in 2025, an improvement from 2024. This was achieved through an "activity-based labor model" that optimized staffing levels during peak and off-peak hours.
    • Same-Store Sales: Growth remained positive for the 19th consecutive quarter, holding at roughly 4.9% in the latter half of the year, significantly outperforming many traditional fast-food competitors.
    • Capital Allocation: The company opened approximately 45–50 new company-operated units in 2025, emphasizing its commitment to its largest development class to date. However, debt-to-equity ratios are closely watched as the company finances its expensive drive-thru pipeline.

    Leadership and Management

    The most significant shift in Shake Shack’s recent history was the appointment of Rob Lynch as CEO in May 2024. Lynch, the former CEO of Papa Johns, brought an "operational first" mentality to a brand that had been criticized for slow service and inconsistent urban throughput.

    Under Lynch, the strategy has shifted toward:

    • Operational Excellence: Reducing drive-thru wait times from over 7 minutes to under 6 minutes.
    • Marketing Transformation: Moving from a reliance on organic word-of-mouth to aggressive, data-driven paid media campaigns.
    • Governance: Danny Meyer remains the Chairman of the Board, ensuring the brand’s core values of hospitality are not lost in the quest for efficiency. However, the departure of long-time CFO Katherine Fogertey (announced for March 2026) has introduced a level of transitional uncertainty that management must navigate in the coming months.

    Products, Services, and Innovations

    Innovation at Shake Shack in 2025 has moved beyond the menu and into the kitchen and the app.

    • The Atlanta Innovation Kitchen: This R&D hub, launched in 2025, has allowed the company to test items like the Black Truffle Burger and the viral Dubai Chocolate Pistachio Shake before a global rollout.
    • Digital Integration: Digital channels (app, web, and kiosks) now account for 38% of all transactions. The company has implemented kiosk recognition technology and a gamified "Challenges" loyalty program to drive repeat visits.
    • Format Innovation: The "Drive-Thru" remains the company’s highest-volume format. New 2025 builds are being optimized with digital menu boards that use AI to suggest "combo" options, a move aimed at increasing average check sizes.

    Competitive Landscape

    Shake Shack competes in a crowded "Better Burger" and "Premium Fast Casual" market.

    • Five Guys: Its primary rival in the premium burger space. While Five Guys has a larger footprint, Shake Shack’s brand prestige and diversified menu (chicken, shakes, seasonal items) often lead to higher Average Unit Volumes (AUVs) of ~$4.1M.
    • Chipotle Mexican Grill (NYSE: CMG): While serving different cuisine, CMG is the benchmark for fast-casual efficiency. In late 2025, Shake Shack actually outperformed Chipotle in same-store sales growth, as Chipotle struggled with market saturation and internal labor shifts.
    • Traditional Fast Food: In 2025, giants like McDonald's (NYSE: MCD) engaged in aggressive "value wars" (e.g., $5 meal deals). Shake Shack largely sat out these price wars, maintaining its premium positioning and pricing power.

    Industry and Market Trends

    The restaurant industry in 2025 is dominated by three major themes:

    1. Automation & Throughput: Every second shaved off an order is worth millions. SHAK’s focus on kitchen automation and better "line-busting" tech reflects this industry-wide obsession.
    2. The Rise of the "Third Place" vs. Drive-Thru: While Starbucks has leaned away from the "third place" (sit-down) model, Shake Shack is trying to balance both—keeping its beautiful urban dining rooms while mastering the suburban drive-thru.
    3. Digital Loyalty: With third-party delivery fees remaining high, brands are incentivizing customers to use first-party apps. Shake Shack's digital mix growth is a direct result of this trend.

    Risks and Challenges

    Despite its growth, Shake Shack faces non-trivial risks:

    • Commodity Volatility: Beef prices rose in the mid-to-high single digits in 2025, putting constant pressure on margins.
    • Valuation: Trading at a P/E ratio exceeding 80x in late 2025, the stock is "priced for perfection." Any miss in store openings or a dip in same-store sales could lead to significant drawdowns.
    • Suburban Dilution: As the brand moves from high-traffic urban centers to suburban strips, there is a risk that AUVs will naturally decline, challenging the "growth at any cost" narrative.
    • Labor Costs: Legislative moves like the California FAST Act have significantly increased the floor for wages, forcing the company to implement 3-4% price hikes that could eventually test consumer elasticity.

    Opportunities and Catalysts

    • International Licensing: The Middle East and China remain massive white spaces. Licensing revenue grew over 20% in 2025, providing a high-margin cushion to the more capital-intensive domestic business.
    • Drive-Thru Maturation: As the first cohort of drive-thru Shacks matures, the "learning curve" costs are expected to drop, potentially leading to a margin breakout in 2026.
    • M&A Potential: In a consolidating industry, Shake Shack’s brand equity makes it an attractive target for a larger conglomerate or private equity firm, though Danny Meyer’s involvement remains a significant hurdle for any hostile action.

    Investor Sentiment and Analyst Coverage

    Wall Street remains cautiously optimistic. The consensus rating in December 2025 is a "Moderate Buy."

    • Bulls (e.g., JP Morgan): Point to the 19 quarters of positive same-store sales and the efficiency gains under Rob Lynch.
    • Bears (e.g., Select Boutique Firms): Argue that the stock’s valuation is detached from its earnings reality, labeling it a "momentum play" rather than a fundamental value.
    • Institutional Activity: Ownership sits at ~86%, with significant recent inflows from CIBC and other institutional wealth managers, balanced by profit-taking from early-stage venture and hedge fund backers.

    Regulatory, Policy, and Geopolitical Factors

    Regulatory pressure is mounting on several fronts:

    • Labor Laws: Beyond the California FAST Act, similar wage-floor discussions are happening in New York and Illinois, two of SHAK’s largest markets.
    • Sustainability Mandates: The UK’s CSRD requirements and new food waste segregation laws (effective March 2025) are forcing Shake Shack to rethink its international supply chain and packaging.
    • Food Safety: 2025 saw several US states move to ban specific food additives and dyes. Shake Shack’s proactive move to remove artificial ingredients and use cage-free eggs has positioned it ahead of these regulations, but compliance costs remain a factor.

    Conclusion

    Shake Shack’s journey from a 2001 hot dog cart to a 2025 global powerhouse is a testament to the power of brand equity and "Enlightened Hospitality." However, the company is now in a "show me" phase. Investors have bought into the vision of CEO Rob Lynch—a vision of a faster, more efficient, and more suburban Shake Shack.

    The investment case for SHAK is a balanced one: the brand has never been stronger, and its digital and international engines are firing on all cylinders. Yet, the high valuation and the inherent challenges of the "better burger" economics (labor and beef) mean that execution must remain flawless. For investors, the key metric to watch in 2026 will not just be revenue growth, but whether the company can sustain its 22%+ margins as it expands into the more competitive, convenience-driven suburban landscape.


    This content is intended for informational purposes only and is not financial advice.

  • EPAM Systems: Navigating the 2025 Geopolitical and AI Paradigm Shift

    EPAM Systems: Navigating the 2025 Geopolitical and AI Paradigm Shift

    As of December 26, 2025, EPAM Systems, Inc. (NYSE: EPAM) stands at a critical juncture in its thirty-two-year history. Once celebrated as the quintessential high-growth "engineering-first" digital services firm, EPAM has spent the last three years navigating a gauntlet of geopolitical upheaval, macroeconomic headwinds, and a paradigm-shifting technological revolution in Generative AI.

    Having successfully transitioned its delivery core away from its historical centers in Russia and Belarus, EPAM is now positioning itself as a global, AI-native consultancy. The company’s recent leadership transition—the first in its history—and a string of multi-million dollar acquisitions signal the birth of "EPAM 2.0." This article explores whether the firm can recapture its status as a market outperformer or if the structural shifts in the IT services industry have permanently altered its trajectory.

    Historical Background

    EPAM was founded in 1993 by Arkadiy Dobkin and Leo Lozner in New Jersey, with a mission to bridge the gap between Western business needs and the deep engineering talent of Central and Eastern Europe (CEE). Unlike many competitors who focused on low-cost labor arbitrage, EPAM differentiated itself through "Product Development Services" (PDS), treating client projects like software products rather than mere maintenance tasks.

    The company went public on the NYSE in 2012, initiating a decade of explosive growth. For years, EPAM was the "darling" of the IT services sector, consistently delivering 20%+ organic revenue growth. However, the February 2022 invasion of Ukraine by Russia proved to be an existential test. With nearly 60% of its workforce based in Ukraine, Belarus, and Russia at the time, EPAM was forced to undertake a massive, multi-year relocation and diversification effort, eventually exiting Russia entirely and scaling up operations in India, Latin America, and Western Europe.

    Business Model

    EPAM operates as a global provider of digital platform engineering and software development services. Its business model is built on three pillars:

    1. Software Engineering & Product Development: The core engine, focusing on custom software, cloud migration, and data architecture.
    2. Strategy & Experience (EPAM Continuum): A consulting-led arm that helps clients with business model innovation and service design.
    3. Operations & Optimization: Providing managed services and cloud-native operations to ensure long-term stability for digital products.

    The company generates revenue primarily through Time and Materials (T&M) contracts, though it has increasingly moved toward outcome-based and fixed-price engagements as its AI-driven delivery model matures. Its customer base is diversified across industries including Financial Services (the largest segment), Software & Hi-Tech, Travel & Hospitality, and Life Sciences.

    Stock Performance Overview

    EPAM’s stock performance tells a tale of two eras.

    • 10-Year View: Despite recent volatility, EPAM remains a long-term winner, providing a roughly 10% CAGR over the past decade. An investor who entered in late 2015 would have seen their capital more than double, though they would have missed the parabolic peak of 2021.
    • 5-Year View: The 5-year return is approximately -8% CAGR. This reflects the "valuation reset" that occurred after the stock hit an all-time high near $700 in late 2021.
    • 1-Year View (2025): The stock has struggled in 2025, down roughly 14% year-to-date. Investors have been cautious, weighing the costs of EPAM’s aggressive acquisitions and the transition of its delivery model against a backdrop of tepid (though recovering) enterprise IT budgets.

    Financial Performance

    For the fiscal year 2024, EPAM reported revenue of $4.728 billion, a modest 0.8% increase over 2023, reflecting a "treading water" period. However, 2025 has seen a significant top-line expansion.

    • 2025 Guidance: Following the strategic acquisitions of NEORIS and First Derivative, EPAM raised its 2025 revenue outlook to a range of $5.43 billion to $5.445 billion, implying roughly 15% year-over-year growth.
    • Margins: Non-GAAP operating margins for 2025 are projected at 15.0% to 15.3%. This is a compression from the 16-17% levels seen in previous years, driven by the integration of lower-margin acquisitions and heavy R&D investment in Generative AI.
    • Earnings: 2025 Non-GAAP diluted EPS is expected to land between $11.36 and $11.44. The company maintains a strong balance sheet with substantial cash reserves, allowing it to remain aggressive in the M&A market.

    Leadership and Management

    The most significant event of 2025 was the leadership transition effective September 1st. Founder Arkadiy Dobkin, who led the company for over 30 years, moved to the role of Executive Chairman.

    Taking the helm as CEO is Balazs Fejes, formerly the President of Global Business and Chief Revenue Officer. Fejes, known for his aggressive commercial focus, is tasked with evolving EPAM from a "pure engineering" shop into a consulting-heavy, AI-first organization. This shift is seen as essential for competing with the likes of Accenture and McKinsey in the high-stakes "AI Transformation" market.

    Products, Services, and Innovations

    EPAM has pivoted its R&D toward "AI-Native Delivery." Key current offerings include:

    • EPAM DIAL: An open-source enterprise Generative AI orchestration platform. It allows clients to build complex AI agents while maintaining strict data governance.
    • AI/RUN.Transform: A proprietary framework designed to help enterprises move past "AI pilots" into full-scale production, focusing on measurable ROI.
    • EPAM Continuum: Now increasingly focused on "Human-AI Interaction," this segment designs the interfaces and workflows that allow employees to collaborate effectively with AI systems.

    The company’s "competitive edge" continues to be its engineering pedigree; while others focus on AI as a "productivity tool" for coding, EPAM is focusing on building the underlying "AI Infrastructure" for its clients.

    Competitive Landscape

    EPAM competes in a crowded market against various tiers of players:

    • Global Goliaths (Accenture, IBM): These firms have a broader reach in business process outsourcing (BPO) and massive consulting wings. EPAM competes by being more specialized and agile in custom engineering.
    • Digital Natives (Globant, Endava): Globant (NYSE: GLOB) is EPAM’s most direct rival. While Globant has traditionally dominated the Latin American market, EPAM’s 2024 acquisition of NEORIS ($630M) has neutralized that advantage, creating a fierce battle for "nearshore" delivery for North American clients.
    • Legacy Providers (Cognizant, Infosys): EPAM often wins against these firms on high-complexity projects, though legacy providers often underprice EPAM on maintenance-heavy contracts.

    Industry and Market Trends

    The IT services sector in late 2025 is defined by "AI Deflation" fears. There is a growing concern that as AI makes coding faster, the total billable hours (and thus revenue) for services firms will shrink.

    EPAM is countering this trend by shifting toward "outcome-based pricing" and "strategic consulting." The industry is also seeing a massive "nearshoring" wave, as Western companies move operations closer to home (Mexico, Colombia, Poland) to avoid the logistical and geopolitical complexities of the Far East and CEE.

    Risks and Challenges

    1. Geopolitical Exposure: While reduced, EPAM still has significant operations in Ukraine. Any escalation in the conflict or changes in local labor laws could disrupt delivery.
    2. Execution Risk (M&A): The integration of NEORIS and First Derivative is the largest in EPAM's history. Failure to harmonize cultures and sales teams could lead to margin erosion.
    3. AI Cannibalization: If EPAM cannot successfully pivot its pricing model, the efficiency gains from AI could lead to lower total contract values.
    4. Leadership Change: Replacing a founder-CEO always carries risk. The market is watching closely to see if Balazs Fejes can maintain EPAM’s unique corporate culture.

    Opportunities and Catalysts

    • Financial Services Recovery: Through the First Derivative acquisition, EPAM is now a powerhouse in capital markets technology. A recovery in financial sector IT spending in 2026 could be a major catalyst.
    • LatAm Expansion: The NEORIS deal gives EPAM a massive footprint in Mexico and Brazil, regions where demand for digital transformation is currently outpacing supply.
    • Agentic AI: As enterprises move toward "Agentic" workflows (AI that performs tasks autonomously), EPAM’s deep engineering roots make it a preferred partner for building these complex systems.

    Investor Sentiment and Analyst Coverage

    Wall Street remains cautiously optimistic, with a consensus rating of "Moderate Buy."

    • Price Targets: The average price target as of late 2025 sits at approximately $211.00, representing potential upside from current levels.
    • Institutional Sentiment: Large institutions like Vanguard and BlackRock remain the primary holders. Hedge fund activity has been mixed, with some moving into faster-growing mid-cap rivals, while value-oriented funds see EPAM’s 2025 valuation as an attractive entry point for a high-quality asset.

    Regulatory, Policy, and Geopolitical Factors

    EPAM must navigate a complex regulatory environment:

    • EU AI Act: EPAM’s significant presence in the EU means it must ensure all its AI delivery frameworks comply with the world’s first major AI regulation.
    • Visa Policies: Changes in H-1B or L-1 visa policies in the United States could impact EPAM’s ability to bring specialists to client sites, though its decentralized global model provides a natural hedge.
    • Tax Incentives: EPAM has historically benefited from R&D tax credits in CEE. Any shift in these policies as countries look to fund post-war reconstructions could impact net margins.

    Conclusion

    EPAM Systems is a company in the midst of a profound metamorphosis. It has successfully survived a geopolitical crisis that would have bankrupted a lesser firm, and it is now reinventing its business model for the age of Generative AI.

    For investors, the current period represents a "wait and see" moment. The revenue growth is returning, but margins are under pressure as the company integrates its recent acquisitions and invests in the next generation of technology. If Balazs Fejes can successfully merge EPAM’s engineering DNA with a more aggressive, consulting-led commercial strategy, the company is well-positioned to lead the next wave of digital transformation. However, the path is fraught with the challenges of a new leadership era and a rapidly evolving competitive landscape. EPAM remains a "best-in-class" operator, but its days of effortless 20% growth may be a thing of the past, replaced by a more complex, strategic, and globally distributed future.


    This content is intended for informational purposes only and is not financial advice. All stock performance and financial data are current as of December 26, 2025.

  • Walmart (WMT) in 2025: From Retail Giant to Tech Ecosystem

    Walmart (WMT) in 2025: From Retail Giant to Tech Ecosystem

    Date: December 26, 2025

    Introduction

    As the final week of 2025 unfolds, Walmart Inc. (Nasdaq: WMT) stands at a historic crossroads. Long considered the quintessential defensive play in the retail sector, the Bentonville, Arkansas-based giant has spent the last year shattering old perceptions. With its recent high-profile transition from the New York Stock Exchange to the Nasdaq on December 9, 2025, Walmart has signaled to the world that it no longer views itself as a mere brick-and-mortar chain, but as a "tech-powered omnichannel ecosystem." In a year defined by high interest rates and shifting consumer habits, Walmart has not only survived but thrived, capturing market share across all income brackets and successfully diversifying its profit streams into high-margin advertising and automated logistics.

    Historical Background

    Walmart’s journey began in 1962 when Sam Walton opened the first "Wal-Mart Discount City" in Rogers, Arkansas. Walton’s revolutionary strategy was simple yet disruptive: operate in small rural towns that competitors ignored, maintain a lean cost structure, and pass every cent of savings to the consumer—a philosophy known as "Everyday Low Price" (EDLP).

    By the 1970s, the company went public, and by the 1990s, it had become the largest retailer in the world. Key milestones include the 1983 launch of Sam’s Club and the 1991 international expansion into Mexico. Over the last decade, however, the narrative shifted from physical expansion to digital survival. Under the leadership of Doug McMillon, the company underwent a massive transformation, acquiring Jet.com in 2016 and India’s Flipkart in 2018, effectively pivoting the organization toward a future where "the store" is just one component of a larger digital and physical infrastructure.

    Business Model

    Walmart operates a massive, three-pronged business model designed to leverage scale and data.

    • Walmart US: The crown jewel, contributing nearly 70% of total sales. It dominates the U.S. grocery market, which serves as the primary driver of foot traffic and digital orders.
    • Walmart International: This segment focuses on high-growth emerging markets. While the company has divested from some slower markets (like the UK and Japan), it has doubled down on India (Flipkart/PhonePe) and Mexico (Walmex), targeting the growing middle class in these regions.
    • Sam’s Club: A membership-only warehouse model that contributes roughly 13% of revenue. It serves as an incubator for technology, such as "Scan & Go" and AI-driven inventory management.

    The genius of the modern Walmart model is the "flywheel." Low-cost groceries attract customers; those customers join Walmart+ (membership); the resulting data fuels Walmart Connect (advertising); and the massive volume allows Walmart to build an automated supply chain that competitors cannot replicate.

    Stock Performance Overview

    The performance of WMT shares over the past two years has been nothing short of exceptional. Following a historic 3-for-1 stock split in February 2024, the stock became a favorite among retail investors.

    • 1-Year Performance: In 2025, WMT shares surged 23%, fueled by consistent earnings beats and the successful integration of its media and tech acquisitions.
    • 5-Year Performance: The stock has more than doubled in value, significantly outperforming the broader S&P 500. This period represents the market's re-rating of Walmart from a value stock to a growth/tech hybrid.
    • 10-Year Performance: Investors have enjoyed a compounding effect of roughly 12-14% annually (including dividends), a testament to the company’s ability to reinvent itself while maintaining its dividend aristocrat status.

    Financial Performance

    In the fiscal year ending 2025, Walmart reported staggering total revenue of approximately $681 billion, a 5.1% year-over-year increase. More importantly, operating income grew at 8.6%, significantly faster than sales—a clear indicator that the shift toward high-margin services is working.

    • Margins: Gross margins have stabilized at 24.8%, despite inflationary pressures.
    • Debt & Cash Flow: The company maintains a healthy debt-to-equity ratio of 0.67 and continues to generate robust free cash flow, allowing for the completion of the $2.3 billion Vizio acquisition without straining the balance sheet.
    • Valuation: Currently trading at a trailing P/E of approximately 39x, Walmart is no longer "cheap" by traditional retail standards, but many analysts argue the premium is justified by its dominant tech stack and advertising growth.

    Leadership and Management

    CEO Doug McMillon, a Walmart veteran who started in a distribution center, has been the architect of the company’s modern era. His "People-Led, Tech-Powered" strategy has been widely praised for balancing the needs of 2.1 million global employees with the demands of a digital-first economy.
    The management team has been restructured to emphasize technology, with Chief Technology Officers and Chief Data Officers playing central roles in capital allocation decisions. The board’s recent decision to move to the Nasdaq reflects a governance-level commitment to aligning with the world's leading technology companies.

    Products, Services, and Innovations

    Innovation is no longer a buzzword at Walmart; it is a core operational reality.

    • Automated Fulfillment: By late 2025, 60% of Walmart’s distribution centers have been automated, drastically reducing the cost of last-mile delivery and improving inventory accuracy.
    • Drone Delivery: Walmart now operates the largest drone delivery network in the U.S., covering several major metropolitan areas and delivering items in under 30 minutes.
    • Generative AI: The "Search by Intent" feature in the Walmart app uses GenAI to help customers shop for life events (e.g., "organize a gluten-free backyard BBQ") rather than just searching for individual items.
    • Walmart Connect: This advertising arm has seen 50% YoY growth, leveraging customer data to provide brands with highly targeted ad placements both online and on-store screens.

    Competitive Landscape

    Walmart remains in a fierce battle with Amazon.com, Inc. (Nasdaq: AMZN). While Amazon leads in general e-commerce, Walmart maintains a significant lead in online groceries (roughly 37% market share). Its "store-as-a-hub" model, which places 90% of the U.S. population within 10 miles of a Walmart, gives it a logistics advantage that Amazon’s warehouse-centric model struggles to match in the fresh food category.
    Against Target Corporation (NYSE: TGT) and Costco Wholesale Corporation (Nasdaq: COST), Walmart has gained significant ground in 2025. Its price leadership has attracted affluent households—75% of Walmart’s recent market share gains came from households earning over $100,000 annually—who are "trading down" to manage their budgets.

    Industry and Market Trends

    The retail industry in late 2025 is dominated by the "China Plus One" strategy. To mitigate geopolitical risks and potential tariffs, Walmart has diversified its supply chain, tripling its exports from India and increasing sourcing from Vietnam. Furthermore, the rise of "retail media" (advertising within retail ecosystems) has become the primary driver of margin expansion across the sector, a trend Walmart is currently leading.

    Risks and Challenges

    Despite its dominance, Walmart faces several headwinds:

    • Regulatory Scrutiny: The FTC remains watchful of Walmart’s dominance in the retail media space, particularly following the Vizio acquisition.
    • Labor Costs: Persistent pressure to raise wages remains. In 2025, starting salaries for specialized roles like truck drivers have climbed to $115,000 to combat labor shortages.
    • Geopolitical Tariffs: As a massive importer, Walmart is highly sensitive to trade tensions between the U.S. and China, which can squeeze margins or force price hikes.

    Opportunities and Catalysts

    • Vizio Integration: The full integration of Vizio’s SmartCast OS in 2025 allows Walmart to turn "the living room into a storefront," offering shoppable ads directly through television sets.
    • India IPOs: Potential public listings for Flipkart and PhonePe in the near future could unlock significant shareholder value.
    • Nasdaq-100 Inclusion: Following its move to the Nasdaq, the stock is expected to see massive passive inflows as it is added to major tech-heavy indices.

    Investor Sentiment and Analyst Coverage

    Wall Street is overwhelmingly bullish on WMT. Currently, over 80% of covering analysts maintain a "Buy" or "Strong Buy" rating. The consensus view is that Walmart has successfully transitioned from a cyclical retailer to a secular growth story. Institutional ownership remains high, and the stock is increasingly viewed as a "safe haven" during periods of market volatility due to its essential goods dominance.

    Regulatory, Policy, and Geopolitical Factors

    Walmart's scale makes it a de facto arm of U.S. economic policy. It is a key player in discussions regarding the national minimum wage and trade policy. The company’s move toward sustainability—aiming for zero emissions by 2040—has also made it a favorite for ESG-focused institutional investors, though it continues to face criticism from labor groups regarding worker benefits and unionization.

    Conclusion

    Walmart Inc. has entered 2025 not just as a survivor of the retail apocalypse, but as its victor. By merging the physical reach of its 10,000+ global stores with a cutting-edge digital and advertising infrastructure, the company has created a moat that is wider than ever. For investors, WMT represents a unique blend of stability and high-tech growth. While the valuation is higher than in decades past, the company’s pivot to high-margin revenue streams suggests that the "new" Walmart is just getting started. As we look toward 2026, the key for investors will be monitoring the execution of its automated supply chain and the continued growth of Walmart Connect.


    This content is intended for informational purposes only and is not financial advice.

  • The Great Rebuilding: A Deep Dive into Boeing’s 2025 Turnaround Progress

    The Great Rebuilding: A Deep Dive into Boeing’s 2025 Turnaround Progress

    Today’s Date: December 25, 2025

    Introduction

    The story of The Boeing Company (NYSE: BA) in 2025 has been defined by a grueling, deliberate climb back from the brink. Once the gold standard of American industrial engineering, Boeing spent much of the early 2020s mired in safety scandals, production halts, and a bruising liquidity crisis. However, as 2025 draws to a close, the narrative is shifting from "survival" to "stabilization." With a new leadership team in place, a massive $21 billion capital infusion under its belt, and the critical reintegration of its primary parts supplier, Boeing is finally demonstrating the early signs of a long-awaited turnaround. While the road to full recovery remains steep, the stock’s 25% year-to-date rally suggests that investors are finally beginning to price in a future where Boeing is once again a functional titan of the skies.

    Historical Background

    Founded in 1916 by William Boeing in Seattle, the company was instrumental in the birth of the jet age, producing legendary aircraft like the 707, the 747 "Queen of the Skies," and the B-17 Flying Fortress during WWII. For decades, Boeing was an engineering-led firm where technical perfection was the primary KPI.

    The company’s modern identity, however, was forged by the 1997 merger with McDonnell Douglas. Many analysts point to this moment as a cultural pivot where financial engineering began to overshadow aerospace engineering. This shift arguably culminated in the 737 MAX crisis (2018-2019) and subsequent production lapses on the 787 Dreamliner. The 2024 door-plug blowout on an Alaska Airlines flight served as a final, painful wake-up call, forcing a total overhaul of the company’s executive ranks and operational philosophy.

    Business Model

    Boeing operates as a massive industrial duopoly (alongside Airbus) in the commercial aerospace sector. Its business is divided into three core segments:

    1. Boeing Commercial Airplanes (BCA): The flagship unit, producing the 737, 767, 777, and 787 families. This segment is the primary driver of long-term growth and free cash flow.
    2. Boeing Defense, Space & Security (BDS): A top-tier defense contractor producing fighter jets (F-15EX, F/A-18), tankers (KC-46), and space systems (Starliner).
    3. Boeing Global Services (BGS): A high-margin, steady-revenue segment providing maintenance, parts, and training to both commercial and defense customers.

    The business model relies on a multi-year (often decadal) product cycle with massive upfront R&D costs, followed by decades of recurring revenue from aircraft deliveries and aftermarket services.

    Stock Performance Overview

    As of late December 2025, Boeing’s stock is trading at approximately $217, up significantly from its 2024 lows of $140.

    • 1-Year Performance: A robust ~24% gain, largely driven by the resolution of the IAM union strike and the successful $21 billion equity raise in late 2024.
    • 5-Year Performance: Still down significantly from pre-2020 levels, reflecting the "lost years" of the MAX grounding and pandemic-era debt accumulation.
    • 10-Year Performance: Boeing has vastly underperformed the S&P 500, trading well below its 2019 all-time high of ~$440. For long-term holders, the stock has been a exercise in patience and volatility.

    Financial Performance

    Boeing’s financials in 2025 represent a transition from "bleeding cash" to "breakeven."

    • Cash Flow: In Q3 2025, the company achieved its first positive free cash flow (FCF) in years, reporting roughly $240 million. While modest, it was a symbolic victory.
    • Revenue: Q3 2025 revenue hit $23.3 billion, a 30% year-over-year increase as deliveries finally stabilized.
    • Liquidity and Debt: The October 2024 $21.1 billion capital raise was a masterstroke of timing, preventing a credit downgrade to "junk" status. Boeing ended 2024 with over $26 billion in cash, allowing it to pay down $3.5 billion in maturing debt in May 2025.
    • The Backlog: Boeing sits on a massive $521 billion backlog with nearly 6,000 aircraft on order, ensuring that demand is not the problem—execution is.

    Leadership and Management

    The defining factor of the 2025 turnaround is CEO Kelly Ortberg, who took over in August 2024. Ortberg has moved aggressively to dismantle the "corporate silo" culture:

    • Relocation to Seattle: In a symbolic move, Ortberg moved his office from Virginia back to the Seattle area to be physically present on the factory floors.
    • Engineering Focus: He has prioritized "engineering excellence" over financial metrics, famously refusing to raise production rates until manufacturing KPIs were stabilized.
    • Streamlining: Ortberg oversaw a 10% workforce reduction in early 2025, aimed at cutting middle-management bureaucracy that had previously slowed safety reporting.

    Products, Services, and Innovations

    Boeing’s portfolio is currently a mix of aging workhorses and delayed future-tech:

    • 737 MAX: The breadwinner. Production has finally stabilized at the FAA-capped 38 units per month, with plans to move to 42 in 2026.
    • 777X: The program remains a headache, with first deliveries now pushed to 2027. Recent technical issues with the GE9X engine mounts in late 2025 have added fresh certification hurdles.
    • 787 Dreamliner: Stable production at 5 units per month, with a target of 10 by late 2026.
    • Innovations: Boeing is heavily invested in the Sustainable Flight Demonstrator (X-66) and autonomous flight through its Wisk subsidiary, though these remain long-term R&D plays.

    Competitive Landscape

    The global aerospace market remains a duopoly, but Boeing’s position has weakened relative to Airbus (EADSY). Airbus’s A321XLR has dominated the mid-range market, a segment where Boeing lacks a direct "clean-sheet" competitor. Furthermore, China’s COMAC is beginning to gain traction with the C919, though it remains a domestic-heavy threat for now. Boeing’s competitive edge remains its massive installed base and the high switching costs for airlines already committed to Boeing flight decks and maintenance ecosystems.

    Industry and Market Trends

    The industry is currently defined by a "supply-demand mismatch." Global air travel has fully surpassed 2019 levels, and airlines are desperate for new, fuel-efficient jets to meet carbon goals and lower operational costs. However, the aerospace supply chain remains fragile, hampered by labor shortages and raw material bottlenecks. Boeing’s recovery is as much about its suppliers (like Spirit AeroSystems) as it is about its own assembly lines.

    Risks and Challenges

    • 777X Certification: Further delays to 2028 or beyond would be a massive blow to credibility and lead to significant airline compensation penalties.
    • Debt Burden: Despite the 2024 capital raise, Boeing still carries significant debt that will require years of high-margin deliveries to pay down.
    • Regulatory Scrutiny: The FAA remains "embedded" in Boeing’s factories. Any new quality lapse would likely lead to immediate production freezes.
    • Geopolitical Friction: Trade tensions with China continue to limit Boeing’s ability to tap into the world’s fastest-growing aviation market.

    Opportunities and Catalysts

    • Spirit AeroSystems Integration: Completed on December 8, 2025, the reintegration of Spirit allows Boeing to control its fuselage quality directly, potentially ending the "traveled work" issues that have plagued the 737.
    • Production Ramp: Moving from 38 to 47 MAXs per month by mid-2026 would provide a massive boost to free cash flow.
    • Defense Rebound: After years of losses on fixed-price contracts, the BDS segment is beginning to see better pricing on new awards.

    Investor Sentiment and Analyst Coverage

    Wall Street sentiment has shifted from "Avoid" to "Cautious Optimism."

    • Consensus: Moderate Buy.
    • The Bull Case (e.g., JP Morgan): Focuses on the "aging global fleet" and Boeing’s $500B+ backlog, seeing a path to $245+ as production stabilizes.
    • The Bear Case (e.g., William Blair): Cites the "mountain of work" still needed for 777X certification and the risk of further execution missteps.
      Investors are largely viewing Boeing as a "2026-2027 story," willing to forgive current losses if the operational foundation is truly being fixed.

    Regulatory, Policy, and Geopolitical Factors

    Boeing is more than a company; it is a vital organ of the U.S. economy and defense apparatus. As the largest U.S. exporter, it benefits from significant political support, but that comes with intense oversight. The "National Security" label has helped Boeing secure defense contracts but also makes it a primary target in trade wars, particularly with China, which has increasingly favored Airbus and its own COMAC aircraft in recent years.

    Conclusion

    As we look toward 2026, Boeing is no longer the company in freefall that it was in 2024. The "Ortberg Era" has brought a sober, engineering-first mentality back to the C-suite. The $21 billion capital raise and the Spirit AeroSystems acquisition have provided the financial and operational "reset" the company desperately needed. However, Boeing is not yet out of the clouds. The 777X delays and the lingering debt load mean there is zero margin for error. For investors, Boeing represents a high-conviction bet on the resilience of a national champion. If the company can achieve its production targets in 2026, the current $217 share price may look like a bargain; if quality issues resurface, the 2025 recovery could prove to be a temporary altitude gain before another descent.


    This content is intended for informational purposes only and is not financial advice.

  • Autodesk (ADSK): The Direct Billing Pivot and the Future of Design-to-Make AI

    Autodesk (ADSK): The Direct Billing Pivot and the Future of Design-to-Make AI

    Date: December 25, 2025

    Introduction

    As 2025 draws to a close, Autodesk, Inc. (NASDAQ: ADSK) stands at a critical juncture in its 43-year history. Long regarded as the undisputed titan of Computer-Aided Design (CAD), the company has recently navigated a turbulent period characterized by accounting investigations, a high-stakes battle with activist investor Starboard Value, and a fundamental overhaul of its sales model. Yet, underneath the corporate drama lies a business that is arguably more resilient than ever. With nearly 98% of its revenue now derived from recurring subscriptions and a pioneering role in the application of "Agentic AI" for the physical world, Autodesk is transitioning from a software provider into the "design-to-make" operating system for the global economy. This article explores the company’s recent momentum, its strategic pivot toward direct billing, and why its subscription health remains the primary engine for future growth.

    Historical Background

    Autodesk was founded in 1982 by John Walker and a group of 15 co-founders with a simple but revolutionary goal: to bring professional-grade drafting software to the personal computer. Their flagship product, AutoCAD, democratized design, allowing architects and engineers to move away from drawing boards and onto the screen.

    Over the decades, the San Francisco-headquartered firm expanded its footprint through aggressive R&D and strategic acquisitions, moving beyond 2D drafting into 3D modeling, Building Information Modeling (BIM), and visual effects. However, the most defining chapter in its history began in 2015, when the company announced it would abandon its decades-old practice of selling perpetual licenses in favor of a cloud-based subscription model. This "burning of the boats" was painful for both customers and investors, initially leading to a revenue trough known as the "Valley of Death." By 2020, the transition was largely hailed as a success, setting the stage for the highly predictable, cash-flow-rich business model Autodesk maintains today.

    Business Model

    Autodesk’s business model is built on four core pillars, serving industries that represent a significant portion of global GDP:

    1. Architecture, Engineering, and Construction (AEC): The largest segment (~48% of revenue), anchored by Revit and Civil 3D.
    2. AutoCAD & AutoCAD LT: The foundational general-purpose design tools (~26% of revenue).
    3. Manufacturing (MFG): Driven by Fusion (formerly Fusion 360) and Inventor, this segment focuses on product design and lifecycle management (~19% of revenue).
    4. Media & Entertainment (M&E): Industry standards like Maya and 3ds Max, used in virtually every blockbuster film and video game (~7% of revenue).

    In 2024 and 2025, the company introduced its New Transaction Model, a strategic shift where Autodesk bills customers directly while maintaining its reseller network as "agents." This model allows Autodesk to own the customer data and pricing control while improving renewal visibility, representing the final stage of its evolution into a modern SaaS powerhouse.

    Stock Performance Overview

    Autodesk’s stock performance has been a tale of two eras. Over the 10-year horizon, the stock has delivered a staggering return of approximately 374%, significantly outperforming the broader market as investors rewarded the SaaS transition.

    However, the 5-year window has been more challenging, with the stock delivering a roughly flat return (~ -0.3%) as of late 2025. This stagnation was driven by a compression in growth premiums across the tech sector and internal volatility. Over the past year, the stock has seen a modest recovery of 2.2%, trailing the S&P 500 but showing signs of stabilization as the company settled with activist investors and proved that its "direct billing" model would not disrupt the sales channel as much as feared.

    Financial Performance

    In Fiscal Year 2025, Autodesk reported total revenue of $6.13 billion, a 12% increase year-over-year. By Q3 2025, momentum accelerated further, with quarterly revenue reaching $1.85 billion—an 18% jump that beat Wall Street estimates.

    Key financial metrics highlight the company’s efficiency:

    • Recurring Revenue: Now accounts for 97-98% of total revenue.
    • Operating Margins: Non-GAAP operating margins have reached a robust 36-37%, reflecting better cost controls post-Starboard settlement.
    • Free Cash Flow (FCF): The company generated $1.57 billion in FCF for FY2025, although this metric was the subject of intense scrutiny during a 2024 accounting probe.
    • Valuation: Trading at roughly 35x forward earnings, Autodesk is no longer the "growth-at-any-cost" play it was in 2020, but it remains a premium-valued industrial software leader.

    Leadership and Management

    CEO Andrew Anagnost, who took the helm in 2017, has been the primary architect of the company’s cloud-first strategy. While his tenure has been marked by successful financial transitions, 2024 brought significant leadership challenges. An internal accounting investigation into how FCF and margins were reported led to the reassignment of CFO Deborah Clifford.

    In late 2024, Autodesk appointed Janesh Moorjani (formerly of Elastic) as CFO, a move that helped stabilize investor confidence. Following pressure from Starboard Value, the company also reshaped its board in 2025, adding governance veterans Jeff Epstein and Christie Simons. This new "governance-first" leadership team is now focused on operational rigor rather than just top-line growth.

    Products, Services, and Innovations

    Innovation at Autodesk has moved from simple modeling to "Outcome-Based Design." The company’s focus is now on three industry clouds: Autodesk Forma (AEC), Autodesk Fusion (MFG), and Autodesk Flow (M&E).

    The crown jewel of their current R&D is Autodesk AI. In late 2025, the company debuted "Neural CAD," an AI model capable of automating 90% of geometry creation for mechanical parts. By integrating AI that understands the "physics" of the real world—such as structural loads and manufacturing constraints—Autodesk is positioning its software not just as a canvas, but as an active collaborator in the engineering process.

    Competitive Landscape

    Autodesk occupies a unique "moat" because its file formats (.dwg, .rvt) are the global standards. However, it faces formidable rivals:

    • AEC: Bentley Systems (NASDAQ: BSY) remains the leader in heavy infrastructure (roads, bridges), while Nemetschek competes strongly in Europe. Procore (NYSE: PCOR) is the primary rival in the construction management space.
    • Manufacturing: Dassault Systèmes (OTC: DASTY) and Siemens dominate high-end automotive and aerospace, while PTC (NASDAQ: PTC) is a fierce competitor in the mid-market SaaS space with its Onshape and Creo+ platforms.
    • M&E: While Adobe (NASDAQ: ADBE) dominates 2D creative, Autodesk remains the standard for 3D animation and rendering.

    Industry and Market Trends

    Several macro tailwinds are driving Autodesk’s growth in late 2025:

    • Infrastructure Spending: The U.S. Infrastructure Investment and Jobs Act (IIJA) has finally begun to trickle down into design contracts, fueling a 14% growth in Autodesk's civil engineering segment.
    • Digital Twins: There is a rising demand for "Digital Twins"—virtual replicas of physical buildings that allow for real-time energy monitoring and maintenance.
    • Labor Shortage: A global shortage of skilled construction and manufacturing workers is forcing firms to adopt Autodesk’s automation and AI tools to increase productivity per worker.

    Risks and Challenges

    Despite its strengths, Autodesk faces several hurdles:

    • Governance Hangover: The 2024 accounting probe, while resulting in no restatements, damaged the company’s reputation for transparency.
    • Direct Billing Friction: The transition to direct billing (the New Transaction Model) has caused some friction within its global reseller network, potentially opening a window for competitors to poach unhappy partners.
    • China Exposure: As geopolitical tensions rise, Autodesk’s growth in the APAC region has slowed, with Chinese domestic competitors like ZWSOFT gaining ground in the local market.

    Opportunities and Catalysts

    Looking into 2026, two major catalysts stand out:

    1. Direct-to-Customer Upsell: By owning the transaction directly, Autodesk can use granular usage data to upsell customers on high-margin specialized extensions within Fusion and Forma.
    2. AI Monetization: Autodesk has begun testing "Token-based" pricing for its most advanced AI features, which could provide a new, high-margin revenue stream beyond the base subscription fee.

    Investor Sentiment and Analyst Coverage

    As of December 2025, Wall Street sentiment is cautiously optimistic, with a consensus "Moderate Buy" rating. Following the Q3 2025 earnings beat and the settlement with Starboard Value, several analysts raised their price targets to the $360-$370 range. Investors are particularly pleased with the stabilization of the CFO office and the company's commitment to returning capital through share buybacks, which totaled over $1 billion in the last fiscal year.

    Regulatory, Policy, and Geopolitical Factors

    Autodesk is heavily influenced by government policy. The company has been a vocal supporter of BIM (Building Information Modeling) mandates, which are increasingly required for government projects in the UK, EU, and parts of the US. On the regulatory front, the EU AI Act has forced Autodesk to be more transparent about the datasets used to train its generative design models, a move that could potentially slow some R&D but also creates a "trust barrier" that helps incumbents over smaller, less-compliant startups.

    Conclusion

    Autodesk has successfully navigated the most challenging period of its post-SaaS transition. By resolving its governance disputes and successfully launching its direct-billing model, the company has cleared the decks for a new era of growth driven by AI and infrastructure demand. While macro risks in China and competition in the manufacturing sector persist, Autodesk’s status as the industry standard and its 98% recurring revenue base make it a cornerstone of the industrial software landscape. For investors, the focus for 2026 will be on whether the "New Transaction Model" can deliver the margin expansion the board has promised—and whether "Neural CAD" can turn AI hype into tangible subscription momentum.


    Disclaimer: This content is intended for informational purposes only and is not financial advice.

  • The Beauty of a Turnaround: Why Ulta Beauty is Reclaiming Its Throne in 2025

    The Beauty of a Turnaround: Why Ulta Beauty is Reclaiming Its Throne in 2025

    Ulta Beauty enters the final week of 2025 as a triumph of resilient retail strategy. Just 18 months ago, investors were fleeing the stock as competition from Sephora—owned by LVMH (OTC: LVMUY)—and the encroaching shadow of Amazon (NASDAQ: AMZN) threatened Ulta’s unique market position. Today, the stock trades near all-time highs, propelled by a surprising Q3 earnings report that saw the company beat both top and bottom-line estimates. With a new CEO at the helm and a bold move into the Mexican and European markets, Ulta has silenced critics who argued its growth story was over.

    Historical Background

    Founded in 1990 by Richard George and Terry Hanson, Ulta Salon, Cosmetics & Fragrance was a revolutionary concept: a retail destination that bridged the gap between mass-market drugstores and prestige department store counters. The founders recognized that beauty consumers didn't just shop in one category; they mixed $5 mascaras with $60 face creams.

    Over the decades, Ulta underwent several key transformations. It transitioned from a regional player to a national powerhouse under the leadership of Mary Dillon (2013–2021), who expanded the store footprint and digitized the business. The company survived the "retail apocalypse" by leaning into its salon services—hair, brows, and skin—which provided an experience that e-commerce could not replicate. By 2025, Ulta has evolved from a U.S. domestic retailer into a global omnichannel platform.

    Business Model

    Ulta Beauty’s business model is built on the "Power of And." It is the only retailer that offers a comprehensive "Mass-to-Prestige" assortment under one roof.

    • Revenue Sources: Approximately 43% of sales come from cosmetics, 20% from skincare, 16% from haircare, and the remainder from fragrance and salon services.
    • Loyalty Ecosystem: The Ultamate Rewards program is the company’s "crown jewel." With over 44 million active members, Ulta possesses one of the most sophisticated consumer databases in retail, allowing for highly personalized marketing.
    • Omnichannel Integration: Ulta operates a seamless "BOPIS" (Buy Online, Pick Up In-Store) model and an increasingly important digital marketplace.
    • Services: Unlike competitors who focus purely on product sales, Ulta’s full-service salons drive repeat foot traffic and foster high customer lifetime value.

    Stock Performance Overview

    The stock’s journey has been a rollercoaster for long-term holders.

    • 1-Year Performance: In 2025, ULTA has surged approximately 42.3%, outperforming the S&P 500 significantly.
    • 5-Year Performance: Looking back to 2020, the stock has nearly doubled, despite a significant "valuation reset" in mid-2024 when the price dipped near $300.
    • 10-Year Performance: Over the past decade, ULTA has been a "multibagger," rewarding patient investors with nearly 350% returns, driven by consistent store expansion and share buybacks.

    The recent 2025 rally was ignited by the market's realization that Ulta’s margins were more resilient than feared, especially as the company pivoted away from its lower-margin Target partnership.

    Financial Performance

    The Q3 2025 results, released in late November, served as a "clear the air" event for the company.

    • Revenue: Net sales hit $2.86 billion, a 12.9% year-over-year increase.
    • Earnings: EPS came in at $5.14, crushing the consensus estimate of $4.52.
    • Comparable Sales: Comp sales grew 6.3%, a massive recovery from the 0.6% growth seen in the same quarter of 2024.
    • Guidance: Management raised full-year 2025 sales guidance to $12.3 billion.
    • Valuation: Despite the price surge, ULTA trades at a P/E ratio of roughly 23x, which many analysts consider reasonable given its renewed growth trajectory.

    Leadership and Management

    2025 marked a historic leadership change. On January 6, 2025, Kecia Steelman succeeded Dave Kimbell as CEO. Steelman, who previously served as COO, was the architect of the "Ulta Beauty Unleashed" strategy. Her leadership has been characterized by operational discipline and a focus on "newness." Under her tenure, the company has successfully integrated the Space NK acquisition and launched the first brick-and-mortar stores in Mexico. Steelman has maintained a strong reputation for governance, emphasizing diversity and inclusion while delivering tangible shareholder value through aggressive share repurchases.

    Products, Services, and Innovations

    Ulta’s innovation pipeline in 2025 has focused on two pillars: Wellness and Global Exclusives.

    • Wellness Expansion: Ulta tripled its shelf space for "Clinical Skincare" and ingestible beauty (supplements) in 2025, capturing a larger share of the wellness-conscious Gen Z and Millennial market.
    • Exclusive Partnerships: The company launched Isima by Shakira and Orebella (Bella Hadid’s fragrance line) as exclusives, driving massive hype on social media.
    • Digital Tools: Ulta’s "GLAMlab" AR tool continues to be a leader in virtual try-ons, reducing return rates for high-end cosmetics.

    Competitive Landscape

    The beauty wars intensified in 2025.

    • Sephora (LVMH): Sephora remains the primary rival in prestige beauty. While Sephora's partnership with Kohl’s (NYSE: KSS) has been successful, Ulta’s decision to sunset its Target (NYSE: TGT) partnership by 2026 suggests a strategic shift to focus on higher-margin standalone stores where Ulta has full brand control.
    • Amazon: Amazon is now the #1 online beauty retailer. To compete, Ulta has leaned into brands that refuse to sell on Amazon to preserve their premium image, as well as its superior in-store experience.
    • Mass Retailers: Walmart (NYSE: WMT) has expanded its beauty aisles, but Ulta’s salon services provide a "moat" that discounters cannot easily cross.

    Industry and Market Trends

    The "Lipstick Index"—the theory that consumers buy small luxuries during economic uncertainty—remained relevant in 2025. While macro-economic pressures slowed spending on big-ticket items, beauty sales remained robust. A key trend this year has been "Premiumization," where consumers are willing to spend more on high-performance skincare while trading down to "dupes" for basic makeup, a shift that Ulta’s mass-to-prestige model captures perfectly.

    Risks and Challenges

    Despite the recent success, several risks remain:

    • Margin Pressures: Higher incentive compensation and rising labor costs in 2025 have pressured operating margins, which sat at 10.8% in Q3.
    • Inventory Shrink: Organized retail theft remains a challenge for beauty retailers due to the high value and small size of the products.
    • Post-Target Transition: Ending the Target partnership in 2026 carries execution risk; Ulta must ensure those customers migrate back to Ulta's own ecosystem.
    • Saturation: With over 1,400 stores, domestic growth in the U.S. is nearing a plateau, making international success critical.

    Opportunities and Catalysts

    • Mexico & Beyond: The 2025 Mexico launch in partnership with Grupo Axo is just the beginning. The company has already opened stores in Mexico City and Guadalajara, with plans for 50+ locations.
    • Space NK Integration: The acquisition of UK-based Space NK gives Ulta a beachhead in Europe, allowing it to compete with Sephora on its home turf.
    • Private Label Growth: The "Ulta Beauty Collection" (private label) continues to grow, offering higher margins than third-party brands.
    • Share Buybacks: Ulta has been a consistent buyer of its own stock, repurchasing nearly $700 million in shares during the first nine months of 2025.

    Investor Sentiment and Analyst Coverage

    Wall Street has turned decidedly bullish. Following the Q3 beat, Oppenheimer and UBS raised their price targets to $675 and $690, respectively.

    • The Berkshire Effect: Notably, Berkshire Hathaway (NYSE: BRK.B) exited its entire ULTA position in late 2024 after a brief holding period. While this initially hurt sentiment, the stock's 100% recovery from its 2024 lows suggests that Warren Buffett may have exited too early, missing the "Kecia Steelman rally."
    • Institutional Support: Large institutional investors like Vanguard and BlackRock remain top holders, viewing the company as a "quality" compounder.

    Regulatory, Policy, and Geopolitical Factors

    • Mexico Expansion Risks: Operating in Mexico brings exposure to currency fluctuations (the Peso) and local labor laws.
    • Consumer Safety: Increasing scrutiny from the FDA regarding "Clean Beauty" labeling and chemical ingredients in cosmetics requires Ulta to maintain rigorous compliance standards.
    • Trade Policy: With many beauty products manufactured in Asia, any shifts in U.S. tariff policy could impact COGS (Cost of Goods Sold).

    Conclusion

    Ulta Beauty’s performance in 2025 is a masterclass in retail resilience. By embracing international expansion, prioritizing high-margin categories like wellness, and doubling down on its loyalty-driven ecosystem, the company has successfully navigated a period of intense competition. The recent stock surge is a reflection of a business that has found its footing under new leadership and is ready to prove that its best days are ahead. For investors, the story to watch in 2026 will be the final decoupling from Target and the pace of the European rollout. Ulta has proven it can survive the beauty wars; now, it is focused on winning them.


    This content is intended for informational purposes only and is not financial advice