As of February 1, 2026, the global financial landscape has been fundamentally rewired by a concept once relegated to the fringes of crypto-economic theory: Information Finance, or "InfoFi." What began as a tool for political junkies to hedge election risks has evolved into the world’s most potent data transmission mechanism. Prediction markets have transitioned from "betting parlors" to the "source of truth" for the global financial machine, with liquidity across major platforms now exceeding $50 billion annually.
The most profound shift, however, is not in who is trading, but what is trading. Today, algorithmic bots—not humans—are the primary participants in prediction markets. These AI agents treat shifts in event probabilities as "truth events," using them as high-speed triggers to execute multi-billion dollar trades in traditional markets like the S&P 500 (NYSEARCA: SPY) and U.S. Treasuries. In this new era, the prediction market moves first, and the rest of the world follows in milliseconds.
The Market: What's Being Predicted
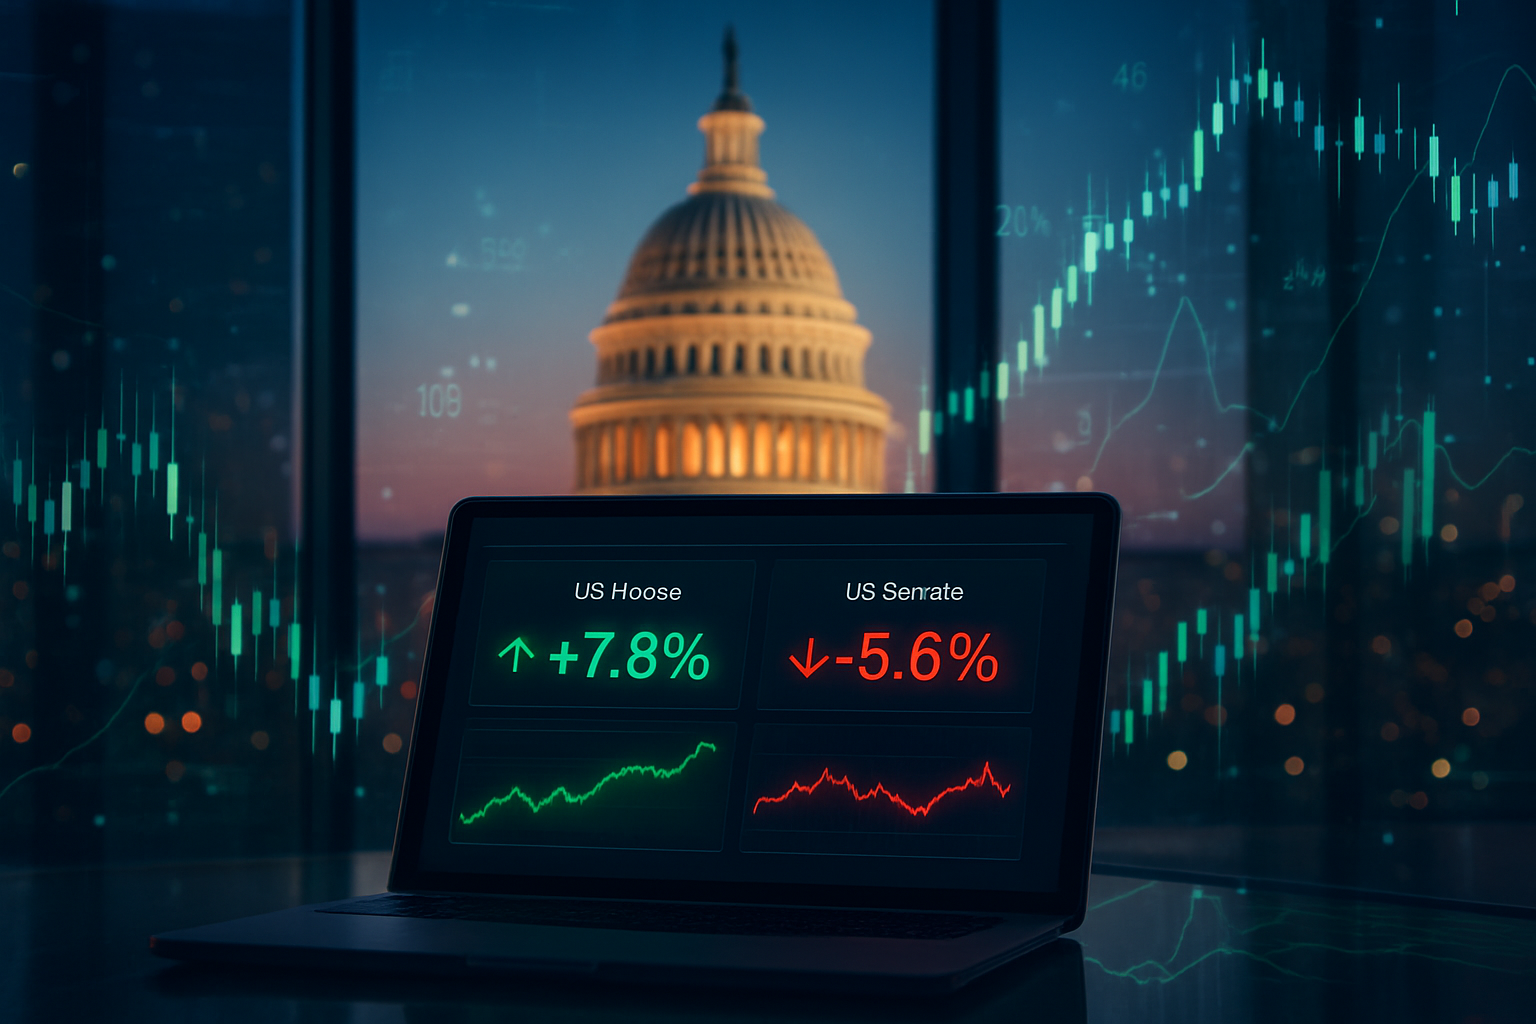
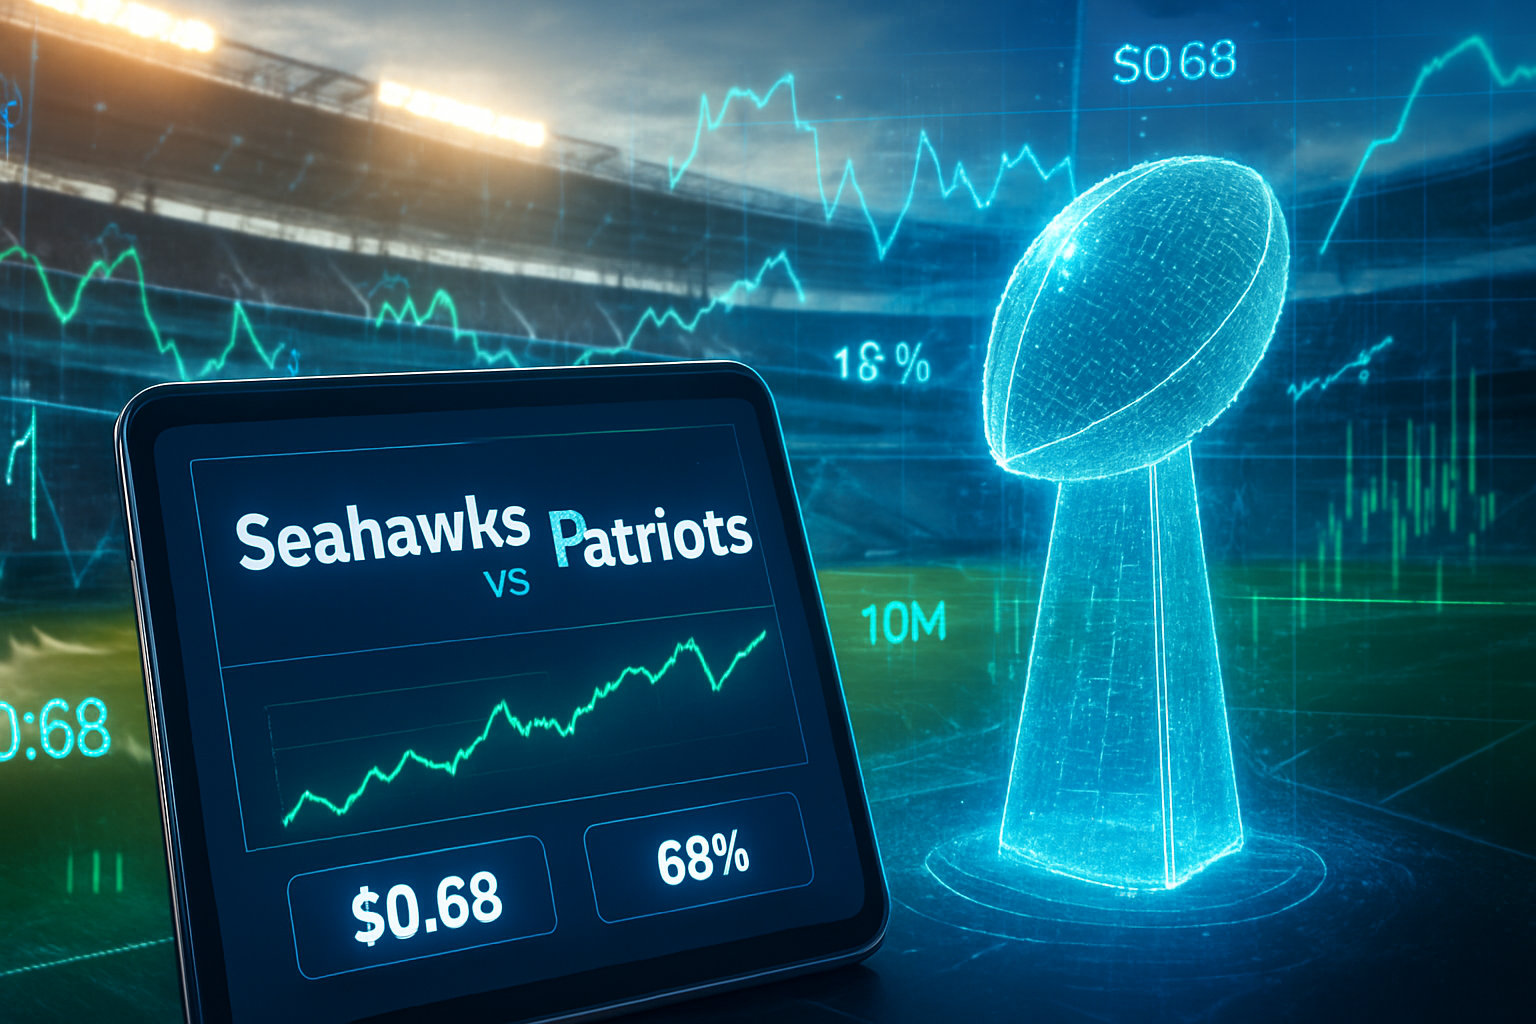
The prediction market landscape in early 2026 is dominated by two giants: the decentralized Polymarket and the federally regulated Kalshi. While these platforms still offer markets on everything from the Oscars to weather events, the high-volume activity is concentrated in macro-economic and geopolitical "nexus events." Currently, the most liquid markets center on Federal Reserve policy, specifically the "March 2026 Rate Cut" and "Year-End Inflation" contracts.
Liquidity has reached a critical mass where "whale" positions—often exceeding $50 million—are common. On Kalshi, the "Federal Reserve Target Rate" contracts have seen their daily volume rival that of traditional interest-rate futures at the CME Group (NASDAQ: CME). The resolution criteria for these markets are ironclad, often tied to official government releases or blockchain-verified data, providing the "clean" data sets that algorithmic models crave.
The speed of price discovery is now staggering. On Feb 1, 2026, a 4% shift in the probability of a "Government Shutdown" on Kalshi was reflected in the market price within 400 milliseconds of a leaked Congressional memo, whereas traditional news wires took nearly three minutes to report the same information. This delta—the "InfoFi Premium"—is where the new generation of traders makes their fortunes.
Why Traders Are Betting
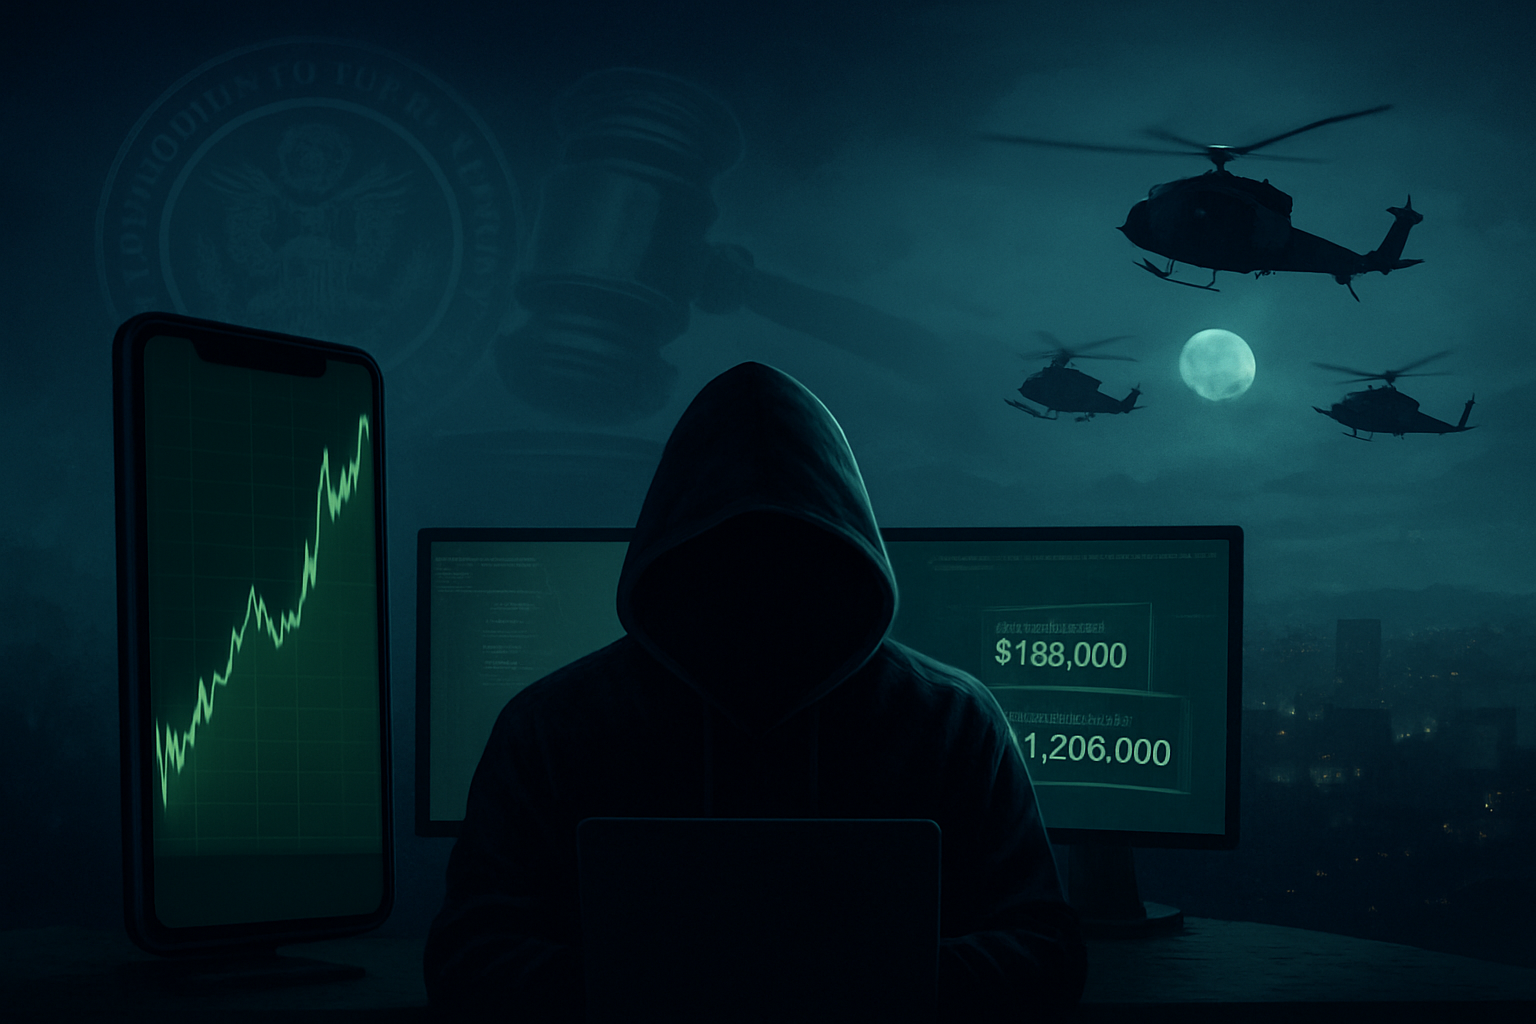
The rise of "Information Arbitrage" is the primary driver behind current market movements. Traditional hedge funds and high-frequency trading (HFT) firms have deployed specialized AI agents, such as the widely discussed "Alphascope" and "Polybro" bots, to scan these markets 24/7. These bots do not just bet on the outcome; they use the outcome as a leading indicator for traditional assets.
For instance, when a prediction market on Polymarket shows an uptick in the probability of a specific regulatory change, bots immediately execute trades in the affected sectors. If a contract for "SEC Leadership Change" moves toward "Yes," bots may preemptively buy or sell the Bitcoin Trust (NASDAQ: IBIT) or shares of Coinbase Global, Inc. (NASDAQ: COIN). Traders are no longer waiting for the news to break; they are trading on the collective intelligence of the "skin-in-the-game" participants who are incentivized to find the truth first.
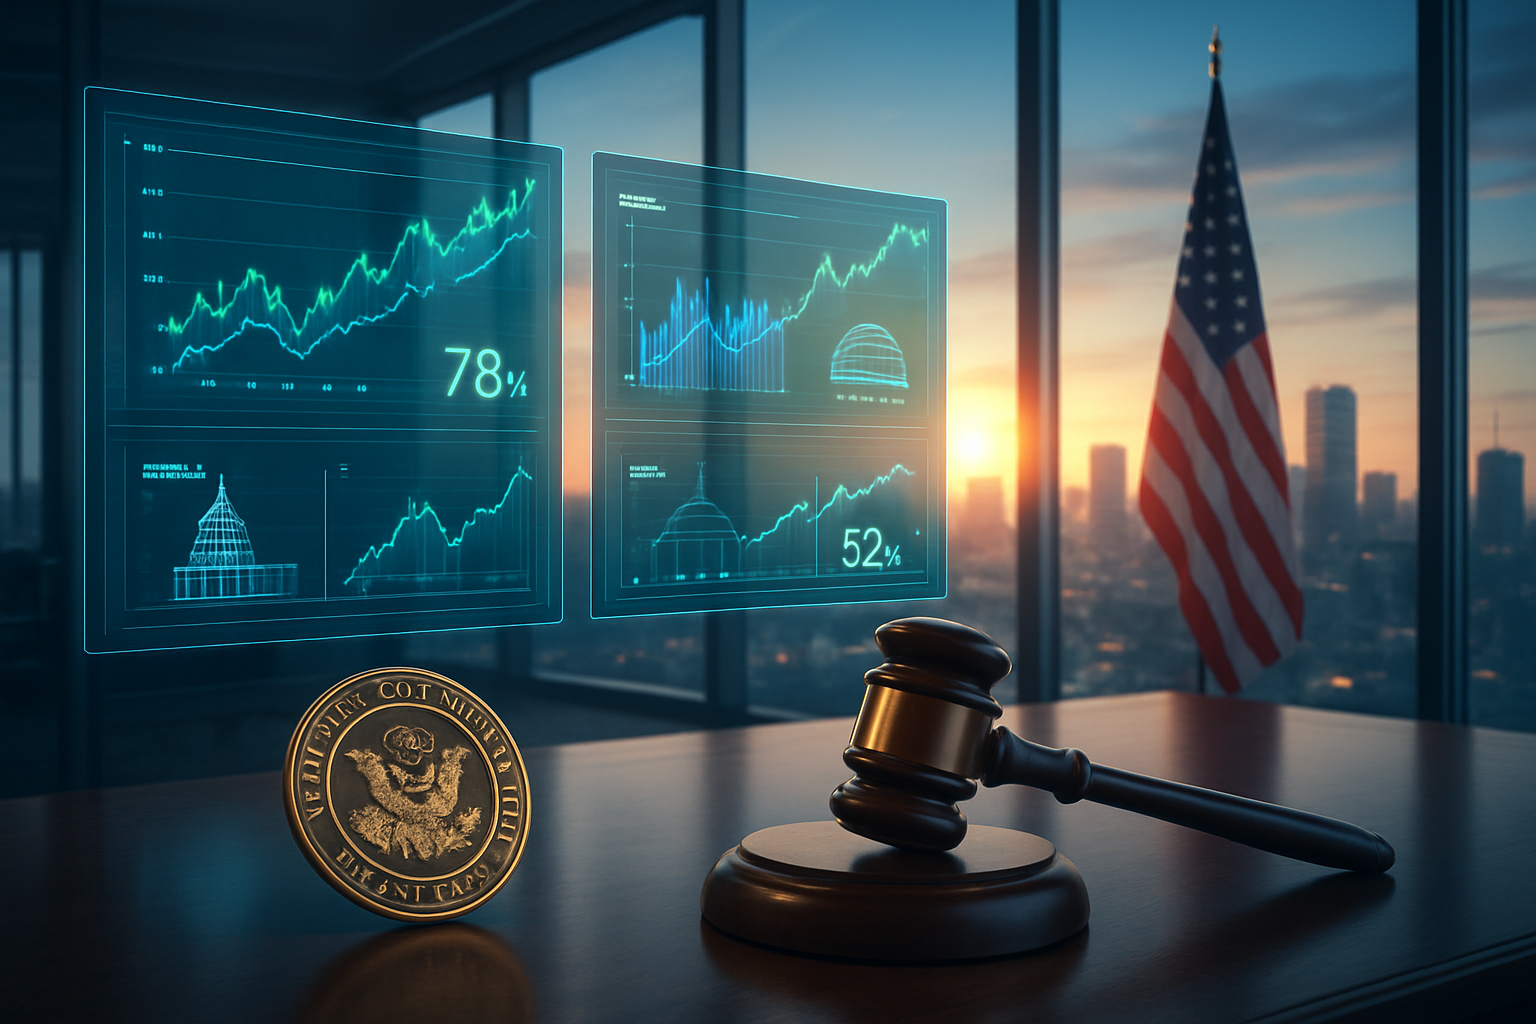
Furthermore, the introduction of the CLARITY Act of 2026 (Digital Asset Market Clarity Act) has legitimized these strategies. The Act provides a clear regulatory framework for "event contracts," allowing institutional giants like Apollo Global Management (NYSE: APO) and BlackRock, Inc. (NYSE: BLK) to treat prediction market positions as legitimate hedges against systemic risk. This institutional inflow has compressed spreads and made prediction market signals more reliable than ever.
Broader Context and Implications
The "feedback loop" between prediction markets and traditional finance has created a self-reinforcing cycle. When a prediction market shifts, it triggers automated selling in the S&P 500 (NYSEARCA: SPY). This market movement is then picked up by other algorithms as a "momentum signal," which in turn causes more traders to enter the prediction market to hedge their newfound exposure. This loop has effectively turned prediction markets into the world’s fastest financial data feed.
This phenomenon reveals a deepening skepticism of traditional media and analyst reports. In the 2026 economy, a "buy" rating from a major bank carries less weight than a 10-cent move in a prediction market. The public sentiment captured here is cold and calculated; it is the sentiment of people willing to lose money if they are wrong, which distinguishes it from the "cheap talk" of social media or cable news.
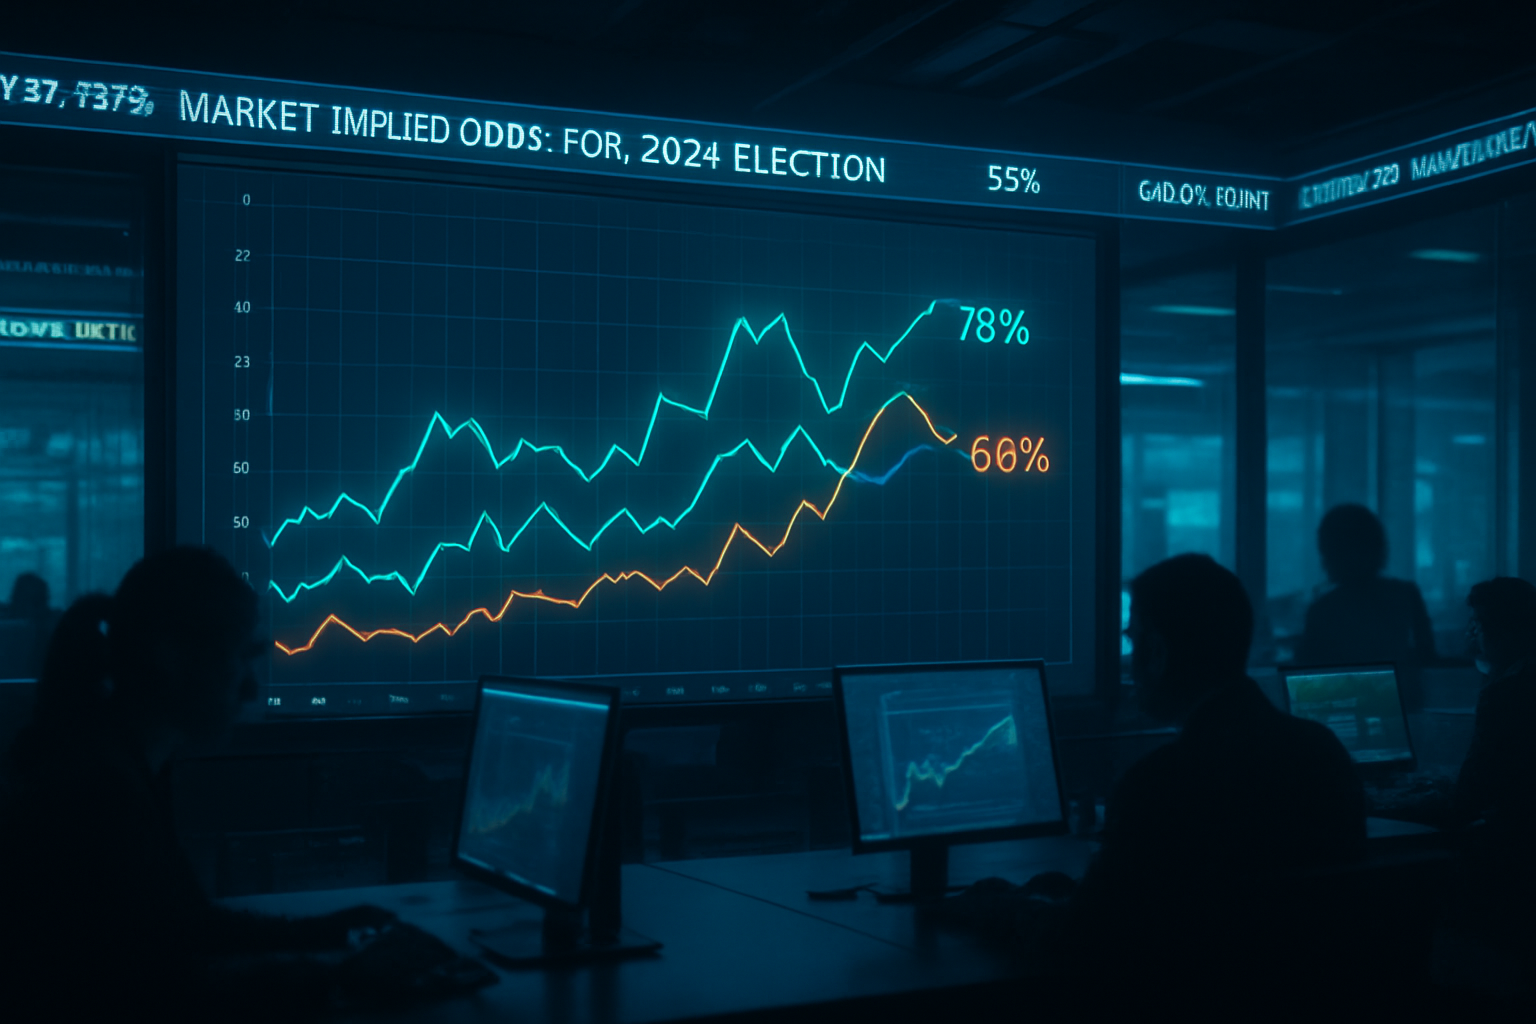
Historically, prediction markets have shown a remarkable ability to outperform "expert" consensus. During the 2024 election cycle and the subsequent economic shifts of 2025, markets like Kalshi consistently priced in outcomes weeks before traditional polling or economic forecasting firms. This accuracy has forced regulators at the CFTC to pivot from a stance of hostility to one of integration, recognizing that these markets provide a vital "early warning system" for the financial stability of the United States.
What to Watch Next
As we move further into 2026, the next major milestone is the full integration of prediction market APIs into mainstream brokerage platforms. Rumors persist that platforms like Charles Schwab (NYSE: SCHW) and Robinhood Markets, Inc. (NASDAQ: HOOD) are preparing to offer "Event Hedging" tabs, allowing retail investors to buy "No" on a recession as easily as they buy an ETF.
The upcoming March FOMC meeting will be the ultimate test of the InfoFi feedback loop. Currently, Kalshi is pricing a 62% chance of a 25-basis-point cut, while traditional Fed Fund Futures are lagging at 54%. If the prediction market proves correct again, it may mark the moment when "Event Contracts" officially replace "Futures" as the primary tool for interest rate discovery.
Additionally, the expansion of "Synthetic Straddles"—where traders hedge physical assets against event outcomes—is expected to grow. Watch for how high-tech firms like NVIDIA Corporation (NASDAQ: NVDA) see their stock volatility correlate with "Taiwan Conflict" or "AI Regulation" contracts. The tighter this correlation becomes, the more the prediction market acts as the "shadow price" for the world's most valuable companies.
Bottom Line
Prediction markets have evolved from a niche curiosity into the central nervous system of global finance. By 2026, "InfoFi" has proven that information is not just something you read—it is something you price. The rise of algorithmic bot trading has eliminated the latency between a "truth event" and a market reaction, making the world more efficient but also more volatile for those who cannot keep pace with the machines.
This shift tells us that the most valuable commodity in the modern economy is no longer oil or even data, but accuracy. Prediction markets provide a ruthless mechanism for filtering noise and surfacing reality. For the modern investor, ignoring these signals is no longer an option; the bots have already integrated them, and the feedback loop is only getting faster.
Whether we are looking at interest rates, election results, or corporate mergers, the prediction market is now the first place the "truth" appears. As institutional adoption continues and regulatory clarity deepens, the line between "betting" and "investing" will continue to blur until it disappears entirely.
This article is for informational purposes only and does not constitute financial or betting advice. Prediction market participation may be subject to legal restrictions in your jurisdiction.
PredictStreet focuses on covering the latest developments in prediction markets. Visit the PredictStreet website at https://www.predictstreet.ai/.