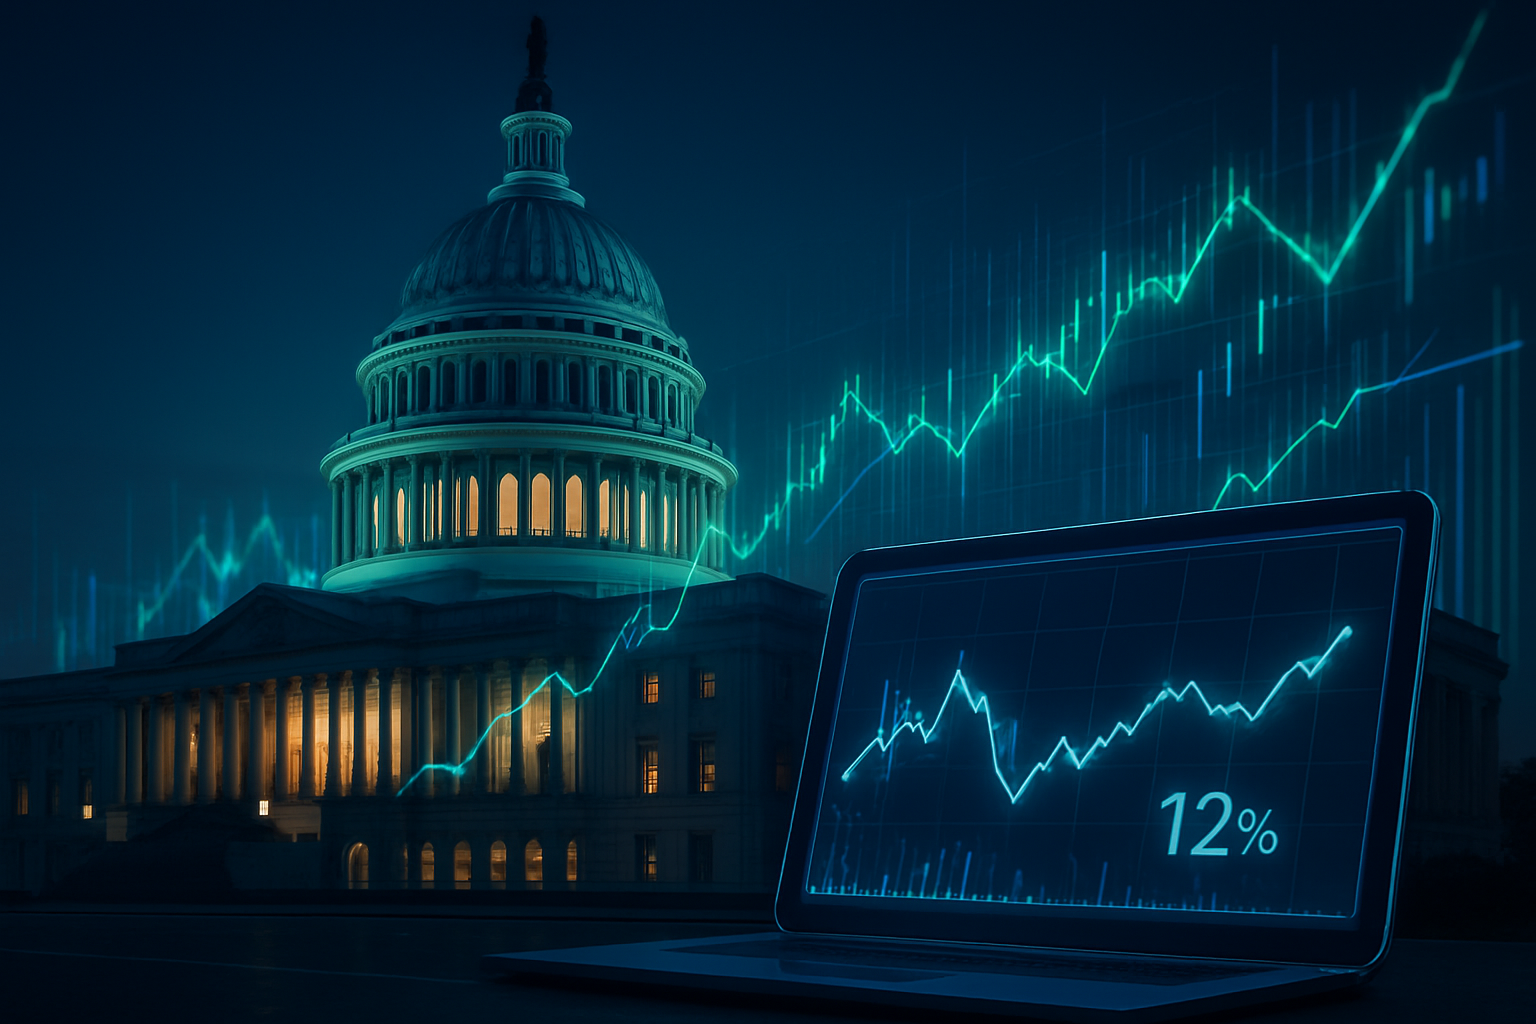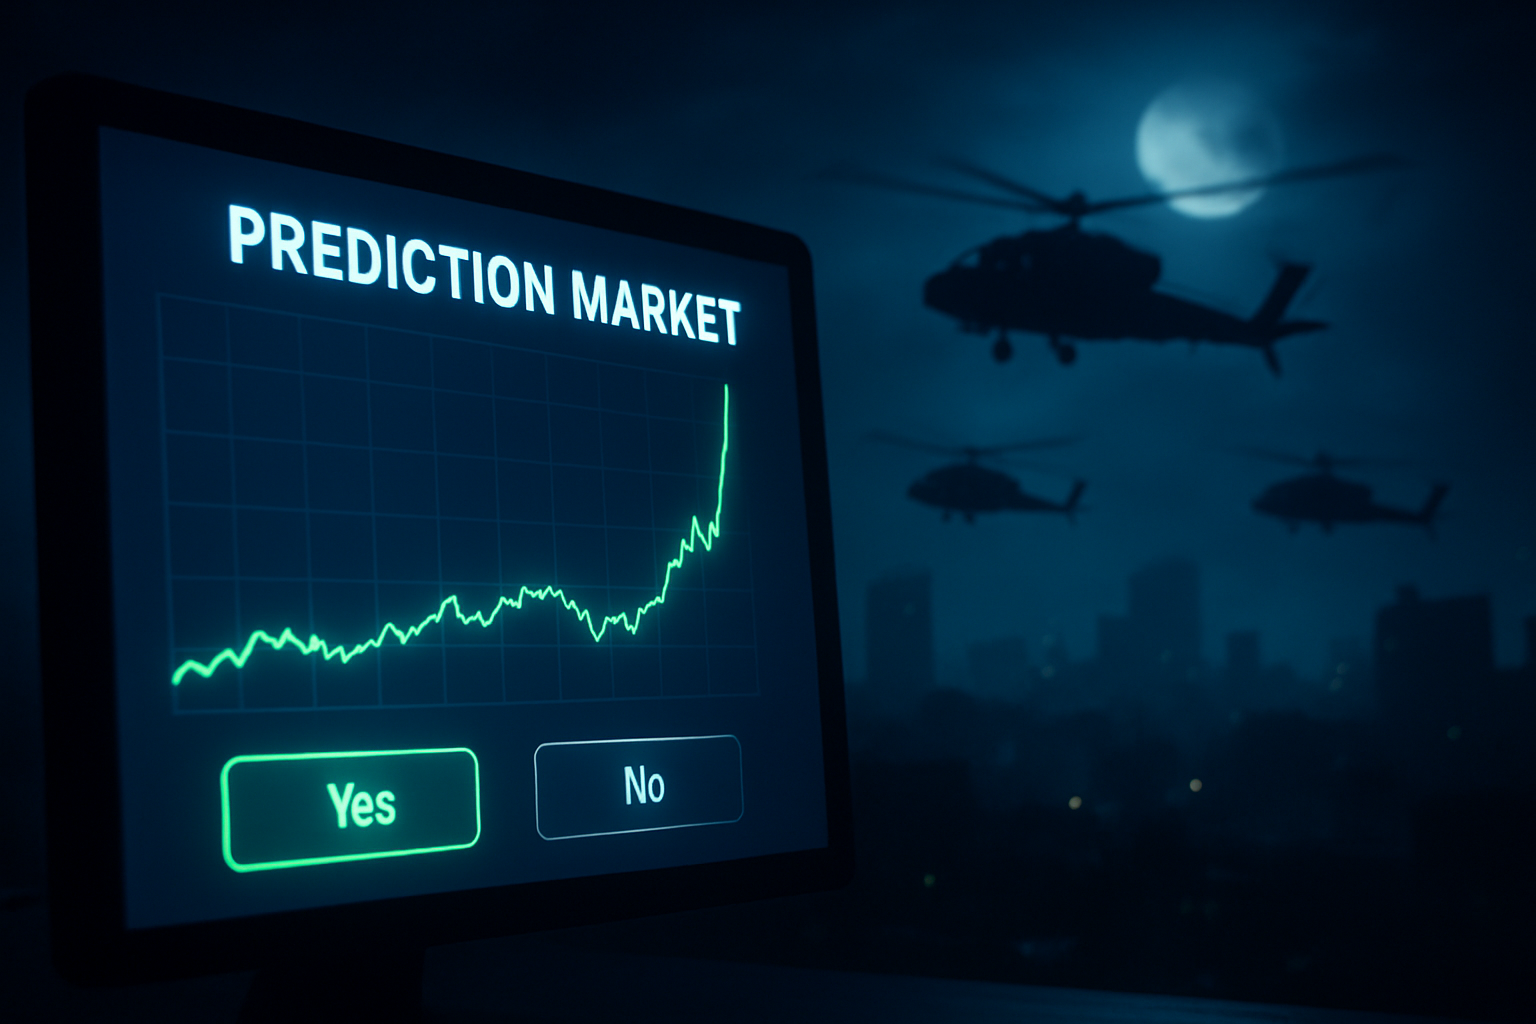
The concept of "Information Finance," or InfoFi, has transitioned from a niche crypto-economic theory into a foundational pillar of global finance and media. As of February 2, 2026, prediction markets are no longer viewed as mere platforms for speculation; they have been repositioned as sophisticated data-transmission mechanisms that assign a market price to the accuracy of information itself. This shift is most visible in the current pricing of the Federal Reserve’s next moves, where the market is currently pricing in a 64% probability of a 25-basis-point rate cut in March, a signal that traditional economists are now using to calibrate their own models.
The surge in interest surrounding InfoFi is driven by a fundamental realization: financial stakes force an honesty that social media algorithms and traditional polling lack. This "Truth Machine" philosophy, championed by industry leaders, has been validated by a massive influx of institutional capital and a landmark shift in how the world’s largest tech companies treat the sector. With total weekly trading volumes across major platforms recently hitting a record $6.32 billion, the era of purely speculative "betting" is being replaced by a disciplined quest for the "Truth Premium."
The Market: What's Being Predicted
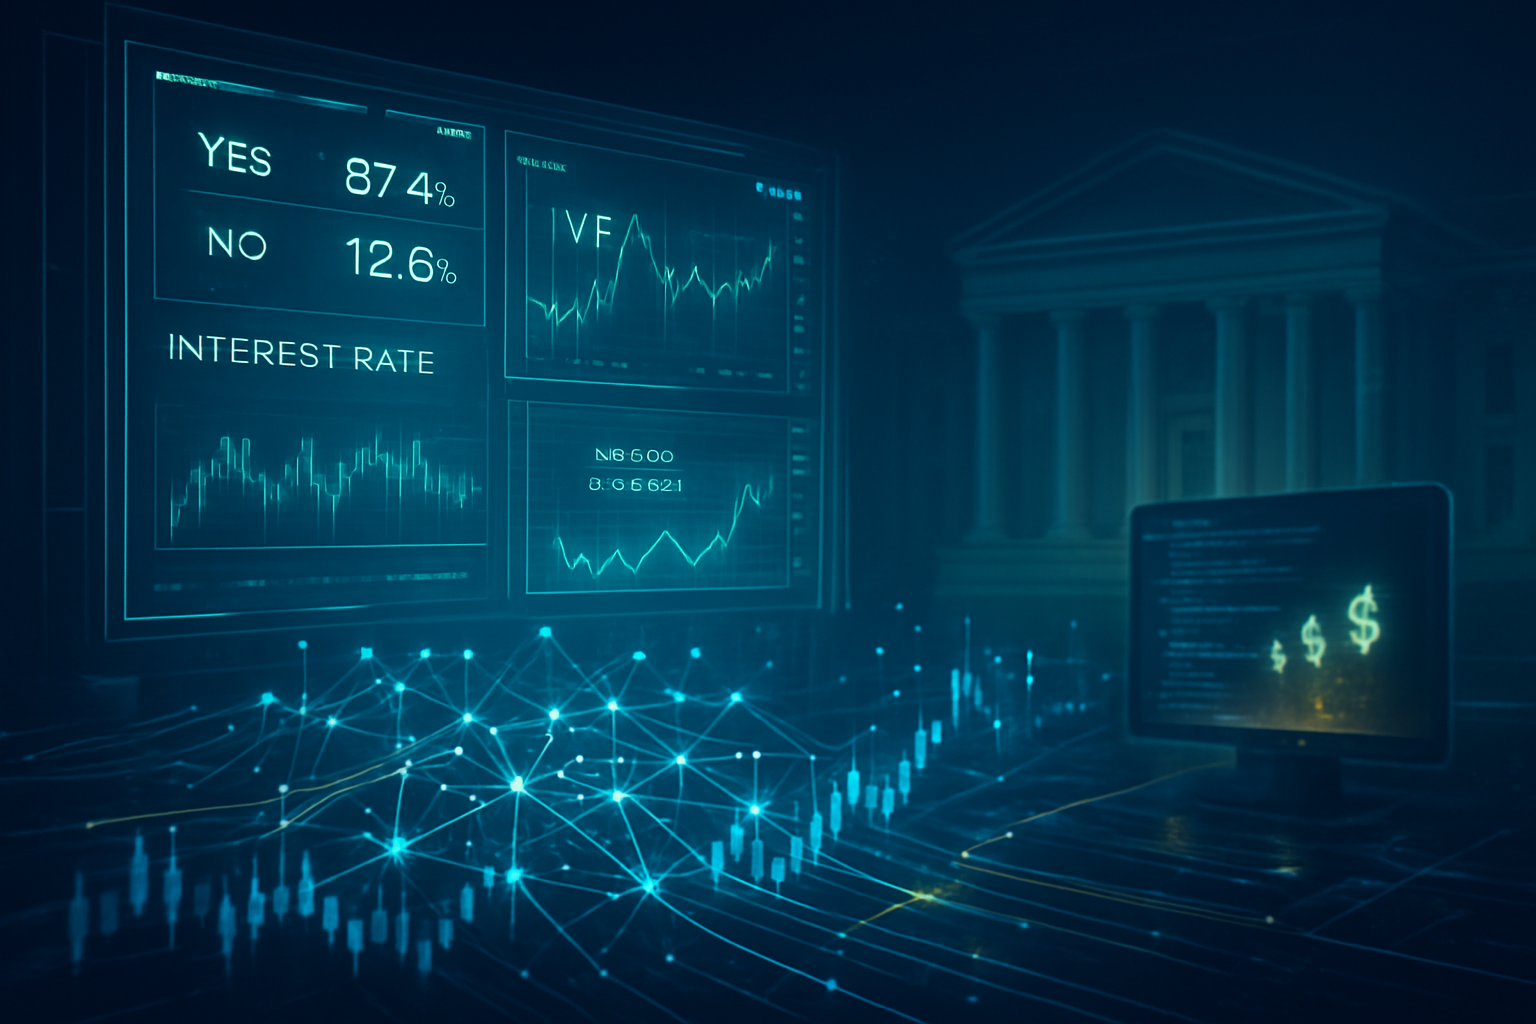
At the heart of the InfoFi movement are two dominant platforms: the federally regulated Kalshi and the globally expansive Polymarket. These exchanges have moved beyond simple "yes/no" binaries on pop culture to become the primary clearinghouses for high-stakes geopolitical and macroeconomic data. On Kalshi, the "March 2026 Fed Rate Decision" contract has seen over $450 million in open interest, effectively functioning as a real-time shadow FOMC.
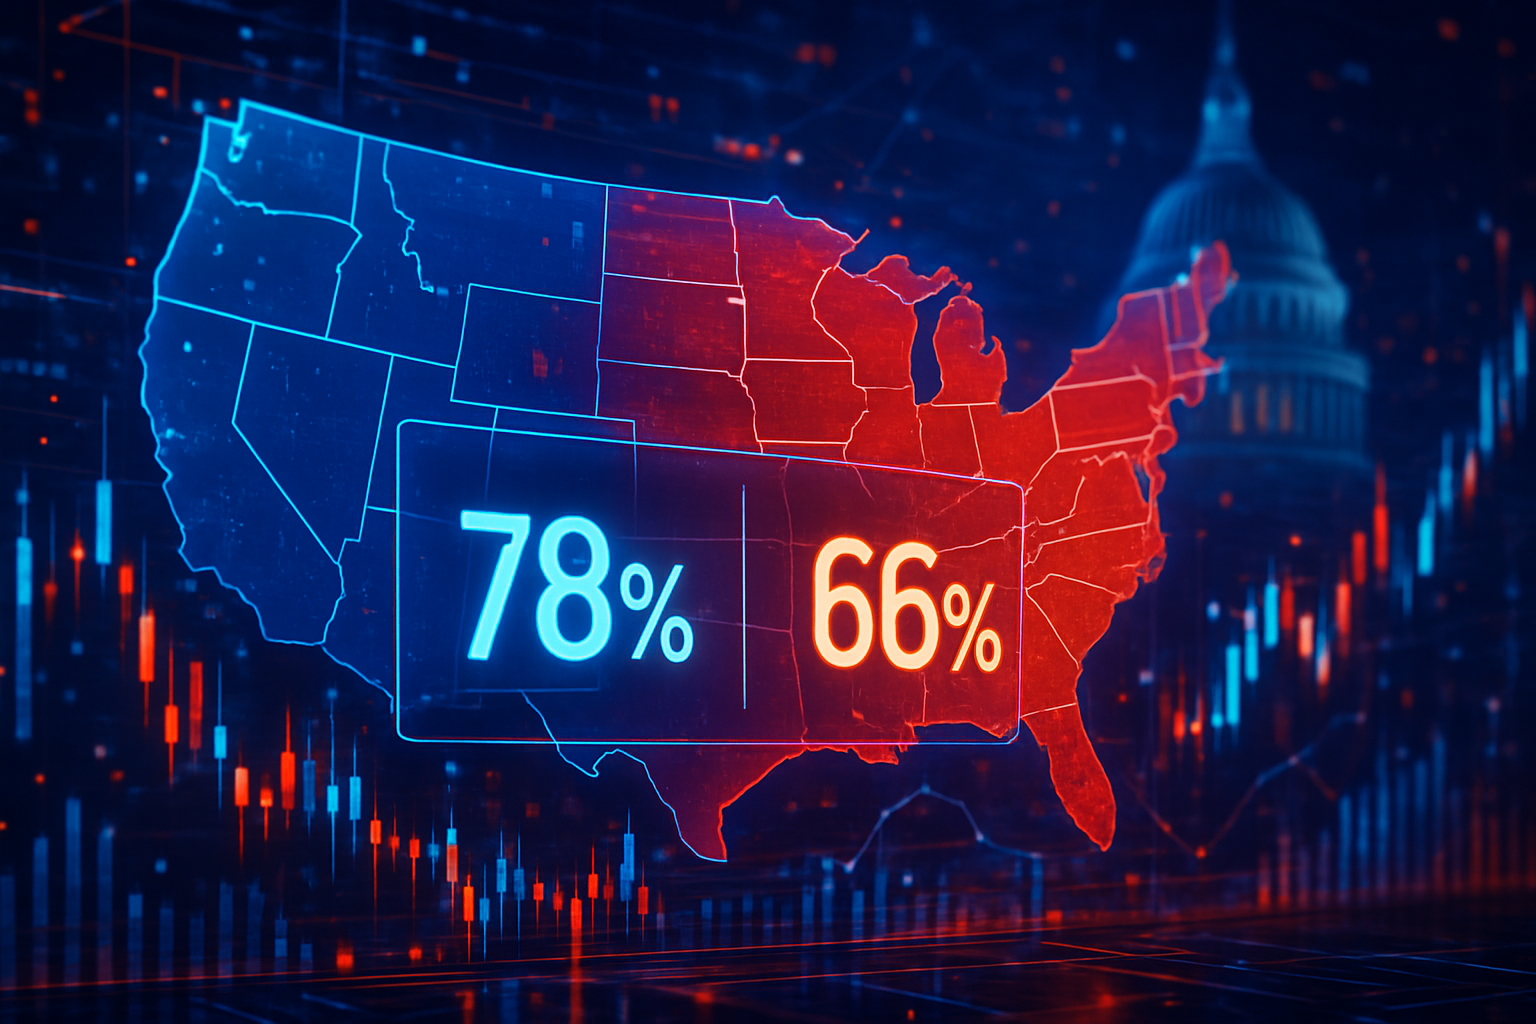
Meanwhile, on Polymarket, traders are currently fixated on the 2026 U.S. Midterm Elections. The market currently prices a 78% probability that Democrats will flip the House, while Republicans maintain a 66% chance of holding the Senate. These odds are being cited by major news networks as a more reliable indicator than traditional polls, which many argue have failed to account for the "incentivized accuracy" that comes when traders have "skin in the game."
The liquidity in these markets has reached a tipping point. On January 21, 2026, Alphabet Inc. (NASDAQ: GOOGL) updated its global advertising policies to officially permit prediction market advertisements in the United States for the first time. This regulatory "blessing" from Google has allowed platforms like Kalshi to tap into the world’s largest advertising network, provided they are federally regulated as Designated Contract Markets (DCMs). This move effectively reclassified these markets from "gambling" to "financial products," placing them in the same category as options or futures.
Why Traders Are Betting
Traders are flocking to InfoFi because it offers a "pure" play on information that is often obscured by institutional bias or media spin. Kalshi CEO Tarek Mansour has frequently described his platform as a "Truth Machine," arguing that "people don't lie with their money." This sentiment is the driving force behind the current market movements. Traders are not just betting on an outcome; they are betting that they have discovered a piece of information—whether it’s a shift in voter sentiment or a supply chain delay at NVIDIA (NASDAQ: NVDA)—before the rest of the market does.
The incentive structure is simple: if you are right, you profit; if you are wrong, you lose. This Darwinian environment has given rise to a new professional class of "Prediction Market Traders." These individuals use specialized expertise, such as tracking FDA approval timelines or analyzing semiconductor shipment data (specifically the NVIDIA Blackwell Ultra B300 shipments, which are currently a hot-button InfoFi contract), to generate alpha.
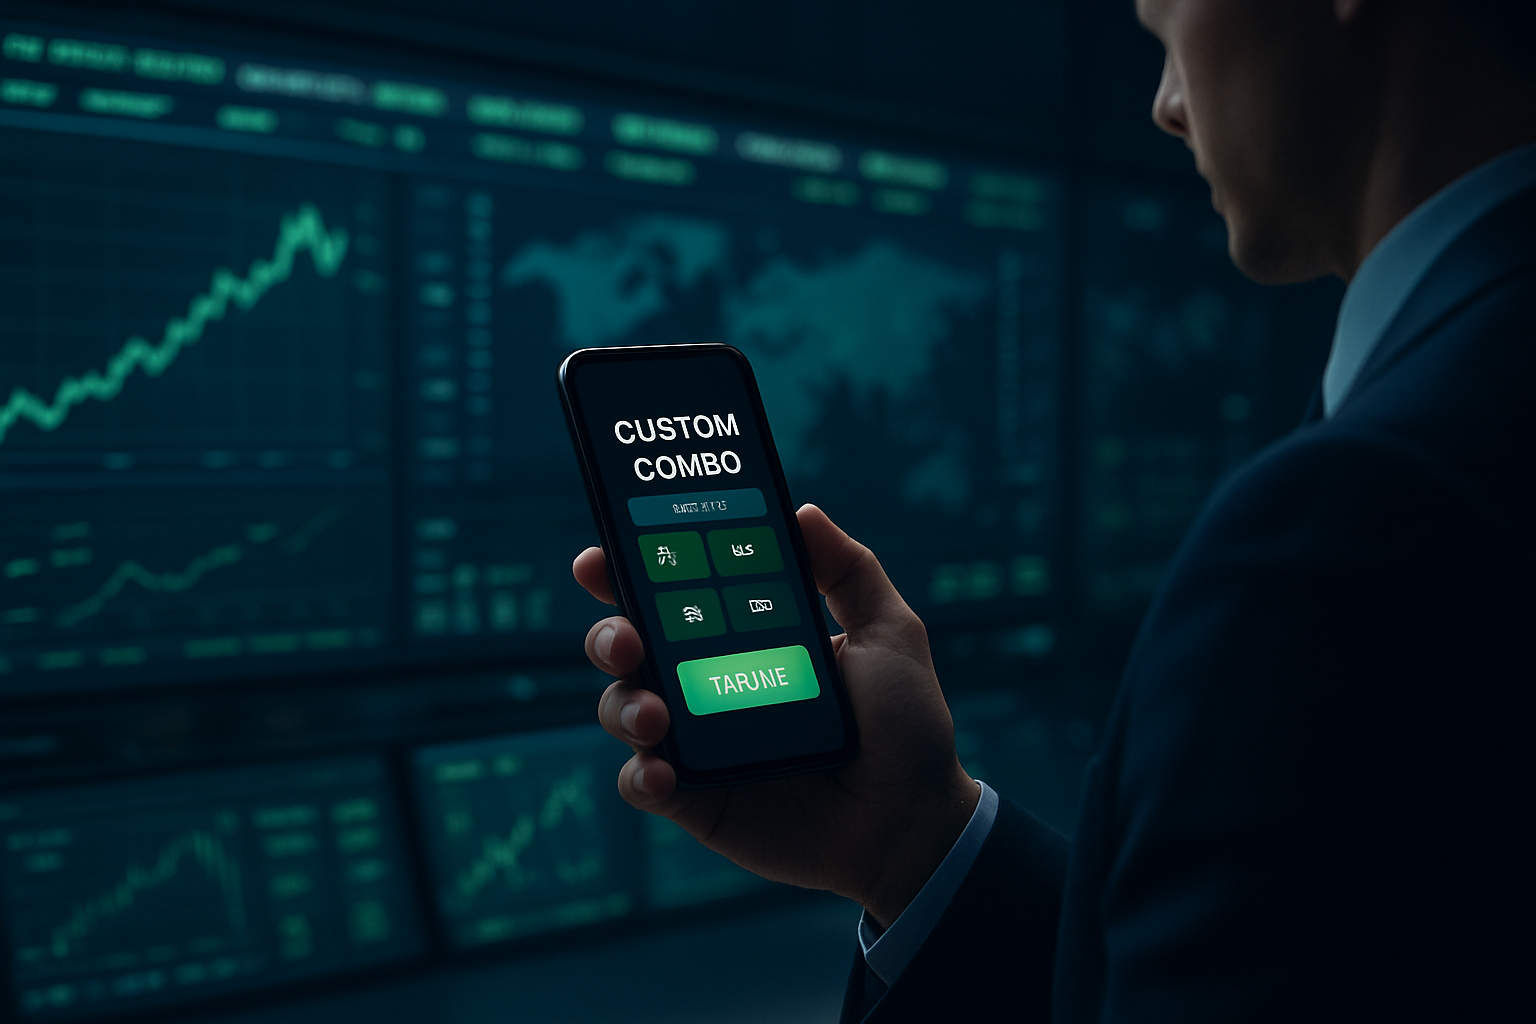
Furthermore, the integration of prediction markets into mainstream financial tools has lowered the barrier to entry. Robinhood Markets, Inc. (NASDAQ: HOOD) and Coinbase Global, Inc. (NASDAQ: COIN) have both integrated "Prediction Market Hubs" directly into their apps, reaching over 25 million combined users. This has brought a "flywheel" effect to the market: more users lead to better liquidity, which leads to sharper price signals, which in turn attracts even more institutional traders.
Broader Context and Implications
The rise of InfoFi represents a paradigm shift in how society processes truth. Historically, we have relied on "experts" and "institutions" to tell us what is likely to happen. However, the consistent accuracy of prediction markets during the 2024 elections and the subsequent AI boom has eroded trust in traditional forecasting. In late 2025, Mansour stated that Kalshi’s mission is about "replacing debate and subjectivity with markets and accuracy."
This trend is also being reflected in the legislative halls of Washington D.C. In January 2026, the Public Integrity in Financial Prediction Markets Act (H.R. 7004) was introduced to ensure the "purity of data" in these markets by banning federal officials from trading on non-public information. This suggests that the government now views these markets not as a nuisance to be regulated out of existence, but as a critical piece of national financial infrastructure that must be protected.
The broader implication is a world where "truth" is a tradable asset. When Intercontinental Exchange (NYSE: ICE), the parent company of the New York Stock Exchange, backed Polymarket with a $2 billion investment in 2025, it signaled that the old guard of finance had finally accepted InfoFi. These markets are now used to hedge against "event risk"—situations like a government shutdown or a sudden geopolitical conflict—where traditional stocks and bonds may not provide an adequate shield.
What to Watch Next
As we move through the first quarter of 2026, several key milestones will determine if InfoFi can maintain its momentum. First and foremost is the Federal Reserve’s March meeting. If the market’s 64% prediction of a rate cut proves accurate, it will further solidify the "Truth Machine" narrative. Conversely, a significant miss would give ammunition to critics who still view these markets as volatile and prone to manipulation.
Another critical area to monitor is the "AI Release Cycle." On Polymarket, the contract for "GPT-5.3 released by February 28, 2026" is currently trading at 82% odds. This market serves as a proxy for the entire tech sector's health. If OpenAI misses this window, it could trigger a broader sell-off in AI-related stocks, proving how deeply intertwined InfoFi has become with the traditional Nasdaq.
Finally, the expansion of Google’s ad program will be a major catalyst. As more regulated platforms enter the space, the cost of customer acquisition is expected to drop, potentially bringing hundreds of millions of new retail dollars into the prediction ecosystem. This liquidity surge will be the ultimate test of the platforms' stability and their ability to remain "un-manipulatable."
Bottom Line
The emergence of Information Finance (InfoFi) marks the end of the era where truth was a matter of opinion. By attaching a price tag to accuracy, prediction markets have created a global, real-time feedback loop that is increasingly difficult for traditional institutions to ignore. Tarek Mansour’s vision of a "Truth Machine" is no longer a theoretical goal; it is a multi-billion-dollar reality that is being indexed by Google and traded on Robinhood.
For the average observer, these markets provide a level of clarity that was previously impossible. Whether you are looking at the probability of a 2026 House flip or the release date of the next major AI model, the "wisdom of the crowd"—when backed by billions of dollars—is proving to be the most reliable compass in an uncertain world.
As we look toward the remainder of 2026, the question is no longer whether prediction markets are legal or moral, but rather: how much is the truth worth to you?
This article is for informational purposes only and does not constitute financial or betting advice. Prediction market participation may be subject to legal restrictions in your jurisdiction.
PredictStreet focuses on covering the latest developments in prediction markets. Visit the PredictStreet website at https://www.predictstreet.ai/.