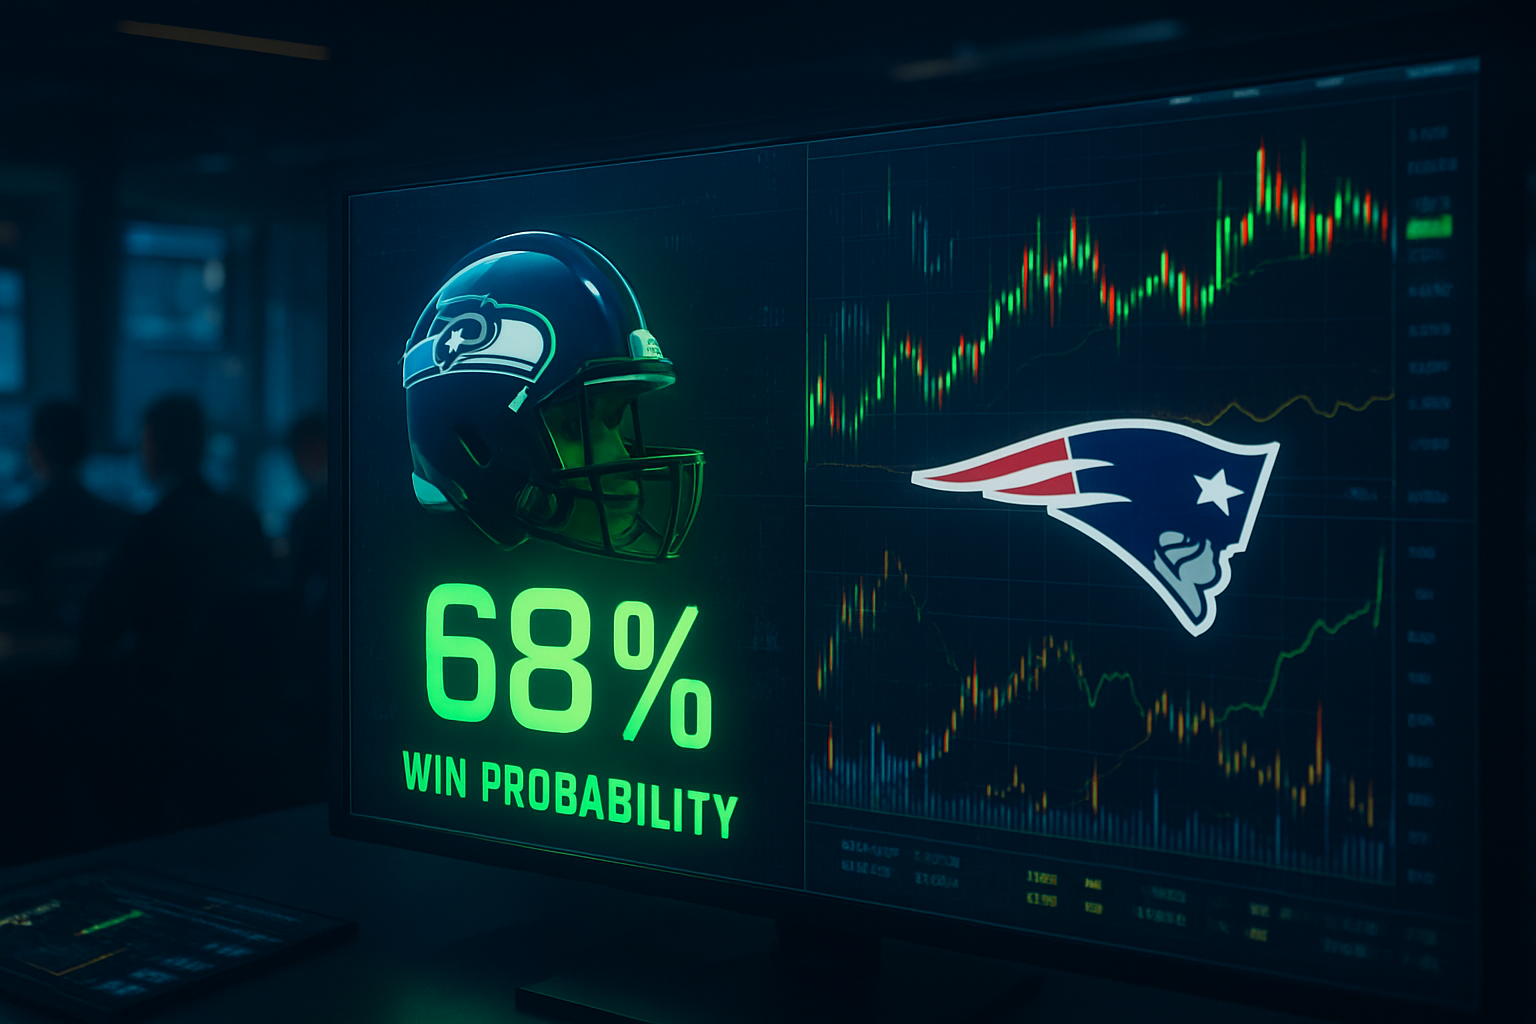
Blog

  • Starbucks Corporation (SBUX): A Comprehensive Stock Research Article on its “Back to Starbucks” Transformation

    Starbucks Corporation (SBUX): A Comprehensive Stock Research Article on its “Back to Starbucks” Transformation

    Starbucks Corporation (NASDAQ: SBUX), as of October 2, 2025, finds itself at a critical juncture, striving to reaffirm its dominance as a global coffeehouse titan while actively navigating a complex array of challenges. The company's enduring relevance stems from its expansive international footprint and a relentless pursuit of innovation. However, its market position faces intense competitive pressure, and recent financial performance has signaled a need for strategic recalibration. Investor attention is sharply focused on the efficacy of its "Back to Starbucks" initiatives, its long-term growth ambitions, and its commitment to shareholder returns amidst this period of significant internal transformation.

    Founded in 1971, Starbucks has evolved into the world's largest coffeehouse chain, boasting over 40,000 stores across 88 markets by March 2025. Its revenue streams are diversified, encompassing company-operated stores, royalties from licensed partners, and sales of packaged coffee, ready-to-drink beverages, and equipment through its Channel Development segment. The brand's identity, historically rooted in creating a "third place" experience between home and work, has been challenged by a growing consumer demand for speed and convenience, prompting a strategic pivot to balance ambiance with efficiency.

    The current investor focus on Starbucks is multifaceted. New CEO Brian Niccol, appointed in August 2024, is spearheading the "Back to Starbucks" initiative, a comprehensive strategy to enhance sales and profitability. This plan prioritizes a return to premium coffee quality, an improved customer experience through faster service and simplified pricing, and operational streamlining via a $1 billion restructuring plan. This restructuring, announced in September 2025, involves closing dozens of underperforming stores across North America and Europe and reducing approximately 900 non-retail corporate positions. While these moves are expected to incur substantial costs in the short term, they are designed to reallocate resources towards long-term growth drivers, including store remodels and intensified digital and AI integration.

    Despite recent financial headwinds—including a 2% decline in global comparable store sales in Q3 Fiscal Year 2025 and a significant contraction in operating margin—Starbucks continues to signal a commitment to shareholders. A marginal 1.6% increase in its quarterly cash dividend, announced on October 1, 2025, marks its fifteenth consecutive annual dividend hike. This signals a management team balancing aggressive restructuring with a desire to reward patient investors. The company's ambitious long-term goal of 55,000 stores globally by 2030, with a strong focus on China, underscores its belief in future expansion. However, the stock's underperformance, trading 34% below its record high with a relatively high price-to-earnings ratio, reflects investor skepticism regarding the pace and success of the turnaround. The resignation of its Chief Technology Officer in September 2025 further highlights the ongoing leadership transitions during this critical period.

    In essence, Starbucks remains a formidable global brand with significant long-term potential, but it is currently navigating a period of intense internal change and external market pressures. Its ability to execute the "Back to Starbucks" strategy effectively will be the defining factor for its future performance and investor confidence.

    2. Historical Background

    Starbucks Corporation (NASDAQ: SBUX) boasts a rich and transformative history, evolving from a modest Seattle storefront into a global coffeehouse phenomenon. Its journey is a testament to foundational principles of quality, pivotal leadership, and strategic adaptations that have redefined the coffee experience worldwide.

    Founding Story

    Starbucks was founded on March 30, 1971, in Seattle, Washington, near the historic Pike Place Market. The original visionaries were three friends from the University of San Francisco: Jerry Baldwin, Gordon Bowker, and Zev Siegl. United by a shared passion for high-quality coffee and tea, they pooled their resources to open a store that initially focused on selling fresh-roasted coffee beans, loose-leaf tea, and spices for home consumption. Their inspiration and initial supply of green coffee beans came from Alfred Peet, the founder of Peet's Coffee & Tea, under whose guidance they refined their roasting techniques. The name "Starbucks" was chosen to evoke the seafaring heritage of early coffee traders, drawing inspiration from Starbuck, the first mate in Herman Melville's classic novel "Moby-Dick."

    Early Milestones

    For its first decade, Starbucks remained dedicated to its original model of selling whole coffee beans, tea, and spices, with brewed coffee only offered as samples. By 1980, the company had expanded to four locations within Seattle. Co-founder Zev Siegl departed in 1980, with his shares being repurchased by the company.

    A pivotal moment arrived in 1982 with the opening of the first Starbucks store to sell brewed coffee. That same year, Howard Schultz joined the company as the director of retail operations and marketing. A transformative trip to Milan, Italy, in 1983 ignited Schultz's vision: he envisioned Starbucks as a "third place"—a welcoming communal space, akin to Italian coffee bars, where people could gather and enjoy espresso-based beverages. However, Baldwin and Bowker were content with the traditional retail model and resisted Schultz's push to introduce prepared drinks.

    Undeterred, Schultz left Starbucks in 1985 to found his own coffee company, Il Giornale, which quickly gained traction. In 1987, Baldwin and Bowker decided to sell Starbucks. Seizing the opportunity, Schultz, backed by investors and profits from Il Giornale, acquired Starbucks for approximately $3.8 million. He merged Il Giornale with Starbucks, fundamentally shifting the company's focus to the café concept, incorporating espresso drinks alongside its original bean sales. This strategic pivot marked the genesis of Starbucks' explosive growth, expanding from 11 stores in 1987 to over 100 within just four years under Schultz's leadership.

    Starbucks went public on June 26, 1992, with an Initial Public Offering (IPO) that raised $271 million, providing crucial capital for its aggressive expansion strategy.

    Key Transformations and Strategic Shifts

    Starbucks' enduring legacy is one of continuous evolution, from a niche coffee purveyor to a global lifestyle brand, consistently adapting its strategies while upholding a core identity built on high-quality coffee and a unique customer experience.

    • Shift to Coffeehouse Model (1987): The acquisition by Schultz fundamentally transformed Starbucks from a coffee bean retailer into a prominent coffeehouse chain, emphasizing the "third place" experience and fostering social interaction.
    • Rapid Expansion and Globalization (1990s-2000s): The 1990s witnessed exponential growth across North America, followed by international expansion. The first international store opened in Japan in 1996, followed by Europe in 1998, and China in 1999. This global rollout was underpinned by a strategy of consistent quality combined with local cultural adaptation.
    • Product Diversification: Beyond its core coffee offerings, Starbucks significantly diversified its product portfolio. This included the introduction of iconic beverages like the Frappuccino (1995), expansion into teas (e.g., Tazo teas), juices (Evolution Fresh), and a variety of food items such as pastries, sandwiches, and protein boxes.
    • Howard Schultz's Return and "Transformation Agenda" (2008): After stepping down as CEO in 2000, Schultz returned to the helm in January 2008 amid declining sales and concerns over brand dilution. His return initiated a "Transformation Agenda" focused on restoring quality and brand consistency. Key actions included:
      • Espresso Excellence Training: Famously, all U.S. company-operated stores closed for three hours in February 2008 for barista retraining, symbolizing a renewed commitment to espresso perfection.
      • Store Optimization: The company undertook a review of its global store portfolio, closing 600 underperforming U.S. stores and 61 in Australia to enhance operational efficiency.
      • Reconnecting with Core Values: Schultz re-emphasized the "third place" concept and reinforced the company's commitment to ethical sourcing and environmental responsibility.
      • New Product Introductions: This era also saw the launch of the Pike Place Roast and the development of the VIA Ready Brew instant coffee line.
      • Enhanced Employee Welfare: Schultz championed progressive employee benefits, including comprehensive healthcare and stock options for part-time workers, viewing employees as "partners."
    • Digital Innovation and Loyalty Programs: Starbucks embraced technology early, launching the Starbucks Rewards program and developing a stored value card system, which significantly boosted customer loyalty and provided upfront cash flow. The company was also a pioneer in offering free Wi-Fi in its stores.
    • Continued Leadership Transitions: Schultz again stepped down as CEO in 2017 but made a temporary return as interim CEO from 2022 to 2023, underscoring his enduring influence on the company's strategic direction.

    Starbucks' enduring legacy is one of continuous evolution, from a niche coffee purveyor to a global lifestyle brand, consistently adapting its strategies while upholding a core identity built on high-quality coffee and a unique customer experience.

    3. Business Model

    Starbucks Corporation (NASDAQ: SBUX) operates a robust and diversified business model designed to maximize reach and revenue across various consumer touchpoints. As of October 2, 2025, its strategy is characterized by multiple revenue streams, an extensive product portfolio, customer-centric services, distinct operating segments, and a well-defined target customer base.

    Revenue Sources

    Starbucks generates revenue primarily through three core channels:

    • Company-Operated Stores: The largest component of Starbucks' revenue is derived from sales at its directly owned and operated retail stores worldwide. These locations offer a consistent and premium brand experience, selling a wide array of beverages, food, and merchandise. In fiscal year 2024, company-owned stores accounted for a substantial portion of net revenue.
    • Licensed Stores: Starbucks also earns significant revenue from licensed stores. These are operated by third-party partners who pay royalties and licensing fees for the right to use the Starbucks brand and sell its products. This model enables rapid global expansion with reduced capital expenditure and operational risk for Starbucks, leveraging local partners' market expertise.
    • Channel Development (CPG, Foodservice, and Other): This segment encompasses the sale of Starbucks-branded products outside of its traditional retail stores. This includes packaged whole bean and ground coffee, single-serve products (like K-Cups), ready-to-drink (RTD) beverages, and teas sold in grocery stores, convenience stores, and through foodservice accounts. Strategic alliances, such as the Global Coffee Alliance with Nestlé, are crucial for extending the brand's reach into the at-home and on-the-go consumption markets.

    For fiscal year 2024, Starbucks reported annual revenue of $36.176 billion, with quarterly revenue reaching $9.456 billion for the period ending June 30, 2025.

    Product Lines

    Starbucks offers an extensive range of products, broadly categorized into beverages, food, and merchandise:

    • Coffee & Beverages: This is the core of Starbucks' offering, featuring a vast selection of hot and cold handcrafted beverages. The range includes various brewed coffees, a comprehensive menu of espresso-based drinks (lattes, cappuccinos, macchiatos), and the popular Frappuccino® blended beverages. The company has expanded its non-dairy milk options (soy, coconut, almond, oat milk) and, as of November 2024, eliminated the upcharge for these alternatives. In September 2025, Starbucks introduced a new line of protein-boosted lattes, catering to health-conscious consumers. Beyond coffee, the menu includes Teavana brand teas, Evolution Fresh juices, and Ethos Water. In February 2025, Starbucks strategically cut 30% of its menu, streamlining offerings to focus on more popular and less complex items.
    • Food: Starbucks provides a curated selection of food items, including pastries, breakfast sandwiches, lunch options, and snacks, with seasonal variations. Food items contributed approximately 18.66% of total revenue in fiscal year 2024.
    • Merchandise: Stores sell branded retail products such as whole bean and ground coffee, instant coffee, coffee-making equipment, mugs, tumblers, and other accessories. "Other Products" accounted for 20.85% of total revenue in fiscal year 2024.

    Services

    Starbucks enhances its customer experience through a suite of digital and in-store services:

    • Loyalty Programs (Starbucks Rewards): The Starbucks Rewards program is a cornerstone of its customer retention strategy, offering personalized promotions, free beverages, and other benefits to frequent patrons. As of Q4 Fiscal Year 2024, active U.S. Starbucks® Rewards membership stood at 33.8 million, a 4% year-over-year increase.
    • Mobile Ordering & Payment: The Starbucks mobile app allows customers to conveniently order and pay ahead, significantly reducing wait times and enhancing the grab-and-go experience. This service is particularly appealing to digitally native consumers.
    • Free Wi-Fi & "Third Place" Experience: Many Starbucks locations offer complimentary Wi-Fi, reinforcing the "third place" concept—a comfortable and inviting environment for work, study, or social interaction. In January 2025, Starbucks revised its "open-door policy," now requiring customers to make a purchase to use restrooms and seating areas.
    • Delivery Services: Through partnerships, Starbucks offers delivery options, catering to consumers who prefer to enjoy their products outside the café setting.

    Operating Segments

    Starbucks' global operations are segmented to facilitate management and reporting:

    • North America: This segment encompasses the United States and Canada. It is Starbucks' largest and most significant market, contributing substantially to overall revenue. In Q4 FY24, North America's net revenues decreased 3% compared to Q4 FY23, totaling $6.7 billion.
    • International: This segment includes all other global markets, with China being a particularly crucial growth driver. Other regions include Europe, Middle East, and Africa (EMEA), and Latin America. International segment net revenues declined 4% in Q4 FY24 to $1.9 billion.
    • Channel Development: This segment focuses on products sold through grocery stores, convenience stores, and foodservice channels, as previously described. This segment consistently demonstrates strong profit margins.

    Historically, Starbucks reported segments such as Americas, China/Asia Pacific (CAP), and Europe, Middle East, and Africa (EMEA). However, recent financial reports reflect the consolidated North America, International, and Channel Development structure.

    Primary Customer Base

    Starbucks targets a broad yet distinct customer demographic:

    • Demographics: The core customer base typically falls within the 25 to 40 age range, although its appeal extends to younger adults (Gen Z, 18-24) and older demographics (up to 60). These customers are often educated, with middle-to-high disposable incomes.
    • Geographics: Starbucks strategically positions its stores in high-traffic urban and suburban areas, catering to professionals, students, and families on the go.
    • Psychographics: Starbucks appeals to tech-savvy individuals who value convenience, product quality, and a premium experience. These customers often appreciate the "third place" ambiance, the brand's perceived commitment to social responsibility, and community engagement. They are also increasingly health-conscious, seeking diverse beverage choices and healthier food options. The company's digital strategies, including its mobile app and loyalty program, are instrumental in attracting and retaining these digitally native generations.

    In summary, Starbucks' business model is a dynamic blend of retail presence, strategic partnerships, and digital innovation, all centered on delivering a premium coffee experience and adapting to evolving consumer demands across diverse global markets.

    4. Stock Performance Overview

    Starbucks Corporation (NASDAQ: SBUX) has exhibited a mixed stock performance across various time horizons leading up to October 2, 2025, marked by periods of significant growth, notable declines, and ongoing strategic adjustments.

    1-Year Stock Performance (October 2, 2024 – October 2, 2025)

    Over the past year, Starbucks' stock has navigated a challenging environment. As of October 1, 2025, the stock closed at $84.40. The 52-week high for SBUX was $117.46, recorded on March 3, 2025, while its 52-week low reached $75.50 on April 30, 2025.

    The total return for SBUX over the trailing twelve months (TTM) ending September 30, 2025, was -11.01%. Year-to-date (YTD) performance for 2025 showed a decline of -5.51% as of September 30, 2025.

    Notable Price Movements and Events:

    • October 22, 2024: Shares dropped after Starbucks withdrew its fiscal year 2025 outlook and reported preliminary Q4 2024 results that missed analyst expectations, signaling a challenging transition under new CEO Brian Niccol.
    • January 29, 2025: The stock saw a bounce as Q1 fiscal 2025 results indicated a smaller-than-expected decline in comparable sales, offering a glimmer of hope for Niccol's "Back to Starbucks" turnaround plan.
    • April 29, 2025: Q2 fiscal 2025 earnings disappointed, with EPS missing forecasts and global comparable store sales declining by 1%. The stock reacted sharply, falling 9.6% on April 30, 2025.
    • July 29, 2025: Q3 fiscal 2025 results showed a 2% decline in global comparable store sales and a drop in adjusted earnings. However, CEO Niccol's assertion that the turnaround plan was "ahead of schedule" led to an after-hours stock climb.
    • September 25, 2025: Starbucks announced a significant restructuring, including closing hundreds of underperforming stores and cutting approximately 900 corporate jobs, with a projected $1 billion cost. The stock remained relatively flat on this news.
    • October 1, 2025: The declaration of its 15th consecutive annual dividend increase (from $0.61 to $0.62 per share) reportedly caused a 3% jump in the stock on October 2, 2025, demonstrating a commitment to shareholder returns despite recent performance.

    Throughout this period, analyst sentiment has been mixed, with some downgrades in late 2024 and others maintaining "Moderate Buy" ratings with average target prices around $104.00 in October 2025.

    5-Year Stock Performance (October 2, 2020 – October 2, 2025)

    Over the five-year period ending September 30, 2025, Starbucks generated a total return of 9.92%, meaning an initial investment of $1,000 (with reinvested dividends) would be worth approximately $1,099.22. The compound annual growth rate (CAGR) for this period was 2.60%.

    Key Trends and Events:

    • 2020-2021 Growth: The stock experienced strong annual performance, with a 24.19% return in 2020 and 11.15% in 2021. SBUX reached its all-time high closing price of $114.39 on July 26, 2021 (some sources indicate $126.32 on July 22, 2021). This period reflected a robust recovery from the initial impacts of the pandemic and strong consumer demand.
    • 2022-2025 Decline: Following its peak, the stock entered a period of decline, with annual returns of -13.18% in 2022, -1.19% in 2023, and -2.48% in 2024. This downturn was attributed to macroeconomic headwinds, shifts in consumer behavior, and increasing competition, ultimately leading to the implementation of the "Back to Starbucks" turnaround strategy in late 2024.

    10-Year Stock Performance (October 2, 2015 – October 2, 2025)

    Over the past decade, Starbucks (SBUX) demonstrated an overall positive, though fluctuating, performance. On October 2, 2015, the stock closed at $58.08, and by October 1, 2025, it had reached $84.40.

    The total return for SBUX over the 10-year period ending September 30, 2025, was 82.49%. The compound annual growth rate (CAGR) for this decade was 5.97%.

    Key Trends and Events:

    • April 9, 2015: Starbucks executed a 2-for-1 stock split, adjusting historical prices for direct comparison.
    • Mid-to-Late 2010s Growth: The company experienced significant annual returns, including 47.67% in 2015 and 39.09% in 2019, generally showcasing consistent expansion and market dominance.
    • All-time Highs (2021): The stock's peak performance occurred in 2021, reaching its all-time high, reflecting strong growth during the initial years of the COVID-19 pandemic and subsequent recovery.
    • Recent Challenges (2022-2025): The latter part of this decade was marked by declines, as SBUX grappled with decreased customer traffic, intense competition, and broader economic uncertainties, leading to a strategic overhaul and aggressive restructuring initiatives under new leadership.

    In summary, while Starbucks delivered solid long-term returns over the past decade, its more recent performance has been challenged, reflecting the need for its current strategic transformation to reignite growth and restore investor confidence.

    5. Financial Performance

    Starbucks Corporation (NASDAQ: SBUX) has reported mixed financial results in its recent fiscal periods leading up to October 2, 2025, indicating that its strategic investments and turnaround efforts are underway amidst a challenging operating environment.

    Latest Reported Earnings (Q3 Fiscal Year 2025)

    For the fiscal third quarter ended June 29, 2025, Starbucks reported earnings per share (EPS) of $0.50, falling short of analyst expectations of $0.65. This represented a significant 45% decrease from the prior year's comparable quarter. The decline in EPS was primarily attributed to expense deleverage and substantial investments associated with the "Back to Starbucks" strategy, including higher labor costs and the Leadership Experience 2025 initiative, along with a discrete tax item. Net income for the quarter stood at $558.3 million, a considerable drop from $1.05 billion in Q3 FY24.

    Revenue Growth

    Consolidated net revenues for Q3 FY25 reached $9.5 billion, surpassing analyst forecasts of $9.29 billion. This marked a 4% increase year-over-year, or 3% on a constant currency basis. Despite the overall revenue increase, global comparable store sales declined by 2%, driven by a 2% decrease in comparable transactions, partially offset by a 1% increase in the average ticket.

    Geographically, the North America segment saw a 2% increase in net revenues to $6.9 billion, primarily due to net new company-operated store growth, although comparable sales in the U.S. declined by 2%. Conversely, the International segment's net revenues grew by 9% to $2.0 billion, benefiting from net new company-operated store growth, a favorable foreign currency impact, and increased licensed store business revenue. Notably, China's comparable sales turned positive during the quarter. The Channel Development segment also experienced a robust 10% increase in net revenues, reaching $483.8 million. For the trailing twelve months (TTM) ending June 30, 2025, Starbucks' revenue was $36.689 billion, representing a 0.59% increase year-over-year.

    Profit Margins

    Starbucks' GAAP operating margin contracted significantly by 680 basis points year-over-year to 9.9% (or 10.1% as reported by some sources). This contraction from 16.6% in the prior year was primarily driven by deleverage, investments in the "Back to Starbucks" plan (including higher labor costs), and inflationary pressures. The net profit margin for Q3 FY25 was 7.17%, indicating a notable decrease from the previous year. The latest twelve months' gross profit margin was reported at 23.7%.

    Debt Levels

    As of June 2025, Starbucks reported total debt on its balance sheet of approximately $27.88 billion USD. Another source indicated total debt for the last quarter (June 2025) at $27.907 billion. The net long-term debt for the quarter ending June 30, 2025, showed a substantial increase of 927.32% year-over-year, reaching $1.749 billion. For the trailing twelve months ending June 30, 2025, net long-term debt was $1.919 billion, marking a 2075.4% increase from the prior year.

    Cash Flow

    While specific free cash flow for the latest reported quarter was not explicitly detailed, Starbucks' annual free cash flow for fiscal year 2024 was $3.318 billion, a 12.34% decline from 2023. The company's cash flow statement indicates that net cash used in financing activities has been negative in most years, driven by significant repurchases of common stock and increasing dividend payments. Net cash used in investing activities showed an increasing outflow trend, from -$1,010,800 thousand USD in 2019 to -$2,699,200 thousand USD in 2024, reflecting aggressive investments in fixed assets.

    Key Valuation Metrics

    As of its most recent financial reports prior to October 2, 2025:

    • Price-to-Earnings (P/E) Ratio: Starbucks' trailing twelve months (TTM) P/E ratio was approximately 36.4 as of October 2025 (or as of September 29, 2025).
    • Enterprise Value to EBITDA (EV/EBITDA): The latest twelve months' EV/EBITDA for Starbucks was around 20.5x (as of September 26, 2025).

    In summary, Starbucks' recent financial performance reflects a company in transition. While revenue growth remains modest, profitability and margins have been under pressure due to strategic investments and a challenging sales environment. The company's increased debt levels and continued investment in fixed assets underscore its commitment to long-term growth initiatives, even as it navigates short-term headwinds.

    6. Leadership and Management

    Starbucks Corporation (NASDAQ: SBUX) is currently undergoing significant leadership transitions and strategic realignments as of October 2, 2025. These changes are primarily driven by the "Back to Starbucks" strategy, a comprehensive plan aimed at revitalizing the company's core business, enhancing the customer experience, and improving operational efficiency.

    Current CEO and Key Leadership Team

    As of September 9, 2024, Brian Niccol serves as the Chairman and Chief Executive Officer of Starbucks Corporation. Niccol, who previously held the CEO position at Chipotle Mexican Grill, was appointed to address declining sales and redefine the Starbucks brand. He succeeded Laxman Narasimhan, who stepped down on August 13, 2024.

    Key members of Starbucks' executive leadership team include:

    • Rachel Ruggeri: Executive Vice President and Chief Financial Officer. She also served as interim CEO before Niccol's arrival.
    • Mike Grams: Executive Vice President and Chief Operating Officer, promoted in June 2025 as part of a leadership reshuffle.
    • Sara Kelly: Executive Vice President and Chief Partner Officer.
    • Brad Lerman: Executive Vice President and Chief Legal Officer.
    • Brady Brewer: CEO, Starbucks International, overseeing teams across Asia Pacific, EMEA, Japan, and Latin America, as well as international licensed partners.
    • Michael Conway: CEO, North America, a newly created role as of March 2024. Sara Trilling continues as Executive Vice President and President of North America, reporting to Conway.
    • Cathy Smith: Executive Vice President and Chief Financial Officer (Note: While Rachel Ruggeri is also listed as CFO, Cathy Smith joined in March 2025, suggesting a recent transition or dual roles/regions, with Smith likely the current CFO).
    • AJ Jones II: Executive Vice President and Chief Communications Officer, Public Affairs.
    • Dominic Carr: Executive Vice President, Chief Communications and Corporate Affairs Officer.
    • Tressie Lieberman: Executive Vice President, Global Chief Brand Officer.
    • Molly Liu: Co-CEO, Starbucks China, alongside Belinda Wong who is Chairwoman and Co-CEO.
    • Meredith Sandland: Executive Vice President, Chief Development Officer.
    • Sanjay Shah: Executive Vice President, Chief Supply Chain Officer.
    • Michelle Burns: Executive Vice President, Global Coffee & Sustainability.
    • Deborah Hall Lefevre: Executive Vice President and Chief Technology Officer (though recent reports indicate the technology department operations are merging into the finance department, with Lefevre reporting to the CFO).

    Board of Directors

    As of June 25, 2025, Starbucks' Board of Directors includes:

    • Brian Niccol: Chairman and Chief Executive Officer.
    • Jørgen Vig Knudstorp: Lead Independent Director, effective March 13, 2025.
    • Ritch Allison: Independent Director, former CEO of Domino's Pizza, Inc.
    • Andrew Campion: Independent Director, Chairman and CEO of Unrivaled Sports, former COO of Nike, Inc.
    • Beth Ford: Independent Director, CEO of Land O'Lakes, Inc.
    • Marissa Mayer: Director, elected effective June 25, 2025; CEO and Founder of Sunshine AI, former CEO of Yahoo! Inc.
    • Neal Mohan: Independent Director, CEO of YouTube.
    • Dambisa Moyo: Director, elected effective June 25, 2025; Co-principal of Versaca Investments, a global economist.
    • Daniel Servitje: Independent Director, Executive Chair of Grupo Bimbo SAB de CV.
    • Mike Sievert: Independent Director, CEO of T-Mobile US, Inc.
    • Wei Zhang: Independent Director, from Alibaba Pictures Group.
    • Howard Schultz: Founder and Chairman Emeritus.

    Strategic Vision

    Brian Niccol's strategic vision, branded "Back to Starbucks," aims to revitalize the company by returning to its roots as a welcoming coffeehouse and significantly enhancing the customer experience. This strategy, initiated in late 2024 and projected to unfold through 2025 and into 2026, encompasses several key pillars:

    • Prioritizing Speed and Service: A core focus on reducing wait times, optimizing staffing, and streamlining the menu.
    • Enhancing the Coffee House Experience: Re-establishing a comfortable and inviting café atmosphere, including the return of ceramic mugs, condiment bars, and free refills for brewed coffee and tea, aiming to restore the "third place" appeal.
    • Refocusing on Quality Coffee: Emphasizing the premium quality of its coffee and the craftsmanship behind its beverages.
    • Strategic Restructuring and Cost Reduction: A significant $1 billion restructuring plan, approved in September 2025, involves closing underperforming locations (approximately 400 stores in North America, leading to about a 1% decline in overall North American store count in fiscal year 2025) and cutting 900 corporate jobs to reduce costs and redirect resources.
    • Innovation for Growth: Niccol anticipates "a wave of innovation that fuels growth, elevates customer service, and ensures everyone experiences the very best of Starbucks" in 2026.
    • Digital Integration and Loyalty: Leveraging predictable seasonal launches, a high-utility mobile app, and eye-catching merchandise to drive customer engagement and loyalty.
    • Global Expansion (China Focus): Starbucks China has a strategic vision to reach 9,000 stores in China by 2025, adding 35,000 new employees, and doubling net income and quadrupling operating profit in the region.
    • Employee Engagement: A focus on strengthening "partner" engagement and revitalizing partner culture, though some initiatives like stricter in-office requirements have drawn criticism.

    Corporate Governance Practices

    Starbucks' Board of Directors adheres to established governance principles, committee charters, and policies. The board typically comprises a substantial majority of independent directors who meet NASDAQ and SEC requirements. Key aspects of their governance include:

    • Combined Chair/CEO Role: Brian Niccol holds both the Chairman and CEO positions.
    • Lead Independent Director: Jørgen Vig Knudstorp serves as the lead independent director, acting as a crucial liaison between the board and shareholders.
    • Annual Elections: The chair and lead independent director are elected or appointed annually.
    • Environmental, Partner and Community Impact (EPCI) Committee: Established in November 2023, this committee oversees compliance with environmental, employee welfare, and community engagement standards.
    • Shareholder Engagement: The company actively engages with shareholders through its annual meeting and investor relations.

    Overall Management Reputation

    As of October 2025, Starbucks' management reputation is under considerable scrutiny. Brian Niccol's "Back to Starbucks" plan is viewed as an aggressive, yet necessary, restructuring effort. However, its effectiveness is still being evaluated by investors and analysts.

    • Declining Sales and Customer Frequency: The company has experienced six consecutive quarters of declining same-store sales and a decrease in average monthly customer visit frequency, indicating a struggle to regain customer loyalty.
    • Investor Sentiment: Initial optimism surrounding Niccol's appointment has waned due to the lack of immediate reversal in demand, with some analysts viewing 2025 as a "throwaway year" for restructuring.
    • Employee Relations: Management has faced criticism regarding perceived lack of empathy towards employees, particularly concerning stricter return-to-office policies, detailed scripting of barista interactions ("Green Apron Service"), and the handling of job cuts.
    • Brand Reputation Decline: Reports indicate a significant drop in Starbucks' overall brand reputation, falling from "strong" to "vulnerable" on various indices, primarily due to struggles with its "value proposition."
    • Unionization Efforts: Ongoing unionization efforts by workers in many U.S. stores continue to be a point of contention, impacting labor relations and potentially increasing operational costs.

    In conclusion, Starbucks' leadership, under CEO Brian Niccol, is actively pursuing a significant strategic overhaul to address current challenges. While these initiatives aim to enhance long-term efficiency and competitiveness, the company is currently navigating a period of declining sales, investor skepticism, and a stressed management and employee reputation. The success of the "Back to Starbucks" plan will be crucial in restoring confidence and driving future growth.

    7. Products, Services, and Innovations

    Starbucks Corporation (NASDAQ: SBUX) maintains its prominent position in the global coffee market through a dynamic interplay of diverse product and service offerings, continuous innovation, dedicated research and development, a robust patent portfolio, and a strong focus on enhancing the customer experience as of October 2, 2025.

    Current Product and Service Offerings

    Starbucks' current offerings extend significantly beyond its foundational coffee beverages to encompass a wide array of food items, retail merchandise, and an advanced digital ecosystem.

    Beverages:
    Starbucks offers a comprehensive range of hot and cold handcrafted beverages, including its signature espresso-based drinks, brewed coffees, and various teas. Recent beverage innovations in 2024-2025 highlight a focus on seasonal and health-conscious options. These include the Iced Horchata Oatmilk Shaken Espresso (Summer 2025) and the Strato™ Frappuccino (July 2025), which reimagines a classic with layered flavors like Brown Sugar and Strawberry Matcha. The Spring 2025 menu saw the introduction of floral and spiced drinks such as the Iced Lavender Cream Oat Milk Matcha, Iced Lavender Oat Milk Latte, and Iced Cherry Chai. Furthermore, addressing growing consumer demand for functional beverages, Starbucks launched Protein Lattes and Protein Cold Foam drinks in September 2025, offering 15 to 36 grams of protein per serving and options to customize any drink with protein milk or cold foam. A new Starbucks 1971 Roast, a bold, all-day dark roast, is also slated for winter 2025 in the US and Canada. Starbucks recently ended the upcharge for non-dairy milk additions in November 2024.

    Food:
    The food menu complements the beverage offerings with items like the Strawberries and Cream Cake Pop (Summer 2025) and the Jalapeño Chicken Pocket (Spring 2025). The UK market also saw new lunch options in Summer 2025, including a Mexican Style Three Bean Wrap, a Meat Free Sausage Sandwich, and a Chicken Salad Sandwich. In a strategic move to streamline operations and address declining sales, Starbucks announced plans to cut approximately 30% of its overall menu offerings by the end of 2025, focusing on "fewer, better options" while continuing to innovate based on consumer preferences.

    Retail and Packaged Goods:
    Beyond in-store consumption, Starbucks extends its presence through its "Starbucks at Home" product line, a partnership with Nestlé that generated $2.1 billion in revenue in 2024. The company also sells branded merchandise, including reusable cups, which saw a surge in search interest in late 2024, likely linked to sustainability campaigns.

    Service Models:
    Starbucks offers various service models, including traditional in-store ordering, drive-thru, and robust mobile ordering and pay via its app. There is also an emphasis on delivery services, with partnerships like Grubhub offering promotions. The company is expanding its retail footprint with "pick-up" focused stores. Notably, Starbucks has reintroduced in-store amenities such as ceramic mugs for dine-in, condiment bars, and free refills for brewed coffee and tea for customers dining in, aiming to restore the traditional coffeehouse atmosphere.

    Recent Innovations

    Starbucks' recent innovations span product development, operational efficiency, and digital engagement, all geared towards enhancing the customer experience and strengthening its market position.

    Product Innovations:
    As detailed in the product offerings, new beverages like the Strato™ Frappuccino, Iced Horchata Oatmilk Shaken Espresso, Protein Lattes, and a variety of seasonal drinks demonstrate Starbucks' continuous efforts to refresh its menu and cater to evolving tastes. The company's "Triple Shot Reinvention" strategy, leveraging generative AI for product development, has significantly cut the average concept-to-launch time from 18 to 6 months, enabling the introduction of three incremental seasonal drinks in fiscal 2024 alone.

    Operational and Service Innovations:
    Starbucks is investing heavily in operational improvements. By the end of 2025, all U.S. stores are slated to have Clover Vertica drip-coffee brewers, which can brew high-quality coffee in just 30 seconds, reducing waste. The Siren System and Siren Craft System represent an accelerated kitchen redesign and process overhaul aimed at improving drink building and service speed, with a stated goal of a four-minute drink delivery time. The Green Apron Service Model is being scaled to foster human connection and accelerate order delivery. Additionally, Starbucks has eliminated surcharges for non-dairy milk options, enhancing customer value and simplifying pricing.

    Digital and Technology Innovations:
    Starbucks continues to lead with its digital platform. Integration with Shopify is set to streamline online sales, and mobile app optimization efforts have shown success, with push notifications for "Happy Hour" discounts increasing mobile orders by 28%. The company heavily leverages AI-powered personalization and recommendations within its app, which has resulted in higher customer loyalty and increased mobile app adoption and usage. On the operational side, Starbucks is piloting Green Dot Assist, a generative AI-powered assistant for baristas providing real-time guidance and troubleshooting, and rolling out Next Gen POS, a redesigned point-of-sale system to improve workflow and reduce training time.

    Sustainability Innovations:
    A significant innovation is the development of a new sustainability learning and innovation lab at Hacienda Alsacia in Costa Rica, Starbucks' global agronomy headquarters. Expected to physically open within the next three years (potentially by 2026), this lab will serve as a hub for R&D on sustainable solutions, including creating new coffee varieties, testing disease-resistant coffee trees, and sharing agricultural practices to ensure the future of coffee.

    Research and Development Efforts

    Starbucks maintains a robust R&D infrastructure to drive its innovation pipeline.

    • Tryer Center: Located at Starbucks headquarters in Seattle, the Tryer Center serves as a primary innovation incubator. It brings together designers, scientists, engineers, and baristas to identify problems and develop solutions. Notable innovations to emerge from here include the Clover Vertica brewing system and the portable cold foam blender.
    • Hacienda Alsacia: This company-owned coffee farm in Costa Rica is dedicated exclusively to R&D, focusing on coffee sustainability. Its work includes developing new coffee varieties and disease-resistant trees. The upcoming sustainability learning and innovation lab will expand these capabilities, fostering collaboration to address global environmental and social challenges.
    • Collaborative Coffee Innovation Network: Starbucks expanded this network in October 2024, adding two new coffee farms in Guatemala and Costa Rica, further cementing its commitment to quality coffee sourcing and development.
    • AI in R&D: The integration of generative AI into product development processes, as part of the Triple Shot Reinvention strategy, allows for early simulation of flavor and supply constraints, reducing R&D ingredient waste by 28%.
    • In-Store Product Testing: Starbucks conducts in-store product testing at designated "secret" locations to organically measure the appeal of new product concepts before a broader launch, allowing for real-time feedback and design adjustments.

    Patents

    Starbucks possesses a substantial and diverse patent portfolio, reflecting its commitment to protecting its innovations. As of September 2025, Starbucks holds approximately 1,519 patents/applications globally, with 567 issued patents and over 58.39% being active or pending. Another report from early 2025 indicates 1,455 patents globally, with 930 active. The majority of these patents are filed in the United States, followed by China and Hong Kong.

    These patents cover a broad spectrum, from beverage preparation apparatus (e.g., coffee grinding technology) to the beverages themselves, as well as advancements in cups and lids. The company's focus on innovation is evident in a substantial increase in patent filings over the past six years. Recent patent grants in 2024 include US Patent 11925297 (March 2024) and 12127713 (October 2024). This intellectual property protection prevents competitors from directly replicating Starbucks' unique designs and solutions.

    Contribution to Competitive Edge

    Starbucks leverages its product and service offerings, innovations, R&D, and patents to maintain a significant competitive edge in the global market.

    1. Product Differentiation and Innovation: Starbucks consistently introduces new and customized products, particularly its cold beverages, which account for approximately 75% of its total beverage sales in U.S. company-operated stores and resonate strongly with Gen Z customers. This ability to deliver handcrafted, customized drinks differentiates Starbucks from competitors and fuels sales. The rapid product development enabled by AI ensures the menu remains fresh and aligned with evolving consumer preferences.
    2. Superior Customer Experience and "Third Place" Concept: Starbucks has cultivated a strong brand image associated with quality and a welcoming "third place" environment between home and work. The return of ceramic mugs, condiment bars, and focused "Green Apron Service" enhances this experiential aspect, fostering customer loyalty and deeper connection.
    3. Digital Leadership and Loyalty Program: The industry-leading Starbucks mobile app and Rewards program provide unparalleled convenience, personalization through AI, and gamified incentives. This digital ecosystem drives significant mobile order-ahead transactions and strengthens customer retention, making it a powerful competitive advantage that is difficult for rivals to replicate.
    4. Operational Efficiency and Speed of Service: Investments in new equipment like Clover Vertica, kitchen redesigns, and a focus on reducing drink delivery times (e.g., four-minute goal) address operational challenges and improve customer satisfaction, especially in busy periods. Technology like Green Dot Assist and Next Gen POS further empowers baristas and streamlines operations.
    5. Sustainability and Ethical Sourcing: Starbucks' commitment to 99% ethically sourced coffee, long-term farmer partnerships, and open-source agronomy practices resonates with socially conscious consumers. The R&D efforts at Hacienda Alsacia reinforce this commitment, strengthening the brand's reputation and appeal. This focus aligns with consumer values and contributes to a sustainable competitive advantage.
    6. Intellectual Property Protection: A large and active patent portfolio protects Starbucks' unique product formulations, brewing technologies, and operational processes, preventing competitors from infringing on its innovations and ensuring its distinct market offerings remain exclusive.
    7. Global Scale and Local Adaptability: Starbucks' extensive global presence combined with a multi-domestic strategy that adapts products and store designs to local cultures allows it to penetrate diverse markets effectively while maintaining brand consistency. Its vertical integration further allows for greater control over quality and costs, contributing to a global economy of scale.

    In conclusion, Starbucks' competitive edge as of October 2025 is driven by a dynamic interplay of continuous product and service innovation, strategic R&D, a protected intellectual property portfolio, and a deeply embedded focus on enhancing the customer experience through both physical and digital channels, all underpinned by a commitment to sustainability.

    8. Competitive Landscape

    Starbucks Corporation (NASDAQ: SBUX) maintains a leading, yet increasingly contested, position in the global coffee industry as of October 2, 2025. The company faces a diverse array of rivals across various segments, from traditional coffeehouse chains to fast-food giants and at-home coffee product manufacturers.

    Primary Industry Rivals

    Starbucks' primary industry rivals can be categorized across different segments:

    • Coffeehouse Chains:

      • Dunkin': A major competitor in the United States, focusing on value, speed, and simplicity, often seen as an affordable alternative to Starbucks.
      • Costa Coffee: The second-largest coffeehouse chain globally after Starbucks and the largest in the UK, with an expanding international presence. Coca-Cola is currently reassessing its investment in Costa Coffee, exploring strategic options including a potential sale, due to growth challenges and increased competition.
      • Tim Hortons: A significant player in Canada, known for its coffee and breakfast combinations, and expanding internationally.
      • Dutch Bros: An emerging trendsetter in the U.S. coffee shop market.
      • Local and Specialty Coffee Shops: Numerous independent establishments that appeal to diverse consumer segments with different pricing, quality, and service strategies.
    • Fast-Food Chains with Coffee Offerings:

      • McDonald's McCafé: A strong challenger leveraging McDonald's extensive global infrastructure and offering coffee at competitive prices. McCafé is gaining market share and held approximately 10% of the U.S. coffee market as of May 2025.
      • Other Fast-Food Chains: While not solely focused on coffee, many fast-food chains offer coffee as part of their menu, competing for the on-the-go customer.
    • Packaged and At-Home Coffee Brands:

      • Nestlé (Nescafé, Nespresso, and licensed Starbucks products): A dominant force in the global coffee market, especially in instant and at-home coffee segments. Nestlé's coffee segment was a major growth contributor in 2024, supported by Nescafé, Starbucks, and Nespresso brands.
      • Lavazza, Illy, Folgers, Maxwell House, and Keurig: Brands offering premium and value-oriented at-home coffee options, directly competing with Starbucks' retail packaged coffee products.

    Market Share in Key Segments (as of late 2024/2025 estimates)

    • U.S. Coffee Shop Market Share: Starbucks holds a significant lead with approximately 40% market share in coffee shops in the United States. Following Starbucks is Dunkin' with an estimated 26%, and Dutch Bros with 3%. In terms of store count in the U.S., Starbucks leads with 16,466 stores, compared to Dunkin's 9,580 and Dutch Bros' 831 (as of 2023 data).
    • Global Coffee Shop Market Share: While specific global market share percentages for 2025 are not uniformly available across all competitors, Starbucks is widely recognized as the dominant player. Starbucks and McCafe are expected to dominate the global coffee shop market during the forecast period, with 22,557 and 5,044 outlets respectively. Costa Coffee has over 4,000 stores worldwide. Starbucks operated over 39,000 locations worldwide with a revenue of $36 billion in fiscal year 2023 and aims to expand to 55,000 stores by 2030.
    • Ready-to-Drink (RTD) Coffee: Starbucks maintains a strong presence in the RTD coffee market through its North American Coffee Partnership (NACP) with PepsiCo. In March 2025, Starbucks announced new RTD lines, including Starbucks Iced Energy and Frappuccino Lite, aligning with demand for functional and lower-calorie options. Nestlé also extensively features Starbucks-branded RTD products in its portfolio, driving growth in North America and Europe. The global RTD coffee market is projected to grow significantly, with Asia Pacific dominating in 2024.
    • At-Home Coffee Products: While a specific market share for Starbucks' at-home roasted and ground coffee is not explicitly stated, brands like Folgers, Maxwell House, and Keurig are noted as key rivals in this segment. Nestlé's Nescafé and Nespresso also offer premium at-home options that directly compete with Starbucks' retail products.

    Competitive Strengths and Weaknesses Against Competitors

    Competitive Strengths:

    1. Strong Brand Recognition and Customer Loyalty: Starbucks possesses a powerful global brand that resonates with customers worldwide, fostering high customer loyalty through its "third place" experience. This strong brand image allows it to charge premium prices.
    2. Extensive Global Presence: With over 39,000 stores in more than 80 countries, Starbucks has a vast global footprint, which is a significant advantage over many regional competitors like Dunkin' (present in 42 countries) or Tim Hortons (primarily strong in Canada).
    3. Innovative Product Offerings: Starbucks continually innovates its menu, particularly with cold beverages, which now represent about 75% of its beverage sales, far outpacing hot coffee sales. This innovation caters to evolving consumer preferences and differentiates it from competitors.
    4. Robust Digital Ecosystem and Loyalty Program: The Starbucks Rewards program is highly effective in fostering customer loyalty and encouraging repeat purchases. Its mobile ordering app and strong digital presence are key competitive advantages.
    5. Effective Supply Chain Management: Starbucks has an extensive international supply chain and effective supply chain management, ensuring high-quality products. This helps maintain product consistency across its vast network.
    6. "Starbucks Experience" and Premium Positioning: Starbucks focuses on crafting a premium experience, offering a wide range of handcrafted beverages, quality customer service, and an inviting store atmosphere. This differentiates it from value-focused competitors like Dunkin' and McDonald's McCafé.

    Competitive Weaknesses:

    1. Premium Pricing Limits Market Reach: Starbucks' premium pricing strategy positions it as a luxury coffee brand, which can limit its customer pool, as many consumers opt for less pricey competitors like Dunkin' or McCafé.
    2. Dependence on Coffee Sales: Despite menu diversification, Starbucks remains heavily reliant on coffee sales, making it vulnerable to fluctuations in demand, commodity price volatility, and changing consumer preferences away from coffee. Coffee bean prices, particularly Arabica, reached record highs in early 2025.
    3. High Operational Costs: Maintaining trendy stores, above-average employee wages, and global expansion contribute to high operational costs, necessitating premium pricing.
    4. Imitability of Products and Services: Many Starbucks products are not unique and can be easily imitated by competitors, who may offer similar items at lower prices, such as McDonald's McCafé and Dunkin'.
    5. Labor Relations and Unionization Efforts: Ongoing labor relations and unionization efforts pose operational risks and potential negative publicity.
    6. Vulnerability to Economic Downturns: As a premium brand, Starbucks is more susceptible to economic downturns and reduced discretionary spending, which can impact consumer traffic.

    In summary, Starbucks maintains its market leadership through strong brand equity, global presence, continuous innovation, and a robust digital strategy. However, it must navigate challenges posed by intense competition across all price points, reliance on coffee sales, and the need to balance premium positioning with operational costs in an evolving global market.

    9. Industry and Market Trends

    The global coffee industry and retail food service sector are currently navigating a complex landscape shaped by significant macroeconomic shifts, evolving supply chain dynamics, and distinct cyclical patterns. These trends present both challenges and opportunities for major players like Starbucks Corporation (NASDAQ: SBUX) as of October 2, 2025.

    Sector-Level Trends Impacting the Global Coffee Industry and Retail Food Service

    1. Macro Drivers:

    • Climate Change and Adverse Weather: This is a paramount concern, directly impacting coffee bean production. Major coffee-producing regions, such as Brazil, the world's largest Arabica producer, have experienced severe droughts and frosts in 2024, significantly reducing crop yields. Vietnam, a top Robusta producer, also faced both drought and heavy rainfall, leading to reduced global output. East Africa is grappling with irregular rainy seasons, and Central America is seeing increased coffee leaf rust due to shifting weather patterns. This climate pressure affects the consistency, quality, and yield of coffee, pushing viable farmlands to higher, more fragile altitudes.
    • Inflation and Economic Instability: Global inflation and economic instability have led to a surge in coffee prices, reaching multi-year highs in 2024, with Arabica prices increasing by 58% and Robusta by 70% compared to the previous year. This dramatic increase is being passed on to consumers through higher retail and wholesale coffee product costs, impacting purchasing power and potentially leading some price-conscious consumers to seek cheaper alternatives or increase at-home brewing. Rising interest rates also contribute to increased operational costs for businesses.
    • Geopolitical Tensions and Trade Policies: Global political tensions and logistical challenges, including container shortages and rising freight costs (exacerbated by geopolitical events like those in the Red Sea), are straining the coffee supply chain and disrupting global exports. Trade policies and tariffs, such as the 50% tariff on Brazilian coffee imports in the U.S., also directly impact retail coffee prices by reducing supply and increasing costs for roasters and consumers.
    • Regulatory Changes: The EU Deforestation Regulation (EUDR), set to take effect in December 2025, requires companies to prove their products are not linked to deforestation, adding compliance costs for producers and reshaping supply chain practices.
    • Labor Shortages and Costs: Labor shortages in coffee-growing regions threaten unharvested crops, while rising labor costs in retail food service are pressuring operating margins for coffee shops.

    2. Supply Chain Considerations:

    • Price Volatility of Raw Materials: Coffee prices have been highly volatile, reaching record highs in 2024 and continuing into 2025, driven by supply-demand imbalances, adverse weather, and geopolitical factors. This volatility makes budgeting and planning difficult for companies.
    • Logistics and Shipping Challenges: High freight costs, fuel price increases, and global conflicts continue to disrupt the transportation of green beans, leading to delays and increased costs for roasters worldwide.
    • Sustainability and Ethical Sourcing: Consumers, particularly Millennials and Gen Z, increasingly demand ethically sourced and environmentally responsible coffee. This necessitates investment in traceability, fair pricing for smallholder farmers, and sustainable farming practices (e.g., climate-resilient coffee tree varietals, agroforestry) to ensure long-term supply stability and meet regulatory requirements like EUDR.
    • Shift to At-Home Brewing and RTD: Supply chain disruptions during the pandemic, coupled with rising café prices, spurred a boom in at-home brewing equipment and coffee sales. The ready-to-drink (RTD) coffee segment is also experiencing rapid growth, projected to be the fastest-growing product segment from 2025 to 2030, driven by consumer demand for convenience.

    3. Cyclical Effects:

    • Consumer Spending Cycles: Economic downturns and inflationary pressures can impact discretionary spending on premium coffee products and out-of-home consumption, leading consumers to opt for more affordable options or brew at home. Conversely, periods of economic growth can fuel demand for specialty and experiential coffee offerings.
    • Agricultural Cycles: Coffee production is inherently cyclical, with "on" and "off" years for Arabica varieties leading to biennial fluctuations in output, which can contribute to price volatility. This is further compounded by unpredictable weather patterns.
    • Seasonal Demand: While not explicitly detailed in the provided snippets, coffee consumption often has seasonal variations, with cold beverages peaking in warmer months and hot beverages in colder seasons. The trend towards iced beverages gaining ground against hot coffee suggests a shift in seasonal patterns or year-round demand for cold options.

    Relevance to Starbucks Corporation (SBUX) as of 10/2/2025

    Starbucks is deeply impacted by these sector-level trends, experiencing both significant challenges and strategically adapting to them.

    Impacts on Starbucks:

    • Declining Traffic and Comparable Store Sales: Starbucks has faced a continued decline in traffic across all channels and dayparts, leading to a decrease in comparable store sales (7% drop in Q4 2024, 2% decline in Q3 FY25 globally). This slowdown has impacted the frequency of visits from both Starbucks Rewards members and non-members.
    • Decreased Revenue and Profits, Margin Pressures: In Q4 2024, consolidated revenue decreased 3% year-over-year, and adjusted earnings per share decreased 25%. Q3 FY25 also saw GAAP EPS at $0.49 and non-GAAP EPS at $0.50, significantly below analyst expectations. Operating margins have contracted (e.g., 9.9% in Q3 FY25 compared to 16.6% a year prior in Q3 FY24) due to higher investments in wages and benefits, increased promotional activity, ongoing operational investments (e.g., "Back to Starbucks" strategy), and inflationary pressures.
    • Challenges in Key Markets (e.g., China): Starbucks continues to face a challenging competitive environment in China, its second-largest market, due to heavy competition and macroeconomic headwinds impacting consumer spending.
    • Store Rationalization: Notably, Starbucks announced plans to close hundreds of company-owned outlets in September 2025, alongside continued net new store growth in other areas. This indicates a strategic shift to optimize its store portfolio.

    Starbucks' Strategic Responses and Adaptations:

    • "Back to Starbucks" Strategy: The company has implemented a "Back to Starbucks" strategy to reignite growth, focusing on operational upgrades, innovation, internal talent development, and an enhanced customer experience.
    • Sustainability and Ethical Sourcing Leadership: Starbucks is at the forefront of sustainability, procuring about 5% of the world's coffee supply (800 million pounds annually). They are committed to 100% ethically sourced coffee by 2025 through their C.A.F.E. Practices verification program, which addresses economic, social, and environmental criteria. The company is distributing climate-tolerant coffee trees (nearly 90 million distributed by FY24, aiming for 100 million by 2025) and investing in agroforestry to build climate resilience in farming communities.
    • Green Supply Chain and Technology Investment: Starbucks is prioritizing the creation of a green supply chain network, collaborating with suppliers through a carbon reduction alliance, and adopting digital carbon management systems to measure carbon footprints across operations and supplier networks. They have invested in eco wet mills to save water in coffee processing and use a proprietary "Atlas" system for real-time visibility and management of its global coffee inventory.
    • Pricing Strategy: Despite rising commodity costs, Starbucks will not raise menu prices in North America through fiscal year 2025, likely aiming to maintain customer traffic and competitiveness, even at the cost of narrower margins. In China, they reduced prices on some iced beverages to drive afternoon traffic.
    • Innovation and Product Diversification: Starbucks continues to focus on product innovation, adapting to consumer preferences for customized, experiential, and cold beverages (e.g., cold brews, espresso-based drinks with various add-ons). The ready-to-drink (RTD) business is also a growing focus, signaling a maturing local supply chain and broader brand value elevation, particularly in markets like China.
    • Global Expansion and Optimization: While facing challenges, Starbucks aims for continued global store expansion, projecting 45,000 stores globally by the end of 2025 and 55,000 by 2030, with a significant focus on growth in China (aiming for 9,000 stores by 2025). This expansion is coupled with the closure of underperforming stores to optimize their footprint.

    In conclusion, the global coffee industry and retail food service are experiencing a period of significant transformation driven by climate-induced supply shocks, inflationary pressures, and evolving consumer demands for specialty and sustainable products. Starbucks, while facing declining traffic and margin pressures, is actively responding with a multi-pronged strategy focused on operational improvements, aggressive sustainability initiatives, technological integration in its supply chain, strategic pricing, and targeted expansion and optimization to navigate these turbulent trends and secure its long-term market position.

    10. Risks and Challenges

    Starbucks Corporation (NASDAQ: SBUX) currently faces a multifaceted landscape of operational, regulatory, potential controversies, and market risks as of October 2, 2025. These challenges stem from various internal and external factors, impacting its financial performance and brand reputation.

    Operational Risks

    Starbucks is undergoing significant operational restructuring to address declining customer engagement and market share. This includes a $1 billion plan to close approximately 1% of its North American stores (hundreds of locations) by the end of fiscal year 2025, eliminating 900 corporate jobs, and simplifying its menu by 30%. This restructuring, while aimed at long-term improvements in customer experience through store redesigns and increased investment in frontline staff, has led to a short-term 38% drop in operating income in Q2 2025. Employee morale and retention are also at risk due to layoffs and concerns over working conditions and pay, further exacerbated by ongoing unionization efforts.

    The company's supply chain faces significant vulnerabilities due to geopolitical risks and increased tariffs. Trade tensions, particularly between the U.S. and China, exacerbate supply chain disruptions, leading to sourcing instability and rising production costs. For example, U.S. tariffs on Swiss supplier Thermoplan have forced Starbucks to relocate production to Germany and the U.S., incurring weekly costs of 200,000 CHF. Furthermore, a looming 50% U.S. tariff on Brazilian coffee could add 3.5% in annual costs, potentially reducing earnings by two cents per share. Global supply chain disruptions can lead to increased raw material costs, potential stock-outs, compromised product quality, and disruptions in production schedules.

    Cybersecurity threats pose another substantial operational risk. In late 2024, a ransomware attack on Blue Yonder, a third-party software vendor for Starbucks, disrupted payroll and scheduling systems, highlighting the vulnerability of interconnected digital systems. Such attacks can lead to data breaches, operational disruptions, and reputational damage. Starbucks is also conducting a biodiversity impact assessment of its coffee supply chain to be completed by the end of 2025, in line with nature-related financial disclosures, acknowledging that a healthy coffee supply relies on a healthy planet.

    Regulatory Risks

    Starbucks operates globally and is subject to diverse regulatory environments, leading to various compliance challenges. A significant current regulatory risk stems from a lawsuit filed in February 2025 by the Missouri Attorney General against Starbucks. The lawsuit alleges that the company's Diversity, Equity, and Inclusion (DEI) initiatives violate anti-discrimination laws by potentially implementing demographic-based hiring quotas and tying executive compensation to diversity goals. This lawsuit highlights the growing legal scrutiny of corporate DEI practices. Starbucks has denied these allegations, asserting that its hiring practices are merit-based and inclusive.

    The company also faces ongoing legal challenges related to labor laws and unionization efforts. Starbucks Workers United has filed numerous unfair labor practice charges against the company, alleging refusal to bargain in good faith over economic issues and engaging in anti-union tactics. In September 2025, an Administrative Law Judge found that Starbucks violated the National Labor Relations Act by discharging employees due to union activities and ordered remedies such as reinstatement and back wages. These legal battles and regulatory non-compliance can result in significant financial penalties and reputational damage.

    Potential Controversies

    Starbucks is currently embroiled in several controversies that negatively impact its brand and financial performance. A widespread and ongoing boycott, driven by perceived anti-union practices and alleged ties to Israel amid the war in Gaza, has led to significant financial losses. The company's stock declined for 12 consecutive sessions after October 7, 2023, and global sales have been affected, with a 36% revenue collapse reported by its Malaysian operator due to the boycott. Starbucks has denied providing financial support to Israel.

    Accusations of workers' rights violations persist, ranging from low wages and unfair treatment to anti-union tactics, intimidation, and surveillance of employees. Boycotts and protests have gained momentum, with consumers leveraging their influence to pressure Starbucks on issues of fair wages and corporate accountability.

    Furthermore, Starbucks faces scrutiny regarding its ethical sourcing practices. A lawsuit filed in 2024 by the National Consumers League (NCL) alleges that Starbucks misled the public about its sustainable sourcing and knowingly sourced from suppliers with documented human rights and labor abuses, including modern slavery, child labor, and sexual abuse in coffee and tea plantations in Brazil, Guatemala, and Kenya. This lawsuit is proceeding in the DC Superior Court as of January 2025.

    The company's approach to social justice initiatives has also drawn criticism, with some perceiving it as "performative allyship" where Starbucks supports causes only when it is profitable or socially safe to do so. Recent policy changes, such as restricting restroom access to paying customers, have sparked controversy, reversing a previous "open door" policy implemented after a racial bias incident in 2018.

    Market Risks

    Starbucks faces intense competition from both established chains and newer, more agile rivals globally. In China, local competitors like Luckin Coffee offer products at significantly lower prices (around 50% less) and have surpassed Starbucks in store count, challenging its premium pricing strategy in a price-sensitive market. McDonald's and Dunkin' also pose significant competitive threats, especially in the breakfast market and with their extensive global footprints. Newer artisan coffee shops, such as Blank Street, Black Sheep Coffee, and Gail's, appeal to consumers seeking a more local and authentic experience.

    Shifts in consumer spending habits and preferences represent a critical market risk. Economic uncertainty and inflation are prompting consumers to cut back on discretionary spending, impacting demand for premium-priced products like Starbucks coffee. U.S. comparable store sales have shown negative trends for six consecutive quarters, with customer traffic declining. Consumers are increasingly opting for more affordable at-home coffee options or fast-casual alternatives that combine convenience with affordability. Generation Z, in particular, values customization, affordability, and non-coffee alternatives, areas where newer chains are gaining ground.

    Starbucks' "third place" concept, once a cornerstone of its brand, is also experiencing a shift. Customers are spending less time lingering in coffee shops, opting for quick pickups and mobile orders, which challenges Starbucks' traditional cafe vibe. The company is attempting to address this by redesigning over 1,000 stores to create a warmer, more community-driven atmosphere. However, the effectiveness of this "Back to Starbucks" strategy in reversing declining engagement and market share remains to be seen, with analysts projecting a longer recovery period. The company's brand reputation has also suffered, dropping significantly in global brand rankings.

    11. Opportunities and Catalysts

    Starbucks Corporation (NASDAQ: SBUX) is actively pursuing several growth levers to enhance its stock performance, focusing on new market expansion, strategic mergers and acquisitions (M&A) potential, product diversification, and impactful near-term events. As of October 2, 2025, these strategies are central to the company's "Triple Shot Reinvention" plan under CEO Brian Niccol.

    Potential Growth Levers for Starbucks (SBUX)

    1. New Market Expansion:
    Starbucks aims for significant global growth, projecting an increase to 55,000 stores worldwide by 2030, averaging eight new store openings per day. This aggressive expansion prioritizes international markets, which are anticipated to contribute nearly one-third of Starbucks' long-term earnings growth.

    • China: A primary focus for expansion, Starbucks intends to operate approximately 9,000 stores in China by 2025, having expanded its network by 65% since 2019. This highlights a strong commitment to the rapidly growing Chinese market.
    • Emerging Markets: India, Southeast Asia, and Latin America represent substantial untapped potential, with Starbucks currently only 19% penetrated in these regions and identifying an opportunity for over 10,000 additional stores.
    • Middle East: Starbucks has unveiled plans to open 500 new outlets in the Middle East over the next five years, signaling a strategic move to capitalize on the region's burgeoning coffee culture.
    • United States: Domestically, Starbucks seeks to double its U.S. store count while simultaneously optimizing its existing portfolio through renovations, new store constructions, and strategic closures of underperforming locations.

    2. M&A Potential:
    While direct large-scale acquisitions are not prominently discussed, Starbucks' M&A strategy includes vertical integration and divestitures to streamline operations and focus on core strengths.

    • Coffee Farm Acquisitions: Starbucks has recently acquired two new coffee farms in Guatemala and Costa Rica. This move aims to foster innovation in coffee production and sustainability, with future plans to acquire farms in Africa and Asia, strengthening its supply chain and quality control.
    • China Business Stake Sale: Amidst challenges from local competitors like Luckin Coffee, Starbucks is exploring the sale of a significant stake in its China operations. Various private equity firms and Chinese companies, including Hillhouse Capital, Carlyle, KKR, FountainVille Capital, PAG, China Resources, and Meituan, have expressed interest, with potential valuations for the China unit ranging from $5 billion to $10 billion. Starbucks' CEO Brian Niccol stated the company intends to retain a meaningful stake and will only proceed with a transaction if it aligns with Starbucks' strategic interests. The process for non-binding bids was ongoing as of August 2025, with a deal potentially concluding by 2026.

    3. Product Diversification:
    Starbucks continues to diversify its product offerings beyond traditional coffee to cater to evolving consumer preferences and expand revenue streams.

    • Expanded Beverage Menu: The company consistently introduces a wide range of beverages, snacks, and food items.
    • Protein-Focused Beverages: As of September 29, 2025, Starbucks launched new Protein Lattes and Protein Cold Foam drinks, part of a strategy to modernize its menu and meet the growing consumer demand for protein. These new offerings provide up to 36 grams of protein per medium-sized beverage. A ready-to-drink version of these protein beverages is planned for grocery and convenience stores next year.
    • Seasonal Offerings: Seasonal products, such as the highly popular Pumpkin Spice Latte (which returned on August 26, 2025), remain key drivers for sales and customer engagement.
    • At-Home Coffee Market: Starbucks is strengthening its presence in the "at-home" segment through its "at Home" line, featuring K-Cup pods and roast and ground coffee available in grocery stores, aiming to capture a larger share of consumer spending on coffee consumed outside its cafes.
    • Merchandise: The diversification strategy also includes the sale of merchandise like mugs, tumblers, and coffee-making equipment, reinforcing the brand and adding revenue streams.

    4. Near-Term Events (as of 10/2/2025):

    • Upcoming Earnings Report: Starbucks is estimated to report its Q4 2025 earnings on October 29, 2025. The consensus EPS forecast for the quarter is $0.57. This report will be a critical event for stock performance, as recent earnings showed a miss on EPS despite a revenue beat in Q3 2025.
    • Recent Product Launches: The launch of the new Protein Lattes and Protein Cold Foam drinks in late September 2025 is a near-term catalyst.
    • North American Restructuring: Starbucks announced plans to close approximately 500 underperforming stores in North America and reduce 900 corporate employees as part of a restructuring effort to achieve $1 billion in cost savings. These actions are expected to incur about $1 billion in charges, primarily in fiscal 2025, but are aimed at long-term operational efficiency.
    • China Business Stake Sale Progress: The ongoing process of seeking non-binding bids for a stake in its China business, with a potential deal by year-end 2025 or early 2026, could significantly impact investor sentiment depending on the outcome and valuation.
    • Leadership and Strategic Vision: The new CEO, Brian Niccol, who took the helm in September 2024, is implementing a "Back to Starbucks" plan focused on core coffee products, enhanced customer experience, better pricing, faster service, and reinvigorating partner culture. His leadership and the $3 billion efficiency program are seen as potential catalysts for long-term growth and margin expansion.
    • Dividend Payout: Starbucks declared a quarterly cash dividend of $0.61 per share, which was payable on August 29, 2025, offering robust returns to investors.

    12. Investor Sentiment and Analyst Coverage

    As of October 2, 2025, investor sentiment for Starbucks Corporation (NASDAQ: SBUX) presents a mixed picture, characterized by a "Moderate Buy" consensus from Wall Street analysts, varied institutional activity, and a somewhat cautiously optimistic retail investor base responding to recent company actions.

    Wall Street Analyst Ratings and Consensus:
    Wall Street analysts largely maintain a favorable, though not overwhelmingly bullish, outlook on Starbucks. The consensus rating typically falls between "Moderate Buy" and "Buy." According to various sources, between 21 and 29 analysts cover SBUX, with the majority issuing "Buy" or "Strong Buy" recommendations. For instance, 21 analysts gave a "Moderate Buy" rating, based on 13 "Buy," 6 "Hold," and 2 "Sell" recommendations in the last three months. Another report from 26 analysts over the last 12 months shows 1 "Strong Buy," 15 "Buy," 8 "Hold," and 2 "Sell" ratings.

    The average 12-month price target for SBUX ranges from $101.04 to $104.00, implying an upside potential of 17.88% to 21.10% from its current trading levels (around $84-$86). Recent specific analyst actions include TD Cowen reiterating a "Hold" rating with a $95 price target on September 25, 2025, and Baird upgrading to "Buy" with a $115 target on August 12, 2025. BTIG also reiterated a "Buy" rating with a $105 price target as of September 26, 2025.

    Despite this generally positive sentiment, there are underlying concerns. Citigroup, for example, dropped its target price from $100 to $99 and maintained a "Neutral" rating in July 2025. Analysts acknowledge that Starbucks' turnaround initiatives are taking longer than expected, and a return to positive transaction counts in the U.S. is seen as a crucial catalyst.

    Recent Moves by Hedge Funds and Institutional Investors:
    Institutional ownership of Starbucks remains strong, at approximately 84.01%. However, recent hedge fund activity shows a slight decrease in holdings. Based on tracked hedge funds, their collective holdings in Starbucks decreased by 368.1K shares in the last quarter. While 487 hedge funds submitted 13F filings, a more recent article from September 30, 2025, noted 66 hedge fund investors in SBUX.

    Individual institutional movements in Q3 2025 were mixed. For instance, Corient Private Wealth LLC significantly increased its holdings by 24% as of September 26, 2025, while Texas Permanent School Fund Corp decreased its shares by 35.4% on September 24, 2025. Silicon Valley Capital Partners saw a substantial reduction of 74.4% in its SBUX holdings as of September 11, 2025. This suggests a divergence in strategies among major investors, with some reducing exposure and others increasing it, reflecting the ongoing assessment of the company's restructuring efforts.

    General Retail Investor Sentiment and Chatter:
    Retail investor sentiment, while showing recent signs of improvement, is tempered by the company's performance challenges and turnaround efforts. On October 2, 2025, Starbucks' stock experienced a 3% jump after the company announced a marginal increase in its quarterly dividend to $0.62 per share, signaling a commitment to shareholder returns amidst its restructuring. This dividend increase follows a comprehensive $1 billion restructuring plan unveiled on September 25, 2025, which includes closing underperforming stores, cutting 900 non-retail jobs, and remodeling over 1,000 locations.

    Despite the positive reaction to the dividend hike, Starbucks' stock has underperformed the broader market, down 8.43% year-to-date and 15.1% over the past six months, and trading 25% below its 52-week high from February 2025. Retail investor chatter on platforms like Stocktwits shifted to "bullish" as of September 26, 2025, from a "neutral" stance the previous day, likely influenced by the restructuring news and dividend increase.

    However, underlying concerns persist regarding declining same-store sales, which fell 2% globally in Q3 FY2025, and continued weakness in consumer demand, particularly in crucial markets like China where competition is intense. Some commentators suggest that 2025 could be a "throwaway year" as CEO Brian Niccol's restructuring efforts take time to materialize, with questions remaining about valuation sustainability given a forward P/E ratio of 37x for FY 2025. The company's focus on improving the in-store experience, while a strategic move, is seen as a challenging task given the success of competitors focusing on drive-thrus and quick turnover.

    13. Regulatory, Policy, and Geopolitical Factors

    Starbucks Corporation (NASDAQ: SBUX) faces a dynamic landscape of regulatory, policy, and geopolitical factors that could significantly impact its operations, compliance requirements, government interactions, and overall business as of October 2, 2025.

    Relevant Laws and Compliance

    1. Labor Laws and Unionization:
    Starbucks continues to grapple with significant labor relations challenges, particularly regarding unionization efforts in the United States. As of early 2025, the company has faced numerous allegations and rulings from National Labor Relations Board (NLRB) administrative law judges, finding Starbucks in violation of federal labor laws. These violations include illegally firing pro-union employees and offering improved wages and benefits to non-unionized workers as a tactic to dissuade unionization. Starbucks has announced plans to appeal some of these rulings. The company's attempt to exclude unionized employees from certain wage and benefit improvements has been deemed a "carrot and stick" tactic, leading to orders for Starbucks to compensate unionized employees for lost wages and benefits. These ongoing legal battles and the national framework agreed upon for contract bargaining with Starbucks Workers United highlight a persistent need for robust compliance with labor laws to avoid further penalties and reputational damage.

    Beyond unionization, Starbucks is also facing legal challenges related to its internal policies. As of September 2025, employees in Illinois, Colorado, and California have filed lawsuits against a stricter dress code policy implemented under CEO Brian Niccol. Workers argue that being required to purchase new attire without reimbursement violates state labor laws. Additionally, in January 2025, Starbucks began enforcing a policy requiring corporate employees to return to the office three days a week, with non-compliance potentially leading to termination, which could also lead to employee relations issues.

    2. Food Safety Regulations:
    Starbucks maintains stringent food safety and hygiene standards globally. These protocols align with public health regulations, emphasizing personal hygiene, proper food storage, preparation, and temperature control. The company adheres to Global Food Safety Initiative (GFSI) standards and British Retail Consortium guidelines, implementing measures such as strict separation of raw and finished products, cross-contamination prevention, and Clean-In-Place (CIP) automated cleaning systems in its facilities. Employee training on handwashing, equipment sanitation, and allergen management is a key component of their compliance. Depending on the location, baristas and other employees may be required by state or local regulations to hold a food handler card. Any imminent health hazards must be immediately reported to regulatory authorities by managers.

    3. Environmental Regulations and Sustainability:
    Starbucks must comply with a diverse array of environmental regulations across its global operations, covering aspects such as waste disposal, recycling, emissions, and energy use. Non-compliance could result in fines, legal challenges, and damage to its brand reputation.

    A significant upcoming policy is the European Union Deforestation Regulation (EUDR), which took effect in June 2023 with an 18-month implementation period. This regulation will require companies like Starbucks to trace coffee supplies back to the specific plot of land to ensure products are not linked to deforestation or human rights abuses. Starbucks' long-standing Coffee and Farmer Equity (C.A.F.E.) Practices, which promote sustainable agricultural practices, biodiversity, and ethical sourcing, position the company favorably to meet these stringent traceability requirements.

    Despite these efforts, Starbucks' carbon footprint increased by 8% in fiscal year 2023 compared to its 2019 baseline. The company has updated its 2030 sustainability goals, aiming to cut its climate, water, and waste footprints by 50% and achieve net-zero emissions by 2050. Starbucks is also actively involved in initiatives like the Business Coalition for a Global Plastics Treaty and the NextGen Consortium to reduce plastic waste and promote circularity in packaging.

    4. Data Privacy Laws:
    Starbucks is committed to complying with applicable data privacy and protection laws globally. Its privacy notice, last revised in September 2025, details how personal information is collected, used, shared, and protected, emphasizing principles of data minimization and limited collection/use. For data transfers from the EU and Switzerland, Starbucks adheres to Privacy Shield Principles and is subject to the regulatory enforcement powers of the U.S. Federal Trade Commission. The company uses standard contractual clauses approved by the European Commission to ensure an adequate level of data protection for EU/UK data transfers, as required by GDPR. Starbucks employs technical, physical, and administrative security measures to protect information, although it acknowledges that no system is entirely impervious to unauthorized access. The company may also be legally required to disclose personal data to public authorities, including for national security or law enforcement purposes.

    5. Supply Chain Regulations (Ethical Sourcing and Human Rights):
    Starbucks places a high priority on ethical sourcing and transparency throughout its supply chain, particularly for coffee and tea. Its C.A.F.E. Practices for coffee cover product quality, economic accountability, social responsibility (including minimum legal wages, safe working conditions, and zero tolerance for child labor), and environmental leadership. Similarly, tea suppliers must adhere to Starbucks' Supplier Code of Conduct, Global Human Rights Statement, and hold a Rainforest Alliance Certificate, which includes requirements for legal minimum wages and progress toward a living wage.

    However, Starbucks is facing increased scrutiny and legal challenges regarding its supply chain ethics. In May 2025, a class action lawsuit was filed in the U.S. District Court for the District of Columbia, alleging Starbucks' complicity in forced labor and human rights violations on Brazilian coffee plantations. The lawsuit contends that Starbucks' Tier 1 supplier, Cooxupé, has been linked to such abuses and that the C.A.F.E. program, despite its aims, has been inadequate in preventing them. This lawsuit highlights ongoing risks in global supply chains and the need for rigorous, verifiable oversight.

    6. Diversity, Equity, and Inclusion (DEI) Policies:
    In February 2025, Starbucks became the target of a high-profile lawsuit filed by the Missouri Attorney General, alleging that the company's DEI initiatives violated anti-discrimination laws. The lawsuit claims Starbucks implemented hiring practices that prioritized certain demographic groups and offered exclusive opportunities through Employee Resource Groups (ERGs) based on race or gender. Starbucks denies these allegations, stating that its hiring practices are merit-based and inclusive, and that ERG activities are open to all employees. This legal challenge underscores the evolving regulatory landscape surrounding DEI and the potential for increased scrutiny and litigation for corporations with extensive diversity programs.

    Government Incentives

    Starbucks benefits from certain government incentives, primarily related to its social responsibility and environmental initiatives.

    • Tax Benefits for Food Donation: The company receives a U.S. federal tax benefit for every pound of food donated through its FoodShare program, which supports hunger relief. Starbucks commits to reinvesting 100% of this benefit back into its food waste reduction and hunger relief efforts, including providing Capacity Building Grants to food banks.
    • State and Local Subsidies: Starbucks has received state and local government incentives, including tax credits, rebates, and grants. As of October 2025, historical records show over $3.9 million across 15 awards, with the most recent listed in Illinois in 2023. These incentives often relate to job creation or economic development.
    • Internal Incentives: While not a government incentive, Starbucks has implemented internal stock incentives for executives, with each individual's target reward valued at $6 million, conditional upon achieving profitability and cost control, starting to be realized after the company's fiscal year 2027. This demonstrates internal policy linked to performance but is filed as a regulatory disclosure.

    Geopolitical Risks and Opportunities

    1. Middle East Conflict and Boycotts:
    The ongoing Israel-Hamas conflict has posed a significant geopolitical risk for Starbucks. Boycotts against the brand, driven by perceptions of its stance on the conflict, have led to "challenging trading conditions" in the Middle East and beyond, impacting sales and customer traffic in North America as well. Starbucks explicitly states it has no political agenda and does not fund any government or military operations.

    Despite these denials, the financial impact has been substantial. In early 2024, Alshaya Group, Starbucks' franchisee in the Middle East and North Africa, laid off approximately 2,000 workers (over 10% of its regional workforce) due to plummeting sales caused by the boycotts. As of September 2025, Starbucks announced the permanent closure of 400 "underperforming" stores across the U.S. and Canada as part of a $1 billion restructuring plan. While the company attributed these closures to restructuring and underperformance, activists contend they are a direct consequence of sustained boycott pressure. The boycotts have also created an opportunity for local coffee chains in the Middle East, which have seen increased sales. This situation underscores the immense power of consumer activism in a hyper-connected world and the vulnerability of global brands to polarizing geopolitical events.

    2. China Risks and Competition:
    Starbucks views China as a crucial growth market but faces considerable geopolitical and competitive risks.

    • Geopolitical Tensions: There are growing concerns among investors about Starbucks' significant exposure to China, particularly given rising geopolitical tensions between the U.S. and China. The possibility of political interference by the Chinese Communist Party (CCP), including punitive anti-American actions or even asset seizure in scenarios like an invasion of Taiwan, represents a material financial risk.
    • Intensified Competition: Starbucks is encountering fierce competition from rapidly expanding local coffee chains in China, such as Luckin, Cotti, and Manner. These local competitors often offer products at significantly lower prices, attracting Chinese consumers who are increasingly price-sensitive due to economic pressures.
    • Chinese Nationalism: The rise of Chinese nationalism and potential anti-American sentiment can also impact consumer preferences, leading some to favor domestic brands over foreign ones like Starbucks.
      Despite adding around 1,500 new stores between 2022 and 2024, Starbucks' revenue in China has not increased proportionally, indicating that aggressive expansion alone is insufficient to overcome these challenges. Some investors have even suggested spinning off the Chinese division, although the potential benefits are debated. Navigating these dynamics requires Starbucks to balance its growth ambitions with careful geopolitical risk management and localized strategies to maintain relevance and competitiveness.

    3. Global Supply Chain Vulnerabilities and Climate Change:
    Starbucks' global coffee supply chain remains vulnerable to various geopolitical and environmental factors. Climate change directly impacts coffee-growing regions, threatening crop yields and quality, which can lead to increased sourcing costs and supply instability. To mitigate this, Starbucks is investing in initiatives to reduce its carbon and water footprints on farms, promote climate-resistant coffee tree varietals, and restore at-risk forests.

    The increasing focus on ethical sourcing and sustainability, reinforced by regulations like the EU Deforestation Regulation, also presents both a risk and an opportunity. While it demands robust traceability and compliance, Starbucks' long-standing C.A.F.E. Practices can serve as a competitive advantage by assuring consumers of ethically and sustainably sourced coffee. However, the ongoing lawsuit alleging forced labor in its Brazilian supply chain highlights the persistent challenges in ensuring full compliance across a vast global network and the potential for reputational and legal repercussions.

    In conclusion, as of October 2025, Starbucks faces a complex interplay of regulatory demands, ongoing labor disputes, and significant geopolitical pressures, particularly in the Middle East and China. While the company leverages government incentives for sustainability and hunger relief, it must continually adapt its strategies to ensure compliance, mitigate risks from global conflicts and intense market competition, and uphold its brand reputation in an increasingly scrutinized global environment.

    14. Outlook and Scenarios

    Starbucks Corporation (NASDAQ: SBUX) is navigating a complex global landscape as of October 2, 2025, marked by both strategic initiatives and significant headwinds. The company's recent performance reflects challenges in key markets, particularly North America and China, prompting a "Back to Starbucks" strategy focused on operational efficiency, menu innovation, and digital transformation under CEO Brian Niccol, who took the helm in September 2024.

    Bull Case for Starbucks (SBUX)

    Short-Term Projections (Next 12-18 months):

    The short-term bull case for Starbucks hinges on the successful execution of its "Back to Starbucks" strategy, which aims to stabilize performance and re-engage customers. The company expects to see a gradual improvement in financial performance, with analysts projecting an EPS rebound after a decline in fiscal year 2025, anticipating a rise of 19.4% to $3.70 in fiscal year 2026.

    • Operational Enhancements: Investments in U.S. store operations, equipment upgrades, and the rollout of the "Siren Craft System" are expected to improve efficiency and the customer experience, reducing wait times and enhancing service quality.
    • Menu Innovation Success: The recent launch of Protein Lattes and Protein Cold Foam in September 2025 caters to growing consumer demand for healthier, protein-rich options, potentially boosting average ticket and attracting new customers. These products are part of a broader strategy to modernize the menu.
    • Digital Acceleration: Continued enhancements to the Starbucks mobile app, mobile order-and-pay, and the Starbucks Rewards program are anticipated to strengthen customer loyalty and engagement. Significant innovations to the rewards program are planned for early 2026. Mobile orders already constitute 31% of total transactions as of 2025.
    • China Recovery: Despite recent struggles, Starbucks China showed signs of recovery in Q3 fiscal year 2025, with net revenue increasing 8% year-on-year and comparable store sales rising 2%, marking the first positive increase in six quarters. The company's digital innovation center in Shenzhen and localized product offerings could drive further rebound.

    Long-Term Projections (3-5 years and beyond):

    The long-term bull case envisions Starbucks leveraging its strong brand, global presence, and strategic investments to achieve sustained growth and market leadership.

    • Aggressive Global Expansion: Starbucks aims to expand its global footprint to 55,000 stores by 2030, with three out of every four new stores in the near term expected to be outside the U.S. Specific plans include reaching 9,000 stores in China by 2025 and opening 500 new stores in the Middle East over the next five years.
    • Digital Dominance: Doubling its global Starbucks Rewards members to 150 million within five years and integrating AI-driven platforms like Deep Brew will enhance personalization, operational efficiency, and customer engagement, creating a significant competitive advantage.
    • "Third Place" Reinvention: A focus on store redesigns and creating a more inviting "third place" experience, coupled with efficient operations for mobile orders, could draw customers back to physical locations for longer stays. Over 1,000 locations are planned for uplift over the next 12 months.
    • Sustainability Leadership: Starbucks' commitment to becoming "resource positive" by 2030, with goals to halve carbon emissions, water usage, and waste, resonates with increasingly eco-conscious consumers. Initiatives include expanding plant-based options, shifting to reusable packaging, and certifying 10,000 Greener Stores by 2025.

    Potential Strategic Pivots for the Bull Case:

    • Accelerated Health & Wellness Focus: Further expanding its menu with functional beverages, healthy food options, and plant-based alternatives to capture a larger share of the wellness market.
    • Hyper-Personalization via AI: Deepening the use of AI to offer highly personalized drink recommendations, promotions, and in-store experiences, making the Starbucks app indispensable to customers.
    • Strategic Partnerships in Emerging Markets: Collaborating with local entities in high-growth regions (e.g., China, India) to accelerate expansion, localize offerings, and navigate complex market dynamics more effectively.
    • Diverse Store Formats: Expanding the variety of store formats, including smaller pick-up only, drive-thru only, and delivery-only locations, to optimize for convenience and efficiency in different urban and suburban settings.

    Bear Case for Starbucks (SBUX)

    Short-Term Projections (Next 12-18 months):

    The short-term bear case for Starbucks highlights the potential for ongoing struggles with declining comparable store sales, increased competition, and rising operational costs.

    • Continued Sales Weakness: Starbucks has experienced negative global comparable store sales in Q3 and Q4 2024, and Q1 2025, with North America transactions declining significantly. Analysts project a further 3% decline in U.S. same-store sales for Q3 fiscal year 2025. A prolonged "challenged customer experience" and failure to improve traffic could exacerbate this trend.
    • Margin Pressure from Costs: Rising coffee commodity prices, increased labor investments (wages, benefits), and general inflationary pressures could continue to squeeze profit margins. Q1 fiscal year 2025 saw operating margin contract to 16.7% from 21.4% in the prior year.
    • Intensified Competition: Fierce competition in the U.S. and particularly in China, where local players offer lower-priced alternatives, could continue to erode Starbucks' market share and brand value.
    • Consumer Backlash on Pricing: Customers have expressed dissatisfaction with Starbucks' premium pricing, and the company's ability to pass on increased costs may be limited, potentially leading to reduced sales volumes.
    • Impact of Restructuring: While intended for long-term gain, the short-term pain of restructuring, including planned closures of underperforming stores (a 1% decline in company-operated stores in North America in FY2025), could lead to temporary disruption and reduced revenue.

    Long-Term Projections (3-5 years and beyond):

    The long-term bear case suggests that Starbucks might fail to adapt to changing consumer preferences and competitive pressures, leading to sustained underperformance and a diminished market position.

    • Erosion of Brand Premium: A continued decline in sales and customer satisfaction, coupled with intense competition, could permanently damage Starbucks' premium brand image and its ability to command higher prices.
    • Failure in China Market: Despite ambitious expansion goals, if Starbucks cannot effectively compete with local rivals on price, convenience, and localization, its significant investments in China could yield disappointing returns. Revenue in China has already fallen 19% since 2021.
    • Ineffective Digital Strategy: If digital initiatives fail to significantly boost loyalty and traffic, or if competitors innovate faster, Starbucks could lose its edge in a critical area of growth.
    • Labor Relations Escalation: Ongoing tensions with labor and unionization efforts could lead to higher operational costs, negative publicity, and disruptions to service.
    • Gen Z Disengagement: Failure to connect with younger demographics, who may prioritize affordability or alternative brands, could impact long-term customer acquisition and loyalty.

    Potential Strategic Pivots for the Bear Case:

    • Aggressive Cost Cutting: Implementing more severe cost-cutting measures, potentially impacting employee benefits, store ambience, or ingredient quality, to protect margins, which could further alienate customers and employees.
    • Price Adjustments: Lowering prices or increasing promotional activities significantly to compete with value-oriented rivals, potentially diluting the brand's premium image.
    • Divestment of Underperforming Assets: Selling off or significantly scaling back operations in challenging markets, such as certain regions in China, to focus resources on more profitable ventures.
    • Franchising Model Shift: Expanding the use of licensed and franchised stores more broadly, especially internationally, to reduce operational overhead and capital expenditure, shifting risk to partners.
    • Enhanced Diversification: Investing heavily outside core coffee products, potentially through acquisitions in other food and beverage categories, to reduce dependence on coffee sales.

    15. Conclusion

    Starbucks Corporation (NASDAQ: SBUX) is currently navigating a period of profound strategic transformation, underscored by its "Back to Starbucks" plan. As of October 2, 2025, the company aims to revitalize its financial performance and enhance the customer experience amidst a challenging global economic and competitive landscape. The success of these initiatives will be a critical determinant of its future trajectory.

    Summary of Key Findings:

    Starbucks has recently faced significant financial headwinds. Fiscal year 2024 saw only a modest 1% increase in consolidated net revenues to $36.2 billion, while GAAP earnings per share (EPS) declined 8% to $3.31. The fourth quarter of fiscal year 2024 was particularly challenging, with a 3% decrease in consolidated net revenues and a 7% drop in global comparable store sales. This trend of declining comparable store sales and transactions persisted into fiscal year 2025, impacting profitability. Operating margins have contracted significantly across these quarters, primarily due to expense deleverage, increased investments in store partner wages and benefits, and heightened promotional activity. While Q3 FY25 revenues saw a modest 3% increase, global comparable store sales still declined by 2%, and adjusted EPS fell by 45%. A notable positive, however, was China's comparable store sales turning positive in Q3 FY25, and international revenue surpassing $2 billion for the first time.

    Under the leadership of new CEO Brian Niccol, the "Back to Starbucks" strategy is aggressively underway. This comprehensive plan focuses on improving store operations, enhancing the customer experience, and optimizing the cost structure. Key initiatives include streamlining the menu, developing a time slot model for mobile orders, adding shelving for order separation, and implementing a "Green Apron service model" to foster human connection. As part of this restructuring, Starbucks is closing underperforming stores in the U.S. and Canada, eliminating approximately 900 corporate jobs, and planning to renovate over 1,000 existing locations. This restructuring is projected to incur about $1 billion in charges, with North American company-operated store count expected to decline by about 1% in FY2025 before resuming growth in FY2026.

    Starbucks also demonstrated its commitment to shareholders by increasing its quarterly cash dividend from $0.61 to $0.62 per share on October 2, 2025, marking its fifteenth consecutive annual dividend increase.

    Investment Profile – Balanced Perspective:

    Strengths: Starbucks benefits from unparalleled global brand recognition, an expansive physical presence with over 40,000 stores worldwide, and an industry-leading loyalty program (Starbucks Rewards). Its commitment to sustainability and a continuous drive for innovation also contribute to its enduring market position.

    Weaknesses and Challenges: The primary concerns for Starbucks investors are the persistent declines in global comparable store sales and transaction volumes, particularly in its crucial North American market. This has exerted significant pressure on operating margins, which have contracted due to increased operational costs, labor investments, and competitive promotional activities. Intense competition, especially from rapidly expanding rivals like Luckin Coffee in China, poses a significant threat to market share in crucial international markets. Broader economic uncertainty and evolving consumer preferences for value and convenience further represent ongoing challenges.

    Opportunities: The "Back to Starbucks" plan, if executed successfully, offers a clear path to improving operational efficiency, enhancing customer experience, and driving long-term growth and margin recovery. Expanding into emerging markets, diversifying product offerings beyond traditional coffee, and leveraging digital and delivery services further represent growth avenues.

    Analyst Sentiment: As of October 2025, Wall Street analysts generally hold a "Moderate Buy" consensus rating for SBUX, with an average price target suggesting potential upside from current levels. However, some analysts have reiterated "Hold" ratings, reflecting caution regarding the pace of the turnaround.

    What Investors Should Watch:

    1. "Back to Starbucks" Plan Execution and Impact: The success of the turnaround strategy is paramount. Investors must monitor whether the new initiatives lead to sustained improvements in comparable store sales and transaction growth, particularly in North America, and if they effectively address operational inefficiencies and enhance the customer experience.
    2. Operating Margin Recovery: Closely watch for signs that the restructuring efforts, coupled with operational efficiencies and a potential reduction in promotional intensity, are leading to a stabilization and eventual expansion of operating margins.
    3. Performance in Key Markets (U.S. and China): Consistent positive comparable store sales and transaction growth in these two major markets are critical indicators of the company's health. The positive turn in China's comparable sales in Q3 FY25 is a promising sign to watch.
    4. Competitive Landscape: The increasing competition in China from players like Luckin Coffee requires continuous monitoring, as does competition from other fast-food and coffee chains globally.
    5. Consumer Spending and Preferences: Shifts in consumer behavior, especially concerning discretionary spending on premium coffee and evolving tastes, could impact Starbucks' future growth.
    6. Financial Guidance: While Starbucks has withheld specific full-year guidance for 2025 due to the ongoing turnaround, any future guidance will be crucial for assessing management's outlook.

    In summary, Starbucks is at a pivotal juncture, implementing a significant turnaround strategy to address recent performance challenges. While the company maintains strong brand equity and a commitment to shareholder returns through dividends, the success of its strategic adjustments, particularly in driving comparable store sales and improving profitability, will be key determinants of its investment profile in the coming years.


    This content is intended for informational purposes only and is not financial advice

  • Acadia Healthcare (ACHC): Navigating Growth, Activism, and Regulatory Headwinds

    Acadia Healthcare (ACHC): Navigating Growth, Activism, and Regulatory Headwinds

    Today's date is 10/2/2025. Acadia Healthcare Company (NASDAQ: ACHC) is a prominent healthcare service provider specializing in behavioral health and addiction treatment services. Established in January 2005 and headquartered in Franklin, Tennessee, Acadia Healthcare has grown to operate an extensive network of facilities across the United States and Puerto Rico. The company’s core mission is to provide compassionate care that improves lives, inspires hope, and elevates communities, setting a standard of excellence in the treatment of specialty behavioral health and addiction disorders. As of early October 2025, Acadia is navigating a dynamic period characterized by strategic adjustments, activist investor pressure, and ongoing efforts to optimize operations amidst a challenging yet growing market for behavioral health services.

    2. Historical Background

    Acadia Healthcare Company (ACHC) was established in January 2005 by private equity firm Waud Capital Partners with the vision of developing and operating a national network of behavioral health facilities. Its early years were marked by foundational steps, including the appointment of Joey Jacobs as CEO in March 2011, bringing seasoned leadership to the helm. A pivotal moment occurred on November 1, 2011, when Acadia completed its Initial Public Offering (IPO) on NASDAQ under the ticker symbol ACHC, following its merger with PHC, Inc. (Pioneer Behavioral Health). This significantly boosted Acadia's operational scale and provided crucial capital for future expansion. At the time of its IPO, Acadia operated 34 facilities with approximately 1,950 licensed beds across 18 states.

    The period between 2014 and 2016 saw Acadia's aggressive expansion, including entry into the methadone clinic sector with the acquisition of CRC Health Group in 2014, making it the largest methadone-clinic chain in the U.S. It also expanded internationally, acquiring Partnerships in Care in June 2014 and the UK-based Priory Group for approximately $2.2 billion in 2015, transforming Acadia into a significant international player.

    However, a strategic pivot occurred between 2016 and 2021, leading to the divestment of its UK operations, most notably the sale of the Priory Group for approximately $1.47 billion (£1.08 billion) in 2021. This marked a strategic decision to refocus on the higher-growth U.S. market and deleverage its balance sheet. Following its exit from the UK, Acadia accelerated its U.S. expansion through de novo facility development, joint ventures with prominent health systems, and targeted acquisitions. By June 30, 2024, Acadia operated 258 behavioral healthcare facilities with approximately 11,400 beds in 38 states and Puerto Rico.

    As of 2025, Acadia faces new challenges, including weaker Medicaid volumes and activist investor pressure. In response, the company announced a strategic pivot in September 2025, planning to reduce capital expenditures by at least $300 million in 2026, pause several growth projects, and close five underperforming facilities. This shift emphasizes prioritizing cash flow generation over aggressive expansion, marking another key transformation in Acadia's history.

    3. Business Model

    Acadia Healthcare Company (ACHC) operates as a leading provider of behavioral healthcare services across the United States and Puerto Rico. As of October 2, 2025, the company's business model is characterized by a comprehensive network of diverse treatment facilities, a broad patient demographic, multiple revenue streams, and an evolving operational strategy focused on growth while addressing market and regulatory challenges.

    Operational Structure and Segments:
    Acadia's operational structure is built around a diversified portfolio of behavioral healthcare facilities designed to offer a continuum of care. As of June 30, 2025, Acadia managed a network of 274 behavioral healthcare facilities with approximately 12,100 beds in 39 states and Puerto Rico, serving over 82,000 patients daily and employing approximately 25,000 individuals. Services are delivered through distinct segments:

    • Inpatient Psychiatric Hospitals: Acute care for severe mental health disorders.
    • Specialty Treatment Facilities: Residential recovery facilities and dedicated centers for eating disorders.
    • Residential Treatment Centers: Longer-term, structured therapeutic environments.
    • Outpatient Clinics: Flexible care options, from partial hospitalization programs (PHPs) and intensive outpatient programs (IOPs) to traditional outpatient services.
    • Comprehensive Treatment Centers (CTCs): Specializing in medication-assisted treatment (MAT) for opioid use disorder. As of Q2 2025, Acadia operated 174 CTCs across 33 states, treating around 74,000 patients daily.

    Acadia also leverages joint venture partnerships with health systems like Henry Ford Health, Geisinger Health, and Ascension to expand its reach and establish new facilities in favorable reimbursement environments. As of Q2 2025, Acadia had 21 joint venture partnerships for 22 hospitals, with 13 operational and 9 more expected to open.

    Product Lines and Services:
    Acadia's core product is comprehensive behavioral healthcare, addressing a wide array of mental health and substance use disorders. Services include detoxification, residential treatment for addiction and dual diagnosis, acute psychiatric inpatient hospitalization, medication-assisted treatment (MAT), and outpatient programming. Offerings are designed for children, teenagers, adults, and seniors.

    Customer Base:
    Acadia's target market primarily consists of individuals grappling with mental health challenges, substance use disorders, and eating disorders, spanning various demographics and socioeconomic backgrounds. The customer base includes patients with diverse insurance coverage:

    • Medicaid: Historically significant, accounting for 57% of revenue in the first nine months of 2024, though weaker volumes have been noted recently.
    • Commercial Insurance: 26% of revenue in the first nine months of 2024, with volumes increasing by 9% in Q2 2025.
    • Medicare: 14% of revenue in the first nine months of 2024, with volumes rising by 8% in Q2 2025.
    • Self-pay and Other Sources: Comprising 3% of revenue.

    Revenue Sources and Generation:
    Acadia generates revenue primarily through patient service revenue from treatments, billed to private insurance, Medicare, Medicaid, and self-pay patients. For Q2 2025, total revenue was $869.2 million, a 9.2% increase year-over-year. Medicaid supplemental payments are crucial, with gross revenue from state programs expected to reach approximately $230 million for the full year 2025.

    Strategic Initiatives and Challenges:
    Acadia is in a period of significant expansion coupled with strategic adjustments. Aggressive growth has led to increased startup losses, projected at $60 million to $65 million for 2025. Weaker Medicaid volumes and legal headwinds (DOJ and SEC investigations, patient mistreatment allegations) are challenges. In response, Acadia plans to reduce capital expenditures by at least $300 million in 2026, pause projects, and close five underperforming facilities, focusing on core businesses and improving free cash flow.

    4. Stock Performance Overview

    Today's date is 10/2/2025. Acadia Healthcare Company (NASDAQ: ACHC) has experienced significant volatility and underperformance across the 1-year, 5-year, and 10-year time horizons. The company's stock has faced substantial headwinds, including governmental investigations, challenges with Medicaid, and analyst downgrades, leading to a notable decline in its share price.

    1-Year Performance (October 2, 2024 – October 2, 2025):
    ACHC shares were trading around $26.24 as of October 2, 2025. The stock experienced a significant drop, being down over 50% year-to-date and 75% on a 12-month basis as of August 7, 2025. The 1-year performance indicates a decrease of -61.03% and -74.56%. This contrasts sharply with the broader S&P 500, which gained approximately +14.77% during a similar period, and the S&P 500 Health Care sector, which saw a decline of -14.30%. The 52-week trading range shows a high of $63.43 and a low of $17.12.

    5-Year Performance (October 2, 2020 – October 2, 2025):
    Over the past five years, ACHC has also struggled, recording a decrease of -17.09%. Compared to its peers, Acadia Healthcare's total return over five years was -29.15%. The S&P 500 achieved an 89.74% return, and the S&P 500 Health Care sector posted a 22.88% return over the same period.

    10-Year Performance (October 2, 2015 – October 2, 2025):
    The decade-long performance reveals a significant erosion of shareholder value. A hypothetical $10,000 investment made in ACHC on September 22, 2015, would be worth approximately $2,984.20 on September 19, 2025, representing a total return of -70.17% and an average annual total return of -11.39%. An activist investor noted the stock was down approximately 71% over the past decade as of October 1, 2025. In contrast, the S&P 500 generated a return of 244.5% and the S&P 500 Health Care sector saw an 84.68% return over the 10-year period.

    Notable Price Movements and Key Events:

    • All-Time High: ACHC reached an all-time high closing price of $89.06 on November 30, 2022.
    • Q2 2025 Earnings Report (August 2025): Despite beating analyst estimates for EPS and revenue, the stock fell sharply by 10.73% due to investor concerns over ongoing external challenges, future uncertainties, government investigations, and Medicaid issues.
    • Analyst Downgrades (August-September 2025): Bank of America Securities downgraded the stock to "Neutral" in September 2025, citing impending Medicaid cuts. Mizuho also lowered its price target.
    • Activist Investor Activity (October 2025): Khrom Capital and Engine Capital publicly urged Acadia to explore a sale or make significant strategic changes, citing underperformance and federal investigations.

    Across all three time horizons, Acadia Healthcare (ACHC) has significantly underperformed both the broader market and its sector, suggesting that company-specific issues and industry-specific headwinds have had a more pronounced negative impact on its stock performance.

    5. Financial Performance

    Today's date is 10/2/2025. Acadia Healthcare Company (ACHC) reported its latest full financial performance for the second quarter ended June 30, 2025, on August 5, 2025. The company is estimated to release its third-quarter 2025 earnings around October 29, 2025.

    Recent Earnings Report (Q2 2025 Highlights as of June 30, 2025):

    • Revenue Growth: Total revenue of $869.2 million for Q2 2025, a 9.2% increase over Q2 2024. Same-facility revenue grew by 9.5% year-over-year, driven by a 7.5% increase in revenue per patient day and a 1.8% rise in patient days.
    • Earnings Per Share (EPS): Net income attributable to Acadia totaled $30.1 million, or $0.33 per diluted share. Adjusted diluted EPS was $0.83, surpassing the consensus analyst estimate of $0.71.
    • Adjusted EBITDA: Increased by 7.6% year-over-year to $201.8 million.
    • Profit Margins: Adjusted EBITDA margin for Q2 2025 was 23.2%. Net profit margin was approximately 3.46%. Gross margin was cited at 42.21%.

    Debt Levels:

    • Long-term debt of $2.247 billion as of June 30, 2025, up from $1.880 billion at December 31, 2024.
    • Total liabilities stood at $3.085 billion as of June 30, 2025.
    • Debt-to-equity ratio for June 2025 was reported as $0.74.

    Cash Flow and Liquidity:

    • Cash and Cash Equivalents: $131.4 million as of June 30, 2025.
    • Revolving Credit Facility: $828.3 million available under its $1.0 billion facility.
    • Cash Flow from Operations: For the six months ended June 30, 2025, net cash provided by operating activities was $47.0 million.
    • Free Cash Flow: For Q2 2025, free cash flow was -$34.24 million, a decrease from $16.91 million in the same quarter last year.

    Key Valuation Metrics:

    • Trailing EPS: $1.51.
    • Trailing Price-to-Earnings (P/E) Ratio: 16.40.
    • Forward Price-to-Earnings (P/E) Ratio: 7.33.
    • Price/Earnings-to-Growth (PEG) Ratio: 4.83.

    Key Trends and Outlook:
    Acadia continues its growth strategy, adding 101 new beds in Q2 2025, with plans for 950-1,000 beds for the full year. Full-year 2025 adjusted EBITDA guidance is $675 million to $700 million, with revenue around $3.33 billion (midpoint) and adjusted EPS of $2.55 (midpoint). Challenges include projected startup losses of $60-65 million for 2025 and concerns over potential Medicaid cuts starting in fiscal year 2028. The stock price decline post-Q2 earnings was attributed to these external challenges and the announced CFO transition.

    6. Leadership and Management

    Today's date is 10/2/2025. Acadia Healthcare Company (NASDAQ: ACHC) is navigating a complex landscape marked by leadership transitions, evolving strategic priorities, and significant pressure from activist investors concerning its governance and financial performance.

    Leadership and Management Team:

    • Chief Executive Officer (CEO): Christopher H. Hunter, serving since April 2022.
    • Chief Operating Officer (COO): Dr. Nasser Khan, appointed effective June 30, 2024.
    • Interim Chief Financial Officer (CFO): Tim Sides, assumed role in August 2025. Heather Dixon previously served as CFO in 2024.
    • Executive Vice President, General Counsel & Secretary: Brian Farley, joined July 2023.
      A notable recent change includes the retirement of John S. Hollinsworth, Executive Vice President of Operations, effective June 30, 2024.

    Board of Directors:
    The Board includes Reeve B. Waud (Founder and Chairman, 20 years tenure) and other long-tenured members. The composition and governance of the board have recently come under scrutiny from activist investors.

    Strategic Vision:
    CEO Christopher Hunter aims to double the company's revenue by 2028. The vision focuses on disciplined growth, expanding access to high-quality behavioral healthcare, strengthening clinical outcomes, and driving operational efficiency. At the Jefferies 2025 Healthcare Services Conference in September 2025, Hunter outlined a refined strategy:

    • Capital Expenditure (CapEx) Reduction: Plans to reduce CapEx by at least $300 million in 2026.
    • Portfolio Optimization: Closing five underperforming facilities and monitoring five others.
    • Capacity Expansion: Nearly 1,800 beds added between 2024-2025, with plans for 500-700 more in 2026.
    • Financial Outlook: Anticipates strong EBITDA growth and improved free cash flow in 2026-2027.

    Notable Recent Changes and Governance Reputation Issues:
    Acadia faces significant pressure from activist shareholders:

    • Activist Investor Pressure: Khrom Capital Management (5.5% stake) and Engine Capital LP (3% stake) are publicly urging Acadia to explore a formal review of strategic alternatives, including a potential sale, citing "persistent underperformance, poor capital allocation, misaligned executive incentives, governance failures, and lack of accountability."
    • Governance Criticisms: Concerns include long tenures of board members, a staggered board, lack of comprehensive corporate governance guidelines, and misaligned incentives (Board and management collectively own only 1.3% of stock).
    • Strategic Missteps: Investors have criticized past "strategic missteps" like the failed UK expansion and an "aggressive and poorly justified capital expenditure campaign."
    • Government Investigations and Lawsuits: The company faces federal investigations by the DOJ and SEC regarding admissions, length-of-stay, and billing practices. A settlement of approximately $20 million for a DOJ fraud probe was reported. The closure of Options Behavioral Health in September 2025 followed allegations of patient abuse and understaffing, with ongoing lawsuits.
    • Financial Performance Concerns: Diminished earnings, conservative guidance, negative free cash flow, and a significant debt burden are points of concern.

    In response, Acadia emphasizes its commitment to enhancing long-term shareholder value through disciplined growth and operational efficiency.

    7. Products, Services, and Innovations

    Today's date is 10/2/2025. Acadia Healthcare Company (NASDAQ: ACHC) stands as the largest stand-alone behavioral healthcare provider in the United States, offering a comprehensive array of services and continuously evolving its operational strategies and technological applications to maintain its competitive edge.

    Current Products and Services:
    Acadia operates an expansive network of 274 behavioral healthcare facilities with approximately 12,100 beds across 39 states and Puerto Rico as of June 30, 2025. Services address a broad spectrum of behavioral health and substance use disorders for children, adolescents, adults, and seniors. Offerings include:

    • Inpatient Psychiatric Hospitals: Acute care for intensive mental health treatment.
    • Specialty Treatment Facilities: Residential recovery facilities and specialized programs for eating disorders.
    • Residential Treatment Centers: Longer-term, structured therapeutic environments.
    • Outpatient Clinics: Flexible care options, including intensive outpatient and partial hospitalization programs.
    • Comprehensive Treatment Centers (CTCs): Specializing in medication-assisted treatment for opioid use disorder. As of Q2 2025, Acadia operated 174 CTCs across 33 states, treating over 74,000 patients daily.

    Innovations and R&D Efforts (Focusing on ACHC):
    Acadia Healthcare's innovation and R&D efforts are primarily centered on enhancing care delivery, improving clinical outcomes, and driving operational efficiency within its extensive network. Key areas include:

    • Strategic Growth and Expansion: Continuous expansion through new bed additions and facility construction. 378 newly licensed beds were added in Q1 2025, with a goal of 950-1,000 beds by year-end 2025 and 500-700 new beds in 2026.
    • Technology Adoption for Patient Safety and Efficiency: Leveraging technology to improve patient care and streamline operations, including a proximity-based patient safety technology tool implemented in 53 facilities in 2023, with further expansion plans. There is a broader focus on leveraging AI and telehealth.
    • Clinical Outcome Enhancement: Emphasizing strengthening clinical outcomes through annual facility-specific risk assessments and mock surveys to ensure high standards of clinical consistency.

    Competitive Edge in the Behavioral Health Market:
    Acadia leverages several factors for its competitive advantage:

    • Extensive Scale and Geographic Reach: Its widespread national footprint allows broad patient reach and operational efficiencies.
    • Diversified Continuum of Care: Offers a full range of services tailored to varying patient needs.
    • Strategic Joint Ventures: Partnerships with leading health systems enable expansion into new markets with favorable reimbursement environments. As of Q2 2025, Acadia had 21 joint venture partnerships for 22 hospitals.
    • Focus on Clinical Quality and Outcomes: A stated commitment to high-quality care differentiates Acadia.
    • Operational Efficiency and Technology Investment: Focus on driving efficiency and investing in technologies like patient safety tools.
    • Experienced Management: Benefits from an executive management team with extensive healthcare industry experience.

    While facing challenges like weaker Medicaid volumes and significant capital expenditures, Acadia's disciplined growth, continuous network investment, and focus on integrated, high-quality care position it as a leading force in the evolving behavioral health market.

    8. Competitive Landscape

    Today's date is 10/2/2025. Acadia Healthcare Company (NASDAQ: ACHC) operates within a growing, yet challenging, behavioral healthcare market. The U.S. behavioral health market was valued at approximately $92.2 billion in 2024 and is projected to reach $96.9 billion in 2025, with anticipated growth to $151.62 billion by 2034, at a CAGR of 5.1%. This growth is fueled by rising mental health needs, increased substance use, expanded access to care, and greater awareness. However, the market also faces competitive pressures, regulatory risks, and staffing shortages.

    Acadia Healthcare (ACHC) Overview and Operational Scale:
    Acadia is a leading provider of behavioral healthcare services across the United States. As of December 31, 2024, Acadia operated 262 behavioral healthcare facilities with approximately 11,850 beds in 39 states and Puerto Rico. By Q1 2025, this grew to 270 facilities and approximately 12,000 beds. Acadia is considered the largest stand-alone behavioral healthcare company in the U.S., serving over 80,000 patients daily with approximately 25,500 employees. Acadia's trailing 12-month revenue as of June 30, 2025, was $3.23 billion, with Medicaid being a significant revenue source (56.5% of 2024 revenue). In 2024, Acadia achieved its largest bed expansion in company history, adding 776 beds, and continued this expansion in Q1 2025 by adding 378 beds.

    Key Industry Rivals and Operational Scale:
    The behavioral healthcare industry is highly competitive. Key rivals include:

    • Universal Health Services, Inc. (UHS): A major player operating 29 acute care hospitals and 331 behavioral health inpatient facilities across 39 U.S. states, Washington D.C., Puerto Rico, and the United Kingdom as of April 29, 2025. UHS reported $15.8 billion in revenues in 2024.
    • HCA Healthcare, Inc.: Primarily focused on general healthcare, but its behavioral health services create competition.
    • Tenet Healthcare Corporation: A diversified healthcare services company with numerous hospitals and outpatient facilities, also competing in behavioral health.
    • Other Notable Competitors: Behavioral Health Group, Inc., Epic Health Services (Aveanna Healthcare), Ardent Health Services & CRC Health Group, IBH Population Health Solutions, CuraLinc Healthcare, North Range Behavioral Health, and Promises Behavioral Health. Many smaller, fast-growing companies also exist.

    Direct market share data for the behavioral health segment of these large diversified companies is not readily available, but Acadia is recognized as the largest pure-play behavioral healthcare provider.

    Acadia's Competitive Strengths:

    • Strong Market Position and Extensive Network: Leading provider with a vast network of facilities (270 facilities, ~12,000 beds as of Q1 2025) across a wide geographic presence.
    • Diverse Service Offerings: Comprehensive range of services, including inpatient psychiatric care, addiction recovery (largest methadone-clinic chain), residential treatment, and outpatient programs.
    • Strategic Growth through Expansion and Joint Ventures: Proactive strategy of expanding bed count, opening new facilities, and engaging in joint ventures with reputable health systems.
    • Focus on Quality Care: Emphasizes delivering high-quality treatment and care, contributing to a strong brand reputation.

    Acadia's Competitive Weaknesses:

    • Rising Operating Expenses: Increased operating expenses, particularly in salaries, wages, and benefits, due to a tight labor market and wage inflation.
    • Slower Patient Volumes and Reduced EBITDA Guidance: Experienced slower patient volumes in 2025, especially in Medicaid for its acute line of business, leading to reduced EBITDA guidance.
    • Legal and Regulatory Risks: Ongoing legal challenges and potential for increased regulatory scrutiny. Weaker Medicaid volumes are a specific challenge.
    • Leadership Uncertainty: Recent departure of the CFO creates uncertainty.
    • Long Ramp-up Periods for New Facilities: New facilities typically take about five years to reach run-rate occupancy and EBITDA margin.
    • Underperforming Facilities: Acadia is addressing underperformance and has decided to close some facilities.

    In response, Acadia is implementing a strategic shift, including pausing several capital expenditure projects to lower 2026 CapEx by at least $300 million, while still planning to add 500-700 beds in 2026, aiming to improve EBITDA growth and free cash flow generation.

    9. Industry and Market Trends

    Today's date is 10/2/2025. Acadia Healthcare Company (NASDAQ: ACHC) operates within a dynamic healthcare landscape characterized by significant growth in behavioral health demand, evolving macroeconomic pressures, persistent staffing challenges, and strategic shifts within the company to optimize its market position.

    Sector-Level Trends in Behavioral Health:
    The U.S. behavioral health market is experiencing robust growth, with a projected compound annual growth rate (CAGR) of 6.4% from 2025 to 2034, reaching an estimated $165.4 billion by 2034.

    • Increasing Demand and Awareness: A significant portion of the population experiences mental or substance use disorders, driving sustained demand for care. Declining stigma, especially among younger demographics, further fuels this trend.
    • Integrated Care Models: The industry is moving towards integrated approaches connecting behavioral and physical health.
    • Digital Transformation and AI: Technology, including AI for predictive analytics and automated triage, and telehealth for increased access, is reshaping care delivery.
    • Shift to Lower-Cost Settings: An accelerating trend from facility-based care to home-based and outpatient settings, driven by technology and consumer demand.

    Acadia is well-positioned, with its largest bed expansion in history in 2024 and continued additions in 2025 and 2026 through new facilities and joint ventures.

    Macro Drivers:

    • Rising Healthcare Costs and Inflationary Pressures: Healthcare costs are projected to increase, attributed to inflation, increased utilization, and chronic disease prevalence. Providers face pressure to cut costs.
    • Regulatory and Policy Uncertainty: Potential changes from recent elections, including a new administration's agenda, could significantly impact the industry. Medicaid enrollment declines due to eligibility redeterminations, and potential cuts starting in 2028 are concerns for Acadia. However, favorable benefits from state supplemental programs have been noted.
    • Cost-Cutting and Operational Efficiency: Driven by financial pressures, providers focus on streamlining operations and leveraging technology.
    • Private Equity Investment: Increased private equity activity in healthcare, including behavioral health, due to factors like lower interest rates.

    Supply Chain Considerations: Staffing:
    The healthcare industry, particularly behavioral health, faces severe staffing shortages.

    • Widespread Shortages: Significant shortfalls across various professions, with behavioral health specialties especially affected.
    • Burnout and Turnover: High rates of burnout contribute to staff exodus.
    • Impact on Capacity and Access: Shortages limit facility capacity and lead to long wait times.
    • Mitigation Strategies: Organizations invest in professional development, international recruitment, and partnerships with educational institutions. AI is also explored to support clinicians.

    Acadia's bed expansion increases its demand for qualified staff, making these trends highly relevant.

    Cyclical Effects:

    • Economic Resilience but Financial Strain: Healthcare is defensive, but macroeconomic challenges like inflation can still create financial pressure.
    • Acadia's Profitability Outlook: Acadia anticipates a hit to profitability in 2025 due to startup costs from bed expansion, but expects earnings and cash flow to rebound in 2026.
    • Medicaid Volume Fluctuations: Acadia has reported weaker Medicaid volumes, indicating sensitivity to government programs and economic conditions.
    • Capital Expenditure Adjustments: Acadia plans to reduce CapEx by at least $300 million in 2026, pausing projects and closing underperforming facilities to improve financial performance.

    Overall, Acadia is navigating expansion and strategic adjustment in a behavioral health market with strong demand but facing workforce shortages, evolving regulations, and the need for operational efficiency.

    10. Risks and Challenges

    Today's date is 10/2/2025. Acadia Healthcare Company (NASDAQ: ACHC), a prominent provider of behavioral healthcare services in the U.S., faces a complex array of risks and challenges. These encompass significant operational hurdles, heightened regulatory scrutiny, ongoing controversies surrounding patient care and billing, and various market pressures.

    Operational Risks:

    • Staffing Shortages and Rising Labor Costs: Persistent tight labor market and wage inflation impact cost structure and profitability.
    • Integration of Acquisitions and De Novo Facilities: Risks in successfully integrating new operations and realizing anticipated benefits. New bed additions are not expected to break even until early 2026.
    • Underperforming Facilities and Closures: Strategic adjustments include closing five underperforming facilities (e.g., Timberline Knolls) and reviewing others.
    • Technology and Cybersecurity Risks: Potential disruptions to IT systems or cybersecurity incidents. Acadia is investing $100 million in new technology.
    • Increased Medical Malpractice Costs: Incurred a $14 million charge in 2024, with an additional $10 million projected for 2025.
    • Negative Free Cash Flow: Aggressive capital expenditure has resulted in negative free cash flow, raising liquidity concerns. Acadia aims for positive cash flow by end of 2026.

    Regulatory Risks:

    • Government Investigations and Subpoenas: Under investigation by the U.S. Department of Justice (DOJ) and the Securities and Executive Commission (SEC) concerning admissions, length-of-stay, and billing practices.
    • False Claims Act Settlements: In September 2024, Acadia paid $19.85 million to resolve allegations of billing for medically unnecessary services.
    • Changes in Healthcare Policy and Reimbursement: Shifts in Medicare and Medicaid policies threaten revenue. The "One Big Beautiful Bill Act" (OBBBA), enacted July 4, 2025, is projected to cut federal Medicaid funding, potentially reducing patient volumes and payments.
    • Lobbying Activities: Actively lobbied against proposals to expand access to methadone treatment, protecting its methadone clinic chain.

    Ongoing Controversies:

    • Allegations of Medically Unnecessary Patient Detention and Billing Fraud: A New York Times report (September 2024) alleged routine detention of patients longer than necessary and inflated symptoms for reimbursement.
    • Quality of Care and Patient Safety Concerns: Numerous accusations of inappropriate behavior, patient abuse, assaults, and suicides due to alleged inadequate staffing and supervision. Closure of Timberline Knolls followed abuse allegations.
    • Falsified Medical Records: A December 2024 New York Times investigation alleged falsified medical records at methadone facilities.
    • Negative Impact on Patient Volume: Negative publicity and investigations contributed to lower patient volume growth and revised financial guidance.

    Market Risks:

    • Competitive Landscape: Highly competitive market with rivals like Universal Health Services, Tenet Healthcare, and emerging telehealth providers.
    • Reimbursement Challenges: Reductions in payments from commercial payors and persistent Medicaid challenges.
    • Economic Downturns: Broader economic disruptions can impact admissions, volumes, and increase costs.
    • Investor Sentiment and Stock Performance: Legal scrutiny, controversies, and revised guidance have eroded investor confidence, leading to substantial stock price decline.
    • High Debt Levels: Net debt-to-EBITDA ratio of 4.26x poses refinancing and interest payment risks.
    • Shareholder Activism: Activist investors demand strategic changes, including a potential sale.
    • Revised Financial Guidance: Lowered full-year 2024 and 2025 outlook due to slower patient day growth and negative publicity.

    11. Opportunities and Catalysts

    Today's date is 10/2/2025. Acadia Healthcare Company (NASDAQ: ACHC) is a significant player in the behavioral healthcare sector, operating a network of 274 facilities with approximately 12,100 beds across 39 states and Puerto Rico as of June 30, 2025. The company's opportunities and catalysts for growth are multifaceted, though it faces challenges and increasing pressure from activist investors.

    Growth Levers and New Markets:
    Acadia's primary growth strategy involves expanding capacity and enhancing service offerings through bed additions and new facility development, often via joint ventures.

    • Bed Expansion: Aggressive expansion, with approximately 1,300 beds added in 2024, 1,800 projected for 2025, and an additional 500-700 planned for 2026.
    • Joint Ventures (JVs): Partnerships with health systems are key to expansion. As of August 2025, Acadia has 21 JV partnerships for 22 hospitals, with 13 operational and nine more expected to open, including new facilities with ECU Health, SolutionHealth, Orlando Health, Tufts Medicine, Henry Ford Health, Geisinger Health, and Ascension.
    • Comprehensive Treatment Centers (CTCs): Continuous expansion of its network of CTCs for opioid use disorder, adding four new CTCs in Q2 2025, reaching 174 CTCs across 33 states, treating over 74,000 patients daily.
    • Addressing Unmet Demand: Long-term positive outlook due to significant unmet demand for behavioral health services, with a goal to double revenue by 2028.

    M&A Potential:
    While historically active in acquisitions, the near-term M&A strategy may be shifting.

    • Activist Investor Pressure: Khrom Capital Management (5.5% stake) and Engine Capital are urging Acadia's Board to explore strategic alternatives, including a potential sale of the business or divestiture of assets like the CTC service line, to maximize shareholder value.
    • Strategic Review: This pressure could be a catalyst for a formal strategic review, potentially leading to significant M&A activity.
    • Deutsche Bank's View: ACHC is on Deutsche Bank's "Conviction List" for Q4 2025, expecting outperformance due to activist pressure to reduce the discount to intrinsic value.
    • Shifting Focus: Experts suggest Acadia is unlikely to pursue large acquisitions immediately due to its share price decline and ongoing investigations, instead focusing on optimizing its existing portfolio.

    Near-Term Events & Catalysts (as of 10/2/2025):

    • Q3 2025 Earnings: Scheduled around October 29-30, 2025, providing insights into current performance, especially regarding Medicaid volumes and cost-cutting measures.
    • Capital Expenditure Reduction: Plans to reduce CapEx by at least $300 million in 2026, aiming to improve free cash flow.
    • Facility Closures: Closure of five underperforming facilities and monitoring of others to optimize resource allocation.
    • New Facility Openings: Several new joint venture hospitals are expected to open in the coming years, including three later in 2025.
    • Policy Changes and Industry Trends:
      • Increased Demand for Behavioral Healthcare: Ongoing growth in demand.
      • Telehealth Expansion: Permanent extension of Medicare telehealth services for behavioral/mental health, and new Medicare coverage for digital mental health devices in 2025.
      • Integrated Care Models & Value-Based Care: Growing focus on integrated care and value-based models.
      • Medicaid Funding and Policy: Manageable impact from "One Big Beautiful Bill Act" due to carve-outs and extended timelines, with favorable supplemental payments in Tennessee.
      • SUPPORT for Patients and Communities Reauthorization Act of 2025: Reauthorization of federal support for addiction and mental illness programs through 2030.
      • AI Integration: AI-driven tools expected to play a larger role.
    • Legal Investigations: Ongoing DOJ and SEC investigations, with legal fees totaling $84.5 million in H1 2025.
    • Leadership Transition: Ongoing CFO search.
    • Share Repurchase Program: Authorized up to $300 million in February 2025.

    In summary, Acadia is focused on disciplined organic growth, capitalizing on increasing demand, but navigating challenges related to underperforming facilities, rising startup costs, and weaker Medicaid volumes, alongside significant activist investor pressure. Upcoming Q3 earnings and updates on strategic reviews and investigations will be key catalysts.

    12. Investor Sentiment and Analyst Coverage

    Today's date is 10/2/2025. Investor sentiment and analyst coverage for Acadia Healthcare Company (NASDAQ: ACHC) present a mixed but generally optimistic outlook, significantly influenced by recent activist investor engagement.

    Wall Street Ratings and Price Targets:
    Acadia Healthcare currently holds a consensus "Buy" or "Moderate Buy" rating from Wall Street analysts. Approximately 26 analysts provide coverage, with 31% recommending a "Strong Buy," 42% a "Buy," and 27% suggesting a "Hold" rating, with no analysts advising "Sell" or "Strong Sell" as of October 1, 2025.

    The average 12-month price target generally falls between $27.09 and $51.19. Some analysts have set a target of $51.19, while others report a consensus of $39.00 (50.5% upside from ~$25.91). Zacks Investment Research indicates an average of $30.29 from 14 analysts, with a range from $20.00 to $55.00. Recent analyst actions (August-September 2025) show some adjustments: Guggenheim cut its target to $29.00 (maintaining "buy"), Mizuho reduced its target to $22.00 (setting "neutral"), and UBS Group lowered its price objective to $31.00 (maintaining "buy"). Deutsche Bank has a $36.00 price target, expecting outperformance due to activist pressure. These adjustments reflect a more nuanced view, with some firms lowering expectations despite generally positive ratings.

    Hedge Fund Activity and Institutional Investor Moves:
    As of June 2025 (Q2 2025 filings), major institutional shareholders include BlackRock Inc., Vanguard Group Inc., Wellington Management Company, and FMR LLC. Several institutions adjusted holdings in Q1 and Q2 2025, with some increasing positions significantly (e.g., UMB Bank n.a. by 149.5% in Q1). Overall, hedge funds increased their holdings by 3.3 million shares in the latest quarter.

    A significant recent development is the emergence of activist investors. On September 24, 2025, Engine Capital reportedly built an approximately 3% stake and is advocating for substantial changes, including a board refresh, portfolio review, and a halt to capital-intensive projects, criticizing the company's "growth at any cost" approach. On October 1, 2025, Khrom Capital Management LLC (5.5% stake) sent its own letter to the Board, urging a formal review of strategic alternatives, including a sale, citing "persistent underperformance, poor capital allocation, misaligned executive incentives, governance failures, and lack of accountability."

    Retail Investor Chatter:
    Retail investor sentiment on platforms like StockTwits shows a "Bullish" indication as of October 2025. However, past retail chatter includes significant negative sentiment following a September 2024 New York Times report, widely discussed on Reddit, alleging patient detention and exaggerated symptoms for insurance payouts. Such allegations can influence retail investor perception over time.

    Significant Shifts or Divergence in Opinions:
    The most significant shift comes from the public actions of activist hedge funds.

    • Divergence from Management: Activist investors are openly critical of current management's strategy, capital allocation, and governance, pushing for a fundamental shift, including a potential sale, contrasting with Acadia's official statements.
    • Mixed Analyst Views: While the consensus is largely positive, there's a clear divergence in individual price targets and recent downgrades, reflecting concerns over Medicaid cuts and execution issues.
    • Institutional vs. Activist Focus: High institutional ownership exists, but activist involvement highlights a segment believing the company is "deeply undervalued" and requires drastic changes.
    • Retail Concerns: Past allegations could create lingering ethical concerns among retail investors.

    In summary, while traditional analyst ratings are generally positive, the recent and vocal demands from activist investors introduce a strong element of dissent regarding current management and strategy. This pressure, coupled with adjusted analyst price targets, indicates a period of potential strategic change and a divergence of opinions on Acadia's future path.

    13. Regulatory, Policy, and Geopolitical Factors

    Today's date is 10/2/2025. Acadia Healthcare Company (NASDAQ: ACHC) operates within a dynamic regulatory, policy, and geopolitical landscape, marked by significant legislative shifts, persistent compliance demands, varied government incentives, and emerging global risks. The company faces both opportunities from increased focus on behavioral health and challenges stemming from evolving regulations and economic pressures.

    1. Relevant Laws and Regulations:

    • Mental Health Parity and Addiction Equity Act (MHPAEA): New federal rules finalized in September 2024 (effective Jan 1, 2025) aimed to toughen enforcement, but enforcement was paused on May 12, 2025, due to legal challenges. States are increasingly requiring insurers to report provider reimbursement rates.
    • Affordable Care Act (ACA): Expanded behavioral health coverage. However, potential expiration of enhanced premium tax credits at the end of 2025 could lead to millions losing affordable coverage. The "One Big Beautiful Bill Act" (OBBBA), passed July 4, 2025, projects a 15% cut to federal Medicaid funding, potentially impacting 11.8 million individuals and threatening access to care.
    • Health Insurance Portability and Accountability Act (HIPAA): Critical for patient privacy and data protection, with 2025 compliance increasingly linked to cybersecurity and operational risk management.
    • Telehealth Regulations: Some flexibilities made permanent, but others expired on September 30, 2025. Beginning October 1, 2025, Medicare patients must have an in-person mental health visit within six months prior to their first telehealth service, and annually thereafter.
    • SUPPORT for Patients and Communities Reauthorization Act of 2025: Bipartisan bill reauthorizes federal support for addiction and mental illness prevention, treatment, and recovery through 2030.

    2. Compliance Challenges:

    • Governmental Investigations and Regulatory Scrutiny: Acadia is under investigation by the DOJ and SEC related to admissions, length-of-stay, and billing practices. In September 2024, Acadia paid $19.84 million to settle SEC allegations of false billing. Allegations of detaining patients against their will and falsifying medical records persist.
    • Cybersecurity and Data Privacy: Intensified scrutiny over data privacy and cybersecurity, requiring robust HIPAA implementation and continuous investment in security measures.
    • Documentation and Telehealth Protocol: Evolving regulations demand more rigorous documentation for behavioral health services, especially telehealth, for heightened audit scrutiny.
    • Workforce Shortages: Persistent staffing shortages in behavioral healthcare contribute to burnout, long waitlists, and impact quality of care.
    • Medicaid and ACA Marketplace Changes: Potential cuts from OBBBA and expiration of ACA subsidies create financial and operational challenges.

    3. Government Incentives:

    • Medicaid Supplemental Payments: Acadia's 2025 guidance includes an expected net increase in supplemental payments, notably from a new Tennessee program.
    • Federal Funding for Behavioral Health: Continued investment, with the SUPPORT Act reauthorization and increased SAMHSA budget for initiatives like Certified Community Behavioral Health Clinics (CCBHCs).
    • Opioid Crisis Initiatives: State Opioid Response (SOR) grants and legislation simplifying reimbursement for integrated treatments.
    • State-Level Incentives: Some states offer incentives for behavioral healthcare professionals in underserved areas.
    • Increased Inpatient Payment Rates: CMS will increase inpatient payment rates for behavioral health facilities by 2.8% for 2025.

    4. Geopolitical Risks and Opportunities:

    • Cybersecurity Threats: Geopolitical tensions and state-sponsored cyber gangs pose increasing cybersecurity risks to healthcare.
    • Supply Chain Vulnerabilities: Global instability, trade wars, and conflicts can disrupt supply chains for medical equipment and pharmaceuticals.
    • Economic Instability: Geopolitical events can contribute to global economic downturns, affecting consumer spending, insurance coverage, and government funding.
    • Policy Advocacy: Acadia's active lobbying against certain policies demonstrates its engagement in shaping the policy landscape.

    In summary, Acadia in late 2025 is navigating a complex regulatory environment with both stricter enforcement (though some is paused) and potential setbacks. Compliance with telehealth rules and data privacy is paramount. While government incentives exist, the overarching economic and policy climate, influenced by domestic political shifts and indirect geopolitical risks, presents both opportunities for growth in a high-demand sector and significant operational and financial challenges.

    14. Outlook and Scenarios

    Today's date is 10/2/2025. Acadia Healthcare (NASDAQ: ACHC), a prominent provider of behavioral healthcare services, faces a mixed but generally optimistic outlook. The company is navigating a complex landscape characterized by surging demand for mental health services, strategic shifts in its operational approach, and ongoing financial and regulatory pressures. While analyst sentiment remains cautiously optimistic, recent performance has presented challenges, particularly in Medicaid volumes and increased startup costs.

    Short-Term Projections (Remainder of 2025 and Early 2026):
    In the short term, Acadia is expected to continue its strategic pivot. Management has acknowledged a challenging 2025 due to weaker Medicaid volumes (acute line of business) and incremental weakness in Q3 2025. Startup losses are anticipated to be higher, projected at $60 million to $65 million for the full year 2025, an increase of $10 million due to faster-than-expected bed openings. Acadia revised its full-year 2025 adjusted EBITDA guidance to $675 million to $700 million, citing lower expected volume growth and higher startup costs, partially offset by increased supplemental payments. Same-facility volume growth is now expected to be in the 2% to 3% range. In response, Acadia plans to reduce capital expenditures (CapEx) by at least $300 million in 2026 compared to 2025 levels ($600 million to $650 million guidance). The company also intends to close five underperforming facilities and monitor others, aiming to demonstrate stronger free cash flow and regain investor confidence.

    Long-Term Projections (2026 and Beyond):
    Acadia's management expresses optimism for improved performance beyond 2025. Significant volume growth is expected from recent and planned bed additions, with an additional 500 to 700 new beds in 2026. Management anticipates strong EBITDA growth and improved free cash flow generation in 2026 and 2027 as new beds ramp up and startup costs decline. For the three-year period beginning 2026, Acadia projects average annual revenue growth of 7% to 9% and average annual adjusted EBITDA growth of 8% to 10%, underpinned by annual bed additions of 600 to 800 beds per year starting in 2026. The broader U.S. behavioral health market is poised for steady growth, reaching an estimated $151.62 billion by 2034, expanding at a CAGR of 5.1%.

    Strategic Pivots and Initiatives:
    Acadia's strategic plan for 2025 and beyond emphasizes expanding access through:

    • Capacity Expansion: Aggressively adding beds (nearly 1,800 between 2024-2025, 500-700 more in 2026).
    • Joint Ventures (JVs): Continued pursuit of JVs with major health systems in favorable reimbursement environments.
    • Portfolio Optimization: Closing underperforming facilities and a more measured approach to capital allocation.
    • Technology Adoption: Leveraging AI and telehealth to improve patient care and operations.
    • Revenue Diversification: Across treatment settings and payers to mitigate risk.

    Market Conditions:
    The behavioral healthcare market exhibits robust demand, driven by increasing awareness and acceptance. The U.S. market is expected to reach $165.4 billion by 2034 (6.4% CAGR). Integrated care expansion, including Certified Community Behavioral Health Clinics (CCBHCs), is gaining traction. However, the sector also faces challenges such as rising costs, regulatory volatility, and funding risks, including potential Medicaid cuts.

    Potential Catalysts and Risks:

    Bull Case Scenarios:

    • Successful Execution of Strategic Pivots: Effective cost management, bed additions, and JVs significantly improve EBITDA and free cash flow.
    • Strong Demand & Market Growth: Sustained high demand drives patient volumes and revenue.
    • Favorable Regulatory Environment: Policy changes and continued telehealth adoption create opportunities.
    • Technological Advancement: AI-driven efficiency and improved care delivery enhance performance.
    • Acquisitions: Strategic acquisitions remain a growth pathway.

    Bear Case Scenarios:

    • Medicaid Volume Weakness and Reimbursement Pressures: Continued weakness and potential cuts significantly impact revenue.
    • Operational Challenges and Higher Startup Costs: Elevated startup losses and underperforming facilities compress margins.
    • Regulatory Scrutiny and Investigations: Ongoing federal investigations and negative publicity continue to affect performance.
    • Workforce Shortages and Rising Labor Costs: Increased labor costs and operational inefficiencies due to staffing issues.
    • Increased Competition: Inability to adapt to competitive pressures.
    • Shareholder Activism: Instability from activist investors pushing for strategic reviews or sale.
    • Debt Burden: Challenges in managing significant debt.

    Analyst Sentiment and Price Targets:
    Analysts have a "Buy" or "Moderate Buy" consensus rating for ACHC, with an average price target ranging from $27.00 to $51.19, implying potential upside. However, some have recently downgraded ratings or cut targets due to concerns over Medicaid cuts and execution issues.

    Overall, Acadia Healthcare is at a pivotal point, balancing significant market demand and strategic expansion with operational challenges, regulatory uncertainties, and investor pressure. The company's ability to navigate regulatory challenges, appease activist shareholders, and successfully execute its refined growth and efficiency strategies will determine its trajectory in the evolving behavioral healthcare market.

    15. Conclusion

    Today's date is 10/2/2025. Acadia Healthcare Company (NASDAQ: ACHC) stands as a prominent and expanding force in the U.S. behavioral healthcare sector, operating a vast network of facilities dedicated to mental health and addiction treatment. The company is navigating a complex and dynamic environment, marked by both significant opportunities for growth and substantial challenges that warrant close investor attention.

    Summary of Key Findings:
    Acadia's business model is robust, centered on providing a comprehensive continuum of behavioral health services across a diverse facility network and patient demographic. Its strategic focus on capacity expansion, particularly through de novo facilities and joint ventures with health systems, positions it to capitalize on the increasing demand for behavioral healthcare. However, recent financial performance has shown mixed results, with strong revenue growth in Q2 2025 offset by declining net income and ongoing startup losses from new facilities. The company carries a significant debt burden and has experienced negative free cash flow.

    A critical development is the emergence of activist investors, including Khrom Capital Management and Engine Capital, who are publicly advocating for a formal review of strategic alternatives, including a potential sale of the company. These investors cite persistent underperformance, poor capital allocation, and governance issues. In response, Acadia has announced a strategic pivot, including a substantial reduction in 2026 capital expenditures and the closure of underperforming facilities, signaling a shift towards prioritizing cash flow and operational efficiency over aggressive expansion.

    The regulatory landscape is complex, with ongoing federal investigations by the DOJ and SEC concerning billing practices and patient care. Past settlements for false claims and allegations of patient mistreatment have impacted the company's reputation and financial outlook. Furthermore, potential changes in Medicaid funding, particularly from the "One Big Beautiful Bill Act," pose a long-term risk to reimbursement and patient volumes, although Acadia anticipates mitigating factors. The industry also grapples with persistent staffing shortages and rising labor costs.

    Balanced Perspective:
    The investment case for Acadia Healthcare presents a duality. On the bullish side, the fundamental demand for behavioral health services is strong and growing, providing a resilient market backdrop. Acadia's extensive network, diversified service offerings, and strategic joint ventures offer a solid foundation for long-term growth. The company's proactive adjustments to its capital allocation strategy and focus on operational efficiency could lead to improved profitability and free cash flow in 2026 and beyond.

    Conversely, the bear case highlights significant risks. The pressure from activist investors creates uncertainty regarding the company's future strategic direction and leadership. Ongoing federal investigations and past controversies surrounding patient care and billing practices pose reputational and financial risks. The high debt levels, coupled with current negative free cash flow, demand careful management. Moreover, potential changes in government reimbursement policies, particularly for Medicaid, could materially impact revenue and margins.

    What Investors Should Watch:
    Near Term (Next 6-12 months):

    • Q3 2025 Earnings Report: This will provide crucial insights into the immediate impact of strategic adjustments, Medicaid volumes, and cost-cutting measures.
    • Activist Investor Developments: Monitor any further actions by Khrom Capital and Engine Capital, including potential board changes or formal strategic reviews.
    • Impact of CapEx Reductions: Assess how the planned reduction in 2026 capital expenditures affects growth initiatives and translates into improved free cash flow.
    • Regulatory and Legal Outcomes: Any new developments or resolutions in the ongoing federal investigations and lawsuits will be critical.

    Long Term (1-3+ years):

    • Execution of Revised Strategy: Evaluate the success of Acadia's refined growth strategy, including the ramp-up of new facilities and joint ventures, and whether the company achieves self-sustaining free cash flow by late 2026.
    • Talent Management: The ability to attract and retain qualified behavioral health professionals will be paramount for sustained growth and quality of care amidst industry-wide shortages.
    • Reimbursement Environment Evolution: Long-term policy changes related to Medicare and Medicaid, and the effectiveness of Acadia's advocacy efforts, will significantly influence future revenue streams.
    • Innovation and Technology Adoption: Acadia's ability to leverage technology for improved care delivery and operational efficiency will be key to maintaining a competitive edge.

    Acadia Healthcare is at a pivotal juncture. Its capacity to navigate regulatory challenges, appease activist shareholders, and successfully execute its refined growth and efficiency strategies will determine its trajectory in the evolving behavioral healthcare market.


    This content is intended for informational purposes only and is not financial advice

  • Occidental Petroleum (OXY/NYSE): Navigating the Energy Transition with a Strategic Pivot

    Occidental Petroleum (OXY/NYSE): Navigating the Energy Transition with a Strategic Pivot

    Occidental Petroleum (NYSE: OXY) is a prominent international energy company currently undergoing a significant strategic transformation, with its recent activities and future direction heavily in focus as of October 2, 2025. Headquartered in Houston, Texas, Occidental is primarily engaged in the acquisition, exploration, and development of oil and gas properties across the United States, including major operations in the Permian Basin, DJ Basin, and the offshore Gulf of Mexico, as well as in the Middle East, North Africa, and Latin America.

    In addition to its traditional energy business, Occidental is also a leader in carbon management and sustainability. Through its subsidiary, Oxy Low Carbon Ventures (OLCV), the company is heavily investing in carbon capture, utilization, and storage (CCUS) technologies with a goal to achieve net-zero emissions in its operations by 2050. Occidental has over 50 years of experience in injecting and storing CO2 in geologic reservoirs, currently storing up to 20 million tons of CO2 per year, predominantly from natural sources.

    Occidental Petroleum is significantly in focus on October 2, 2025, due to a major strategic divestiture and its ongoing efforts to manage its debt and reshape its business. The definitive agreement to sell its entire chemical business, OxyChem, to Warren Buffett's Berkshire Hathaway Inc. for $9.7 billion in an all-cash transaction, expected to close in the fourth quarter of 2025, represents a pivotal moment. This move is primarily driven by Occidental's commitment to substantially reduce its significant debt load, accumulated following major acquisitions like the $38.7 billion takeover of Anadarko Petroleum in 2019 and the $12 billion acquisition of Permian producer CrownRock, completed in August 2024. CEO Vicki Hollub has stated that with this sale, Occidental is "done with big deals," indicating a strategic shift towards consolidating its current assets and focusing on organic growth, primarily within its upstream oil and gas operations and low-carbon ventures.

    2. Historical Background

    Occidental Petroleum, often referred to as Oxy, has a rich and dynamic history marked by strategic expansion, diversification, and significant transformations that have shaped it into a major global energy company.

    Occidental Petroleum Corporation was founded in Los Angeles, California, in 1920. In its nascent years, the company was a small, largely unremarkable oil exploration venture primarily focused on domestic oil exploration and production in California. Its early operations were centered on capitalizing on the burgeoning California oil fields. For many years, Occidental remained a small and often unprofitable driller, to the point of being nearly bankrupt by the mid-1950s.

    A pivotal moment arrived in 1957 when Armand Hammer, a successful international businessman, acquired a controlling interest and was appointed president and CEO. Hammer initially viewed the struggling company as a potential tax shelter. However, his plans quickly changed when Occidental's rigs struck a rich crude oil deposit in southern California, marking the beginning of a transformative era for the company.

    Under Armand Hammer's leadership, Occidental Petroleum began a period of rapid growth and diversification:

    • 1959: Occidental acquired the Gene Reid Drilling Company of Bakersfield, California, which led to the company being listed on the American Stock Exchange.
    • 1961: The company achieved a significant breakthrough with the discovery of a substantial natural gas deposit in the Lathrop field near Stockton, northern California.
    • 1964: Occidental Petroleum was listed on the New York Stock Exchange.
    • 1966: Occidental's potential dramatically increased with a billion-barrel oilfield discovery in Libya, greatly enhancing its international stature.
    • 1967: Hammer personally secured an oil concession from Libya, propelling "Oxy" into a major international oil company.
    • 1968: Diversifying its business segments, Occidental entered the chemical industry with the acquisition of Hooker Chemicals.

    Occidental Petroleum's history since its early successes is characterized by strategic acquisitions, divestitures, international expansion, and significant shifts in its core business focus. The 1960s-1980s saw aggressive diversification into coal mining, chemical manufacturing, and even meatpacking. Notable acquisitions included Cities Service Company (1982) and Cain Chemical (1988), solidifying its chemical presence with Occidental Chemical Corporation (OxyChem) in 1987.

    The post-Hammer era (1990s-early 2000s) under Ray R. Irani focused on debt reduction and a return to profitable oil and gas production. This involved divesting non-core assets and acquiring large, long-lived oil and gas assets, such as the Elk Hills Naval Petroleum Reserve (1997/1998) and Altura Energy Ltd. (2000), making it the largest oil producer in Texas.

    The 21st century brought continued growth and a growing focus on sustainability. Acquisitions like Vintage Petroleum (2005) and Permian Basin assets from Freeport-McMoRan (2016) strengthened its upstream portfolio. The transformative $38 billion acquisition of Anadarko Petroleum in 2019 significantly expanded its Permian footprint but also increased debt, leading to subsequent asset sales. In the 2020s, Occidental has increasingly focused on sustainability and carbon management, aiming for net-zero emissions by 2050. Key moves include the acquisition of Carbon Engineering (2023), CrownRock (2024), and most recently, the sale of OxyChem to Berkshire Hathaway (October 2025), marking a strategic pivot to reduce debt and concentrate on its core oil and gas and carbon management businesses.

    3. Business Model

    As of October 2, 2025, Occidental Petroleum (OXY/NYSE) is strategically transforming its business model with a sharpened focus on its core oil and gas operations, significantly impacted by the announced sale of its chemical division, OxyChem, to Berkshire Hathaway for $9.7 billion. This divestment, expected to close in the fourth quarter of 2025, aims to reduce debt and streamline the company's portfolio, emphasizing its upstream capabilities and growing low-carbon ventures.

    Business Segments

    Following the divestment of OxyChem, Occidental Petroleum's business model will primarily operate through two main segments:

    1. Oil and Gas: This segment is central to Occidental's operations, focusing on the acquisition, exploration, development, and production of crude oil and condensate, natural gas liquids (NGLs), and natural gas. Occidental is one of the largest oil and gas producers in the U.S., with significant assets in the Permian and DJ basins, as well as offshore Gulf of Mexico. The company also maintains operations in the Middle East and North Africa.
    2. Midstream and Marketing: This segment provides crucial support to the upstream operations by purchasing, marketing, gathering, processing, transporting, and storing oil, condensate, NGLs, natural gas, carbon dioxide, and power. It plays a vital role in ensuring flow assurance and maximizing the value of Occidental's produced hydrocarbons. This segment also includes Oxy Low Carbon Ventures, which is dedicated to advancing technologies and business solutions to economically grow the business while reducing emissions.

    Historically, the Chemical segment (OxyChem) contributed significantly to revenue, accounting for approximately 18.4% of total revenue in the second quarter of 2025, while Oil & Gas made up 81.2% and Midstream & Marketing 3.6%. With the sale of OxyChem, the company's financial profile will become more reliant on cyclical oil prices, as noted by analysts.

    Revenue Sources and Product Lines

    Occidental's primary revenue sources will stem from the sale of:

    • Crude oil and condensate: Extracted from its oil and gas properties.
    • Natural Gas Liquids (NGLs): By-products of natural gas processing.
    • Natural Gas: Produced from its extensive reserves.
    • Midstream services: Fees and margins from the transportation, processing, and marketing of hydrocarbons and CO2.
    • Low-carbon solutions: Revenue generated from carbon capture, utilization, and storage (CCUS) projects, including direct air capture (DAC) technology and enhanced oil recovery (EOR) using CO2. Occidental sees its leadership in carbon management as a key differentiator and a means to unlock additional resources and deliver long-term value.

    Services

    Occidental's services primarily revolve around:

    • Exploration and Production (E&P): Locating, drilling, and extracting oil and natural gas.
    • Logistics and Marketing: Transportation, storage, and sale of crude oil, natural gas, and NGLs.
    • Carbon Management: Development and deployment of carbon capture technologies, including Direct Air Capture (DAC) and CO2 sequestration for enhanced oil recovery (EOR). This includes leveraging its industry-leading experience in EOR operations with CO2, which the company believes could recover an additional 50 billion to 70 billion barrels of oil in the United States.

    Customer Base

    Occidental Petroleum primarily serves a business-to-business (B2B) customer base.

    • Refineries: Major purchasers of crude oil for processing into various petroleum products.
    • Petrochemical Plants: Acquire NGLs and natural gas as feedstocks for chemical production.
    • Industrial Clients: Companies that purchase natural gas for energy generation and other industrial processes.
    • Emerging Carbon Management Clients: With its increasing focus on low-carbon ventures, Occidental is targeting industries and entities seeking carbon removal credits (CDRs) from DAC to address emissions related to their products or services.

    Occidental's strategic divestment of OxyChem signifies a deliberate shift to concentrate on its core upstream oil and gas business and accelerate debt reduction, while also significantly investing in and expanding its low-carbon technologies and services.

    4. Stock Performance Overview

    Occidental Petroleum (OXY/NYSE) has experienced a dynamic decade of stock performance, characterized by significant acquisitions, volatile commodity markets, and strategic shifts towards debt reduction and carbon management. As of October 2, 2025, the company's market capitalization is approximately $43.49 billion.

    1-Year Stock Performance (October 2, 2024 – October 2, 2025):

    Over the last 12 months, OXY's stock price has decreased by 9.99%, with a total return of -2.92%. Year-to-date in 2025, the stock has shown a return of -6.39%.

    • Notable Moves and Key Drivers:
      • CrownRock Acquisition (August 2024): Occidental acquired CrownRock for nearly $12 billion, largely funded by new debt. This significantly increased the company's debt burden and, combined with falling crude oil prices in late 2024, contributed to a 17.3% slump in 2024.
      • OxyChem Sale to Berkshire Hathaway (October 2025): On October 2, 2025, Occidental agreed to sell its OxyChem chemicals division to Berkshire Hathaway for $9.7 billion in cash. The stock experienced a significant drop (5.3% to 7.5%) on the news, as the market reacted to concerns regarding the timing and valuation of the sale.
      • Oil Price Fluctuations and Production: Brent and WTI oil prices were expected to average $60–$70 per barrel in 2025, but OPEC+ plans to increase supply and signs of cooling global demand have pressured revenues. In Q2 2025, average worldwide realized crude oil prices decreased by 10% from Q1 to Q2 2025, reaching $63.76 per barrel.
      • Debt Reduction Efforts: Throughout 2025, Occidental has continued to make progress on debt reduction, announcing additional divestitures and aiming to bring its principal debt below $15 billion after the CrownRock acquisition.

    5-Year Stock Performance (October 2, 2020 – October 2, 2025):

    Occidental Petroleum's stock has seen a substantial increase over the past five years, with a 5-year performance of +353.93% in price appreciation and a total return of 384.59%. A $1,000 investment five years ago would be worth approximately $4,845.86 today.

    • Notable Moves and Key Drivers:
      • Recovery from 2020 Lows: The period began shortly after the severe market downturn in early 2020. The stock subsequently experienced massive gains, including a 111.45% market cap increase in 2022 and a 67.97% increase in 2021, driven by a rebound in oil prices.
      • Commodity Price Surge (2021-2022): Global energy demand recovery and geopolitical events led to a significant surge in crude oil prices, directly boosting Occidental's revenue and profitability, enabling substantial debt reduction.
      • Warren Buffett's Investment: Warren Buffett's Berkshire Hathaway has been a consistent buyer of OXY shares, significantly increasing its stake to over 28% by mid-2025. This high-profile investment has often provided a "Buffett premium" to the stock.
      • Anadarko Debt Management: A major focus for Occidental since its 2019 acquisition of Anadarko Petroleum has been deleveraging, with significant strides made during this 5-year period, supported by strong free cash flow.

    10-Year Stock Performance (October 2, 2015 – October 2, 2025):

    Over the last ten years, a $1,000 lump sum investment in Occidental Petroleum would be worth approximately $947.28 today, representing a negative return of -5.27%, with an annualized return (CAGR) of -0.54%. The market cap decreased from $51.64 billion at the end of 2015 to $43.49 billion in October 2025.

    • Notable Moves and Key Drivers:
      • Oil Price Crashes and Volatility (2015-2020): This decade began with a significant downturn in oil prices, impacting the entire energy sector, including Occidental. The market also saw another crash in early 2020.
      • Anadarko Petroleum Acquisition (2019): Occidental's ~$55 billion acquisition of Anadarko Petroleum in 2019 was a transformative event, making it a major player in the Permian Basin but also significantly increasing its debt, which initially weighed heavily on the stock.
      • Strategic Repositioning: Post-Anadarko, Occidental focused on divesting non-core assets to pay down debt, a strategy that continued through this period.
      • Emergence of Carbon Capture Initiatives: Towards the latter half of the decade, Occidental became a leader in carbon capture and storage (CCS) and direct air capture (DAC) technologies through its Oxy Low Carbon Ventures subsidiary, aiming to diversify earnings and align with sustainability goals.

    In summary, Occidental Petroleum's stock performance over the past decade reflects a company navigating intense commodity market cycles and undertaking significant strategic shifts. While the 10-year performance shows a slight negative return, the 5-year period demonstrates a remarkable recovery and growth, largely driven by surging oil prices and strategic debt management. The most recent 1-year performance indicates some headwinds, including the impact of new acquisitions and the significant OxyChem divestiture, as the company continues to optimize its portfolio and address its debt profile.

    5. Financial Performance

    Occidental Petroleum (OXY/NYSE) has demonstrated a mixed financial performance in its recent reports, notably with the second quarter of 2025 results and strategic moves to reduce debt. As of October 2, 2025, the company is focused on deleveraging through asset sales while maintaining operational efficiency.

    Latest Earnings (Q2 2025)

    Occidental Petroleum announced its second-quarter 2025 financial results on August 6, 2025.

    • Reported Earnings Per Share (EPS): $0.26 per diluted share, falling short of the estimated $0.32 per share.
    • Adjusted Earnings Per Share (EPS): $0.39 per diluted share, surpassing analyst estimates.
    • Net Income: Attributable to common stockholders was $288 million for the second quarter of 2025.

    Revenue Growth

    Occidental Petroleum's revenue figures show some fluctuations.

    • Q2 2025 Revenue: Reported at $6.456 billion, exceeding the consensus estimate of $6.339 billion, but representing a 6.1% decrease year-over-year.
    • Trailing Twelve Months (TTM) Revenue: As of June 30, 2025, the TTM revenue stood at $27.15 billion, indicating a modest 0.1% increase year-over-year.
    • Annual Revenue (2024): The annual revenue for 2024 was $26.88 billion, marking a 7.05% decrease from 2023.
    • Q3 2025 Revenue Estimate: Analysts project Q3 2025 revenue to be around $6.59 billion.

    Margins

    Occidental Petroleum's profitability margins reflect its operational efficiency.

    • Operating Margin: For the trailing twelve months ending June 2025, the operating margin was 14.87%.
    • Net Margin: For the quarter ending June 30, 2025, the net profit margin was 6.21%. The current net profit margin of 6.4% is lower than the previous year's 13.6%.
    • Gross Profit Margin: The latest twelve months' gross profit margin is 63.9%. The quarterly gross profit margin for June 30, 2025, was 30.19%.

    Debt

    Debt reduction is a significant focus for Occidental Petroleum.

    • Total Debt: As of June 2025, the company's total debt was reported at approximately $24.17 billion USD.
    • Long-Term Debt: For the quarter ending June 30, 2025, long-term debt was $23.342 billion, a 26.93% increase year-over-year.
    • Debt Reduction Strategy: On October 2, 2025, Occidental announced an agreement to sell its OxyChem division to Berkshire Hathaway for $9.7 billion in cash. The company plans to allocate $6.5 billion of these proceeds to reduce its debt, targeting a total principal debt level below $15 billion. This transaction is anticipated to close in the fourth quarter of 2025.
    • Recent Repayments: Year-to-date through Q2 2025, Occidental repaid $3.0 billion of debt. The company has also repaid $7.5 billion of debt within 13 months of the CrownRock acquisition.
    • Debt-to-Equity Ratio: The debt-to-equity ratio is 0.68.

    Cash Flow

    Occidental Petroleum continues to generate substantial cash flow from its operations.

    • Operating Cash Flow (Q2 2025): The company generated $3.0 billion in operating cash flow, with $2.6 billion before working capital adjustments.
    • Free Cash Flow (Q2 2025): Free cash flow before working capital was $0.7 billion for Q2 2025.
    • Annual Free Cash Flow (2024): For 2024, the annual free cash flow was $6.094 billion, a 6.04% decline from 2023.
    • Unrestricted Cash: At the end of Q2 2025, Occidental had an unrestricted cash balance of $2.3 billion.

    Valuation Metrics

    Occidental Petroleum's valuation metrics provide insight into its market position.

    • P/E Ratio (Trailing): Varied reports place the trailing P/E ratio between 26.07 and 28.25, considered high compared to the US Oil and Gas industry average of 13.5x.
    • Forward P/E: Estimates range from 13.34 to 20.18 for 2025.
    • P/S Ratio (TTM): Approximately 1.63 to 1.67.
    • P/B Ratio (TTM): Approximately 1.58 to 1.71.
    • Market Capitalization: Ranging from $43.36 billion to $46.98 billion as of early October 2025.
    • Dividend Yield: Approximately 2.03% to 2.19%.

    In summary, as of October 2, 2025, Occidental Petroleum is actively managing its financial health through strategic divestments to reduce debt, while maintaining solid operational performance in its core oil and gas business. The Q2 2025 results showed adjusted earnings beat expectations, and the company is working towards its debt reduction targets.

    6. Leadership and Management

    Occidental Petroleum (OXY/NYSE) has a focused leadership team and a strategic management approach as of October 2, 2025, emphasizing debt reduction, a sharpened focus on its core oil and gas business, and continued development of low-carbon technologies. The company has also seen recent management changes at the executive level.

    Leadership Team and CEO
    Vicki Hollub serves as the President and Chief Executive Officer of Occidental Petroleum. She has been instrumental in the company's strategic direction, including recent significant divestitures aimed at strengthening the company's financial position. Hollub has expressed that Occidental is "done with the big deals" and will now concentrate on organic growth.

    A notable recent change in the leadership team is the promotion of Richard A. Jackson to Senior Vice President and Chief Operating Officer (COO), effective October 2, 2025. In this expanded role, Jackson is responsible for overseeing global oil and gas operations, low-carbon integrated technologies, midstream and marketing, and health, safety, and environment functions. He continues to report directly to Vicki Hollub. Prior to this promotion, Jackson served as Senior Vice President and President, U.S. Onshore Resources and Carbon Management, Operations, since 2020. His experience includes leading Oxy Low Carbon Ventures since its inception, advancing technologies in emissions measurement, carbon utilization and sequestration, Direct Air Capture, and lithium extraction.

    Board of Directors
    As of October 2025, Jack Moore serves as the Chairman of Occidental's Board of Directors. The Board is responsible for overseeing the company's strategic, operational, and financial priorities. The 2025 Proxy Statement indicates that the Corporate Governance and Nominating Committee recommended, and the Board approved, the nomination of 10 persons to serve for a one-year term ending at the 2026 Annual Meeting of Shareholders. William R. Klesse is identified as the Chair of the Environmental, Health and Safety Committee.

    Management Strategy
    Occidental Petroleum's management strategy as of late 2025 is primarily characterized by a significant move to strengthen its financial position and streamline its focus:

    • Divestment of OxyChem: On October 2, 2025, Occidental announced a definitive agreement to sell its chemical business, OxyChem, to Berkshire Hathaway Inc. for $9.7 billion in an all-cash transaction. This deal is expected to close in the fourth quarter of 2025, subject to regulatory approvals.
    • Debt Reduction: A key objective of the OxyChem sale is debt reduction. Occidental plans to use approximately $6.5 billion of the proceeds to reduce its principal debt, aiming to lower total debt below $15 billion, especially after its late-2023 acquisition of CrownRock LP. The company has already repaid approximately $7.5 billion in debt since July 2024 through various asset sales.
    • Focus on Upstream Oil & Gas: The divestment allows Occidental to sharpen its focus on its core upstream oil and gas operations, particularly in the Permian basin, and to accelerate the development of its low-cost resource opportunities. The company views its current asset portfolio as its best in history.
    • Low-Carbon Technologies: Alongside its core oil and gas business, Occidental remains committed to advancing its low-carbon integrated technologies, including carbon utilization and sequestration, Direct Air Capture, and lithium extraction.
    • Operational Excellence and Emissions Reduction: The company aims for robust operational excellence, having achieved record annual U.S. oil production and increased proved reserves by approximately 15% year-over-year at the end of 2024. It has sustained zero routine flaring in its U.S. oil and gas operations and reduced routine flaring in global oil and gas operations by 80% compared to its 2020 baseline.

    Governance Reputation
    Occidental Petroleum appears to maintain standard corporate governance practices. The company's 2025 Proxy Statement outlines its commitment to good corporate governance, including the Board's role in reviewing corporate governance policies, considering related-party transactions, and overseeing the evaluation of the Board and its committees. Shareholders are given the opportunity for an advisory vote to approve named executive officer compensation, indicating transparency and responsiveness to shareholder input on executive pay. Additionally, the Board submits the selection of its independent auditor (KPMG LLP for the fiscal year ending December 31, 2025) for shareholder ratification. There is no indication of recent governance controversies in the available information, with analysts generally maintaining a "Hold" rating for the stock.

    7. Products, Services, and Innovations

    Occidental Petroleum (OXY/NYSE), as of October 2, 2025, is undergoing a significant strategic transformation with the definitive agreement to sell its chemical business, OxyChem. This divestiture reshapes the company's product and service offerings, intensifying its focus on core upstream oil and gas operations and an ambitious low-carbon ventures segment.

    Impact of OxyChem Sale (as of October 2, 2025)
    On October 2, 2025, Occidental Petroleum announced a definitive agreement to sell its wholly-owned chemical subsidiary, Occidental Chemical Corporation (OxyChem), to Berkshire Hathaway Inc. for $9.7 billion in an all-cash transaction. This sale, expected to close in the fourth quarter of 2025, represents a strategic pivot for Occidental. The company intends to allocate $6.5 billion of the proceeds to reduce its debt, targeting a total principal debt level below $15 billion. Post-sale, Occidental Petroleum's product portfolio will no longer include the diverse range of commodity chemicals manufactured by OxyChem.

    Current Products and Services (Post-OxyChem Sale Focus)
    Following the sale of OxyChem, Occidental Petroleum's primary products and services will be centered around:

    • Oil and Gas Exploration and Production: Occidental remains a major international energy company with significant assets primarily in the United States, particularly in the Permian and DJ basins, as well as offshore Gulf of America. It also has international operations in the Middle East and North Africa.
    • Midstream and Marketing: This segment provides flow assurance and maximizes the value of its oil and gas products.
    • Low Carbon Ventures (OLCV): Through its OLCV subsidiary, Occidental is actively developing and commercializing carbon capture, utilization, and sequestration (CCUS) projects, positioning itself as a "carbon management company." This includes the commercialization of Direct Air Capture (DAC) technology and investments in other low-carbon technologies.

    Innovation Pipelines & R&D Efforts
    Occidental's innovation pipeline and R&D efforts are heavily concentrated on advanced carbon management technologies and enhancing the sustainability and efficiency of its oil and gas operations:

    • Direct Air Capture (DAC) and Carbon Capture, Utilization, and Sequestration (CCUS): This is a pivotal area for Occidental's future growth and sustainability. The company is investing significantly in CCUS technologies, budgeting $2 billion over the next five years, with a goal to capture 25 million metric tons of CO2 annually by 2030.
      • Stratos DAC Plant: Located in the Permian Basin, the Stratos plant is Occidental's flagship project and is expected to move toward commercial operations by the end of 2025. It is designed to capture 500,000 metric tons of CO2 per year.
      • South Texas DAC Hub: Occidental is developing a second DAC facility in South Texas, with XRG (ADNOC's investment company) considering an investment of up to $500 million.
      • CO2 Enhanced Oil Recovery (EOR): Occidental leverages its expertise in CO2 EOR, utilizing captured CO2 for both conventional reservoirs and in pilot tests for shale formations.
      • Partnerships for CO2 Utilization: Occidental's subsidiary, 1PointFive, has signed a 25-year agreement with CF Industries for the removal of approximately 2.3 million metric tons of CO2 annually.
    • Operational Efficiency in Oil and Gas: Occidental is investing in new technologies to improve operational efficiency in its traditional oil and gas business, including innovative facility designs in the Permian and DJ Basins that reduce emissions and traffic.
    • Hydrogen Initiatives: While less detailed, Occidental is also exploring hydrogen initiatives as part of its low-carbon strategy.

    Patents
    Occidental Petroleum has a history of patenting activity. Occidental (excluding subsidiaries) has filed 854 patent applications at the USPTO, with 780 granted, leading to a high grant rate of 91.76%. Patents related to climate change lead Occidental's portfolio.

    Competitive Edge
    Occidental Petroleum's competitive edge is characterized by a dual strategy that balances its strong position in traditional energy production with its pioneering role in carbon management. Key aspects include:

    • Permian Basin Dominance: Occidental's Permian Basin operations are its financial cornerstone, delivering high-margin oil and gas production with operational efficiencies.
    • Leadership in Carbon Capture: Occidental distinguishes itself by integrating carbon capture within its core business model. Its scale in CCUS and DAC, coupled with early-mover advantage, positions it strongly in the global CCS market.
    • Strategic Debt Reduction: The sale of OxyChem is a critical step in strengthening Occidental's financial position by significantly reducing its debt burden.
    • Sustainability Focus: Occidental has set ambitious greenhouse gas emissions reduction goals, aligning with global energy transition trends.

    8. Competitive Landscape

    Occidental Petroleum (OXY/NYSE) is navigating a dynamic and competitive energy landscape as of October 2, 2025, marked by a strategic pivot following the announced sale of its OxyChem division. The company's focus is increasingly centered on upstream oil and gas operations, alongside significant investments in low-carbon ventures.

    Recent Sale of OxyChem

    On October 2, 2025, Occidental Petroleum announced a definitive agreement to sell its OxyChem division to Berkshire Hathaway for $9.7 billion in cash. This transaction is anticipated to close in the fourth quarter of 2025, pending regulatory approvals. This divestiture marks a strategic shift for Occidental, aiming to consolidate its focus on its core upstream oil and gas business and accelerate debt reduction.

    Occidental plans to allocate $6.5 billion of the proceeds from the sale towards reducing its principal debt, with a target of lowering total debt below $15 billion. While this move is expected to strengthen the company's balance sheet, some analysts have expressed concerns regarding the potential impact on future cash flow growth. Furthermore, the sale of the chemical segment, which previously contributed 23.7% to Occidental's revenue, may increase the company's exposure to crude oil price volatility by reducing its business diversification. Conversely, the sale is expected to free up capital to fund high-impact carbon capture initiatives, strategically positioning Occidental as a leader in the low-carbon energy sector.

    Industry Rivals

    Occidental Petroleum operates within a highly competitive global energy market. Its primary rivals can be broadly categorized:

    1. Major Integrated Oil and Gas Companies: These are global giants with vast upstream, midstream, and downstream operations. Key competitors include:

      • ExxonMobil (XOM)
      • Chevron (CVX)
      • ConocoPhillips
      • BP
      • Shell
      • TotalEnergies
    2. Permian Basin Focused Exploration and Production (E&P) Companies: Occidental has a significant presence in the Permian Basin, making other major producers in this region direct competitors. These include:

      • EOG Resources (EOG)
      • Diamondback Energy (FANG)
      • Devon Energy (DVN)
      • Permian Resources Corporation
      • Apache Corp.

    Market Share

    As of October 2025, Occidental Petroleum holds a significant position within the oil and gas industry, particularly in the upstream sector. Its market capitalization stands at approximately $46.97 billion USD, positioning it as the 492nd most valuable company globally by market cap and the 37th largest oil and gas company by market cap.

    Occidental is a leading producer in the Permian Basin, a critical area for U.S. oil production, and was identified as the largest operator and oil producer in the Permian Basin as of 2020. In 2024, its net production averaged 1.327 million barrels of oil equivalent per day. The sale of OxyChem will mean Occidental's revenue will be almost entirely derived from its oil and gas segment, which represented 62.4% of its revenue contribution prior to the sale.

    Competitive Strengths and Weaknesses

    Competitive Strengths:

    • Dominant Permian Basin Position: Occidental possesses a significant and leading position in the Permian Basin, a low-cost source of production and a major growth engine.
    • Operational Efficiency and Technological Advancements: Occidental has demonstrated strong operational efficiency, particularly in the Permian Basin, achieving a 15% improvement in drilling efficiency and an 18% reduction in drilling costs in Q1 2025.
    • Strategic Debt Reduction and Financial Resilience: The proceeds from the OxyChem sale are primarily earmarked for further debt reduction, bolstering its balance sheet and improving financial flexibility.
    • Leadership in Carbon Capture Technologies: Occidental is making substantial investments in emerging low-carbon sectors, including carbon capture and storage (CCS) and direct air capture (DAC), positioning the company as a potential leader in the energy transition.
    • Strong Investor Confidence: Warren Buffett's Berkshire Hathaway holds a significant and growing stake in Occidental, signaling strong investor confidence.

    Competitive Weaknesses:

    • Increased Exposure to Oil Price Volatility: With the divestment of OxyChem, Occidental's business mix will be more heavily weighted towards oil and gas, increasing its vulnerability to fluctuations in global crude oil prices.
    • Historical Debt Burden (though improving): While aggressively reducing debt, the substantial debt load incurred from major acquisitions has historically constrained the company.
    • Limited Renewable Energy Footprint: Compared to some integrated energy majors that are diversifying more aggressively into renewable energy, Occidental's current investments in this area are relatively minimal.
    • Environmental and Regulatory Risks: As a prominent fossil fuel producer, Occidental faces ongoing scrutiny regarding its environmental impact and is subject to stringent environmental regulations.
    • Scale Disadvantage Against Supermajors: While a major player, Occidental's overall scale, asset base, and global operational reach are smaller than those of supermajor integrated oil companies.

    9. Industry and Market Trends

    Occidental Petroleum (OXY/NYSE) is navigating a dynamic energy landscape characterized by a strategic pivot towards carbon management alongside ongoing traditional oil and gas operations. As of October 2, 2025, the company is influenced by broad sector trends, macroeconomic drivers, supply chain complexities, and inherent cyclical effects.

    Occidental Petroleum (OXY) Specifics

    Occidental Petroleum recently announced the sale of its OxyChem chemicals arm to Berkshire Hathaway for $9.7 billion, a move intended to reduce the company's principal debt to below $15 billion and enable the restart of its share repurchase program. While CEO Vicki Hollub characterized this as the "last step" in a decade-long transformation, analysts have expressed concerns that the timing of the sale is not ideal, as it may forgo future free cash flow growth from OxyChem's peaking multi-year initiatives.

    Financially, OXY is strengthening its balance sheet, with rising cash reserves and total assets. Its equity grew by 12%, with further gains anticipated in 2025. The company's robust free cash flow provides flexibility for investments, debt reduction, and enhanced shareholder returns, having achieved its near-term debt reduction target of $4.5 billion. Occidental also reported strong production increases, with a 7% quarter-over-quarter and 3% year-over-year rise, reaching an average of 1,258 thousand barrels of oil equivalent per day, aligning with market guidance. Capital expenditure and production guidance for 2024 were raised by 6% and 5%, respectively, partly due to the integration of CrownRock's contributions.

    A significant aspect of Occidental's strategy is its leadership in carbon capture and storage (CCS) and Direct Air Capture (DAC) technologies, primarily through its Oxy Low Carbon Ventures (OLCV) subsidiary. The company is making a deliberate shift towards DAC, exemplified by key partnerships. Occidental has also expanded its technological arsenal through acquisitions, including DAC startup Holocene in April 2025, complementing its earlier purchase of Carbon Engineering. Its STRATOS facility is now operational, serving as a flagship for commercial-scale DAC, supported by Class VI storage permits. The company plans to establish three carbon sequestration hubs by 2025 and 69 smaller DAC facilities by 2035.

    Oil and Gas Industry Trends

    Sector-Level Trends:

    • Capital Discipline and Efficiency: The industry is prioritizing resilient margins over volume growth, focusing on optimizing capital expenditure and maximizing operational efficiency.
    • Technological Advancement: AI, ML, IIoT, cloud computing, and advanced robotics are increasingly adopted to optimize operations, enhance predictive maintenance, and improve exploration.
    • Mergers & Acquisitions (M&A): Dealmaking activity is expected to continue, driven by a positive medium-term outlook for oil and international gas prices.
    • Permian Basin Focus: The Permian Basin remains a crucial growth region, with operators leveraging infrastructure for faster market access and lower costs.
    • Natural Gas Growth: Demand for natural gas, particularly in the U.S., is expected to rise due to new LNG export capacity and increasing power requirements from data centers.
    • Energy Diversification: Oilfield services companies are increasingly diversifying into low-carbon ventures like carbon capture and hydrogen generation.

    Macro Drivers:

    • Global Economy and Interest Rates: Easing monetary policies, geopolitical tensions, and post-2024 election energy policies are creating a pivotal year for energy markets.
    • Oil Prices: Oil prices are projected to be range-bound between US$70/bbl and US$80/bbl in 2025, potentially increasing with escalated geopolitical tensions. However, some forecasts suggest a "lower for longer" price environment, with Brent crude potentially falling below $60 per barrel by early 2026.
    • Geopolitical Factors: Geopolitical instability, trade policies, and OPEC+ decisions significantly influence oil prices and market volatility.
    • Global Demand: Global demand for road transportation fuels is expected to see strong growth in 2025. Overall liquid fuels consumption is forecast to increase by 0.9 million b/d in 2025, predominantly driven by non-OECD countries.
    • OPEC+ Strategy: OPEC+ plans to gradually restore approximately 2.2 million barrels per day (MMbbl/d) in monthly increments during 2025, contributing to a projected international oil market surplus.

    Supply Chains:

    • Vulnerability to Geopolitics: Global base oil production and distribution are susceptible to disruptions from geopolitical tensions.
    • Raw Material Costs: Fluctuations in crude oil prices directly impact base oil production costs.
    • Logistical Hurdles: Challenges in transportation and storage, particularly in regions with underdeveloped infrastructure, contribute to increased delivery times and costs.
    • Refining Capacity: The global refining sector faces shifts, with closures in some European regions and new expansions in places like China.
    • LNG Infrastructure: Expansion in global LNG capacity is driving innovation in cryogenic technology and shipping.

    Cyclical Effects:

    • The oil and gas industry is inherently cyclical, moving through phases of investment and retrenchment. The current phase emphasizes disciplined growth and shareholder returns.
    • The industry is preparing for a "lower for longer" price environment, necessitating structural adjustments.
    • Some oilfield services companies are actively diversifying into low-carbon technologies to reduce their exposure to the traditional energy industry's cyclical nature.

    Carbon Management Trends

    The carbon management market is experiencing significant growth, with the global carbon footprint management market projected to reach $13.5 billion in 2025 and $55.9 billion by 2035. This growth is underpinned by several key trends:

    • Rising Corporate Climate Regulation: There is a clear global trend towards increased climate disclosure and stringent corporate climate regulations.
    • Government Support: Global climate ambitions, governmental support, and frameworks such as Article 6 of the Paris Agreement and CORSIA are driving market maturity.
    • Technological Integration: Digitalization, including blockchain and AI, is transforming the carbon market by enhancing the efficiency of project development and MRV.
    • DAC Commercialization: Direct Air Capture (DAC) technology is reaching commercial scale, with large-scale facilities becoming operational.
    • Carbon Credit Demand: Corporations are increasingly seeking carbon credits to offset emissions and finance climate action.
    • Focus on Embodied Carbon: A heightened focus is expected on collecting actual embodied carbon data and decarbonizing upstream emissions.
    • Challenges: The market faces ongoing challenges related to the integrity of carbon credits and the need for more robust MRV systems.

    10. Risks and Challenges

    Occidental Petroleum (OXY/NYSE) is navigating a dynamic environment marked by significant strategic shifts, particularly the recent sale of its OxyChem division and an intensified focus on carbon management. As of October 2, 2025, the company faces a distinct set of operational, regulatory, market, and reputational risks and challenges.

    Operational Risks and Challenges

    Occidental's operational profile is deeply intertwined with the inherent volatility of the oil and gas sector and the nascent stage of large-scale carbon management technologies.

    • Commodity Price Volatility: As an independent exploration and production company, Occidental Petroleum's financial performance is highly sensitive to fluctuations in crude oil and natural gas prices.
    • Project Execution and Technological Hurdles in Carbon Management: Occidental is investing heavily in Direct Air Capture (DAC) and Carbon Capture, Utilization, and Storage (CCUS) projects. These ambitious endeavors carry substantial technological and execution risks. The first large-scale DAC plant experienced delays, pushing its commercial operational date to mid-2025 due to supply chain issues and construction complexities.
    • Weather and Climate-Related Disruptions: Occidental's operations, particularly its offshore oil and gas platforms and facilities along the U.S. Gulf Coast, are vulnerable to severe weather events.
    • Supply Chain and Labor Constraints: The construction and operation of new, large-scale projects, especially those in carbon capture, can be hampered by supply chain bottlenecks and challenges in securing a skilled workforce.

    Regulatory Risks and Challenges

    The regulatory environment for Occidental is undergoing rapid changes, driven by global climate goals and domestic policy shifts.

    • Evolving Climate Change Regulations: The U.S., European Union, and other countries are implementing laws and regulations aligned with the Paris Agreement. While the U.S. Inflation Reduction Act (IRA) offers support for DAC and CCUS, these technologies still face regulatory, technological, and market uncertainties.
    • Permitting Complexities for CCUS and DAC: The siting, construction, and operation of carbon capture and storage facilities are subject to intricate federal, state, and local regulatory and permitting requirements.
    • Carbon Market Volatility and Policy Shifts: Occidental's reliance on carbon credits and the voluntary carbon market for its DAC projects is challenged by the instability of long-term contracts.
    • Increased ESG Disclosure Requirements: The U.S. Securities and Exchange Commission (SEC) has adopted regulations mandating expanded disclosure of greenhouse gas emissions and climate-related financial risks and costs, increasing Occidental's reporting burden.

    Market Risks and Challenges

    Occidental's market position is being fundamentally reshaped by the divestment of OxyChem and its strategic pivot towards low-carbon ventures.

    • Increased Reliance on Cyclical Oil Prices: The sale of OxyChem, a segment known for its stable cash flows and business diversification, makes Occidental more susceptible to the inherent cyclicality of crude oil and natural gas prices.
    • Impact of Energy Transition on Hydrocarbon Demand: While Occidental maintains that traditional energy sources will be required for decades, evolving regulatory pressures and shifting investor sentiment could constrain its hydrocarbon operations in the long term.
    • Financing Challenges for Carbon Capture: Occidental's carbon capture division faces substantial financing hurdles. Lenders are seeking more stable and long-term revenue streams than currently offered by the voluntary carbon market.
    • Competition in Low-Carbon Ventures: Despite being an early mover in DAC, Occidental faces competition and the necessity of achieving substantial cost reductions and significant scaling to ensure financial viability.
    • Geopolitical Factors: Geopolitical events and international sanctions can influence global oil prices, directly impacting Occidental's core business.
    • Valuation and Market Sentiment: As of August 2025, market sentiment regarding Occidental is cautious, with analysts divided on its ability to navigate oil price volatility, significant debt, and the inherent risks of carbon capture.

    Reputational Risks and Challenges

    Occidental's dual strategy of maintaining traditional oil and gas production while aggressively pursuing carbon management creates unique reputational dilemmas.

    • "Greenwashing" Accusations: Critics contend that Occidental's use of captured CO2 for Enhanced Oil Recovery (EOR) undermines its climate credibility, potentially increasing oil production and leading to accusations of "greenwashing."
    • ESG Investment Scrutiny: Despite its low-carbon initiatives, Occidental faces scrutiny from ESG investors who may view continued investments in fossil fuels as misaligned with net-zero objectives.
    • Public Acceptance of DAC and CCUS: While Occidental aims to lead in carbon management, the broad public acceptance of DAC and CCUS technologies, particularly when linked to EOR, is not guaranteed.
    • Transparency and Disclosure: The company's climate disclosures have drawn criticism for lacking clarity on concrete steps to transition away from fossil fuels and for setting aspirational goals for Scope 3 emissions.

    Impact of OxyChem Sale and Focus on Carbon Management

    The recent sale of OxyChem to Berkshire Hathaway for $9.7 billion, projected to finalize in Q4 2025, marks a pivotal strategic shift for Occidental Petroleum.

    • Debt Reduction: A primary benefit is the accelerated reduction of debt, with Occidental planning to allocate $6.5 billion of the proceeds to lower its principal debt below $15 billion.
    • Loss of Diversification: OxyChem was a resilient, cash-generating business that offered earnings diversification and stability in free cash flow. Its divestment means Occidental will have increased exposure to the cyclical nature of upstream oil and gas operations.
    • Capital Reallocation to Energy Transition: The sale liberates capital that can be reinvested into Occidental's advanced carbon capture technologies, reinforcing its commitment to the energy transition.
    • Focus on Core Oil & Gas: The divestment allows Occidental to concentrate on its core upstream oil and gas operations.
    • Carbon Management as a Core Business: Occidental intends for its carbon management business unit, 1PointFive, to grow to a scale comparable to its former chemicals arm within the next decade.

    In conclusion, Occidental Petroleum, as of October 2, 2025, is strategically repositioning itself through significant debt reduction and an aggressive push into carbon management. This pivot, however, exposes it to heightened operational complexities, a rapidly evolving and often unpredictable regulatory landscape, market volatility across both traditional and emerging energy sectors, and a critical need to manage its reputational standing amidst intense ESG scrutiny and "greenwashing" concerns.

    11. Opportunities and Catalysts

    Occidental Petroleum (OXY/NYSE) is strategically positioning itself as a leader in both traditional energy production and the burgeoning carbon management sector. As of October 2, 2025, the company's opportunities and catalysts are significantly shaped by its recent divestiture of OxyChem and its aggressive focus on carbon capture technologies.

    Growth Levers

    Occidental's growth is primarily driven by its robust upstream oil and gas operations and its ambitious expansion into carbon management:

    1. Upstream Oil and Gas (Permian Basin): The Permian Basin remains a core financial strength for Occidental, delivering strong cash flow and operational efficiencies. The company has reported a 17% year-over-year increase in oil equivalent production in Q1 2025, reaching 1.4 million barrels per day. The acquisition of CrownRock in December 2023 significantly bolstered its Permian assets.
    2. Carbon Management (Oxy Low Carbon Ventures – OLCV): This segment represents a pivotal growth engine, with Occidental heavily investing in Direct Air Capture (DAC) and Carbon Capture, Utilization, and Storage (CCUS) technologies through its subsidiary, 1PointFive.
      • STRATOS Facility: Occidental's flagship DAC facility, STRATOS, is on track to commence commercial operations by the end of 2025, designed to capture 500,000 metric tons of CO2 annually.
      • Enhanced Oil Recovery (EOR): Captured CO2 from DAC facilities will be either sequestered underground or utilized for enhanced oil recovery (EOR).
      • Technology Acquisitions: Occidental acquired Carbon Engineering for $1.1 billion and another DAC startup, Holocene, in April 2025.
      • Strategic Partnerships: Occidental is forming key alliances to scale its carbon capture capabilities, including a collaboration with ADNOC's XRG and a 25-year CO2 offtake agreement with CF Industries.
      • Government Support: The company's DAC projects have received substantial U.S. government backing, including grants and favorable tax incentives like the 45Q credit.

    New Markets

    Occidental is actively creating and expanding markets for its carbon management solutions:

    1. Carbon Removal Credits: A significant new market opportunity is the sale of carbon removal credits. Most of the credits expected from the STRATOS facility through 2030 have already been pre-sold to major corporations.
    2. Lower-Carbon Products: The company is exploring new product avenues, such as developing AirCarbon, a biomaterial created by Newlight from air and greenhouse gas emissions.
    3. Geographical Expansion: Strategic partnerships suggest potential for future international expansion in carbon management.

    M&A Potential

    Occidental's M&A strategy is currently centered on debt reduction and strategic focus:

    1. Divestiture of OxyChem: On October 2, 2025, Occidental announced a definitive agreement to sell its wholly-owned chemical subsidiary, OxyChem, to Berkshire Hathaway for $9.7 billion. The primary driver for this divestiture is to reduce Occidental's substantial debt load.
    2. Future M&A: While immediate priorities are debt reduction, Occidental's recent acquisitions of DAC startups indicate a continued appetite for strategic acquisitions that enhance its carbon management technologies.

    Near-Term Events (as of 10/2/2025)

    Several key events are on the horizon for Occidental Petroleum:

    1. OxyChem Sale Closing: The sale of OxyChem to Berkshire Hathaway is expected to be finalized in the fourth quarter of 2025.
    2. STRATOS Facility Launch: The STRATOS Direct Air Capture facility in the Permian Basin is scheduled to begin commercial operations and capture CO2 by the end of 2025.
    3. Q3 2025 Earnings Report: Occidental Petroleum is estimated to report its third-quarter 2025 earnings on November 11, 2025.
    4. South Texas DAC Hub Development: The company is advancing plans for a second large-scale DAC facility in South Texas.
    5. Regulatory Landscape: The continuation of the U.S. 45Q tax incentive for carbon capture and sequestration, as well as recent EPA permits for CO2 sequestration in Texas, provide a supportive regulatory environment.

    12. Investor Sentiment and Analyst Coverage

    As of October 2, 2025, Occidental Petroleum (OXY/NYSE) presents a mixed yet strategically focused investment profile, characterized by a "Hold" consensus among Wall Street analysts, significant institutional ownership (including Warren Buffett's Berkshire Hathaway), "extremely bullish" retail investor sentiment, and recent strategic shifts emphasizing debt reduction and an ambitious pivot towards low-carbon ventures.

    Wall Street Ratings

    Occidental Petroleum currently holds a consensus "Hold" rating from a majority of Wall Street analysts. Out of 23 to 26 brokerage firms, 17 to 18 analysts have issued a "Hold" rating. The average price target ranges from $50.62 to $54.32, suggesting a potential upside of 14.20% to 18.27% from the stock's current price.

    Recent analyst activity (July-October 2025) has shown varied adjustments:

    • Roth Capital maintained a "Neutral" rating and raised its price target to $46.00 on October 2, 2025.
    • UBS reiterated its "Neutral" rating and a $46.00 price target on October 1, 2025.
    • Melius Research initiated coverage with a "Hold" rating and a target of $64.00 on August 20, 2025.
    • Morgan Stanley downgraded OXY to "Equal-Weight" from "Overweight" on August 18, 2025, citing concerns over the company's debt levels.
    • Raymond James raised its price target to $58 with an "Outperform" rating on October 1, 2025.

    Hedge Fund Moves

    Hedge fund activity in Q2 2025 indicates a mixed but generally active landscape for OXY. Approximately 582 institutional investors increased their holdings, while 514 reduced them. Significant buyers in Q2 2025 include Vanguard Group Inc., BlackRock, Inc., Geode Capital Management, LLC, and Dimensional Fund Advisors LP. Notable sellers include Squarepoint Ops LLC, Marshall Wace, LLP, Two Sigma Investments, LP, Smead Capital Management, Inc., and Morgan Stanley.

    Institutional Investors

    Institutional investors and hedge funds collectively own a substantial 88.70% of Occidental Petroleum's stock. While the percentage of institutional ownership slightly decreased from 80.2% in March 2025 to 77.6% in June 2025, the aggregate institutional position still increased to 763.64 million shares by June 2025.

    Warren Buffett's Berkshire Hathaway Inc. remains the largest institutional holder, owning 264.94 million shares, representing 26.92% of OXY's outstanding stock as of June 30, 2025. Berkshire also holds warrants to buy additional shares and about $8.5 billion worth of preferred Occidental shares from its 2019 investment. Other top institutional holders include Vanguard Group Inc., Dodge & Cox, BlackRock, Inc., and State Street Corp.

    Retail Chatter

    Retail investor sentiment for Occidental Petroleum (OXY) is "extremely bullish" as of October 1-2, 2025, with a sentiment score of 82/100 on platforms like Stocktwits. OXY was also among the top 20 trending equity tickers, with message volume remaining at "high" levels, indicating active retail interest. The announcement of the OxyChem sale to Berkshire Hathaway contributed to a rise in OXY's stock and bolstered retail sentiment.

    Recent Strategic Shifts

    Occidental Petroleum has undertaken significant strategic shifts in late 2024 and 2025, primarily focusing on debt reduction and an aggressive expansion into low-carbon technologies:

    1. OxyChem Divestiture: On October 2, 2025, Occidental completed the sale of its chemical unit, OxyChem, to Berkshire Hathaway for $9.7 billion. Occidental plans to use $6.5 billion of the proceeds to reduce its principal debt below $15 billion. CEO Vicki Hollub announced that the company will cease pursuing major acquisitions.
    2. Carbon Capture and Low Carbon Ventures (OLCV): Occidental is making substantial investments in Carbon Capture, Utilization, and Sequestration (CCUS) and Direct Air Capture (DAC) technologies. The flagship Stratos DAC plant is expected to be operational by mid-2025. The company plans to establish three carbon sequestration hubs by 2025 and 69 smaller DAC facilities by 2035.
    3. Permian Basin Focus: Occidental's Permian Basin operations remain a financial cornerstone, known for high-margin oil and gas production.
    4. Capital Allocation: Beyond the OxyChem sale, Occidental has consistently focused on debt reduction and prioritizing shareholder returns.

    In summary, Occidental Petroleum is navigating the energy transition by aggressively addressing its debt and making substantial investments in future-oriented carbon capture technologies. While Wall Street maintains a cautious "Hold" stance, the market acknowledges OXY's operational strengths and strategic repositioning, which is reflected in increased institutional buying from some major players and highly bullish retail sentiment.

    13. Regulatory, Policy, and Geopolitical Factors

    Occidental Petroleum (OXY/NYSE) is navigating a complex and evolving landscape shaped by significant regulatory, policy, and geopolitical factors as of October 2, 2025. The company's strategic emphasis on both traditional oil and gas operations and its burgeoning carbon management initiatives places it at the forefront of the global energy transition.

    Regulatory Environment

    Oil and Gas Operations:
    The U.S. regulatory environment for oil and gas is undergoing significant changes, particularly concerning methane emissions. In 2024, the U.S. Environmental Protection Agency (EPA) finalized stringent rules under the Clean Air Act to reduce methane and other volatile organic compounds (VOCs) from both new and existing oil and natural gas facilities.

    However, the current administration, in office since January 2025, has initiated a shift in regulatory approach. As of July 28, 2025, the EPA issued an interim final rule to extend compliance deadlines for several provisions of these methane regulations, aiming to provide more "realistic timelines" for operators. The administration has also prioritized easing regulatory burdens, with executive orders such as "Unleashing American Energy" aimed at expanding oil and gas exploration, opening federal lands for drilling, and expediting permits.

    Carbon Management Focus:
    For Occidental's carbon management initiatives, the regulatory framework is primarily focused on ensuring the safe and secure geological sequestration of CO2. The EPA's Underground Injection Control (UIC) Class VI program provides the necessary rigorous regulatory structure. Occidental's flagship Direct Air Capture (DAC) facility, STRATOS, has successfully secured Class VI permits, a crucial step indicating regulatory acceptance.

    Policy Impacts and Government Incentives

    Oil and Gas Operations:
    U.S. energy policy, under the current administration, is actively promoting domestic oil and gas production. The "One Big Beautiful Bill Act" (OBBBA), signed into law on July 4, 2025, includes provisions designed to boost U.S. oil and gas output. Key measures include reducing regulatory requirements for leasing federal lands for oilfield development and lowering the royalty burden rate on federal lands. Additionally, the administration is focused on lifting the pause on Liquefied Natural Gas (LNG) exports and expediting drilling permits.

    Carbon Management Focus (CCUS and DAC):
    Government incentives, particularly the Section 45Q tax credit, remain a cornerstone of U.S. policy supporting Carbon Capture, Utilization, and Storage (CCUS) and DAC. The Inflation Reduction Act (IRA) significantly enhanced these credits, increasing their value substantially. For CO2 stored in dedicated geologic formations, the credit for point-source capture is $85 per metric ton, and for DAC, it is $180 per metric ton. The OBBBA, enacted in July 2025, maintained these credit values and notably established parity for CO2 utilization. These tax credits are available for projects that commence construction before January 1, 2033, and can be claimed for up to 12 years.

    Occidental is actively capitalizing on these incentives. Its STRATOS DAC plant is slated to begin commercial operations by mid-2025, initially capturing 250,000 tonnes per annum. The U.S. Department of Energy (DOE) has also provided substantial grants, including up to $500 million for Occidental's DAC projects, underscoring strong government backing.

    Geopolitical Risks and Opportunities

    Oil and Gas Operations:
    The global oil market is marked by ongoing geopolitical complexities. Occidental Petroleum's CEO, Vicki Hollub, has voiced concerns about a potential oil supply shortage from late 2025 due to insufficient exploration activities. Conversely, the U.S. Energy Information Administration (EIA) forecasts lower Brent crude prices, attributing this to rising global oil inventories.

    Ongoing geopolitical tensions, particularly the Israel-Iran conflict, present both risks and opportunities. The Strait of Hormuz remains a critical chokepoint, with potential disruptions impacting oil prices. Occidental's established operations in the Middle East, including a 15-year extension for its oil production agreement in Oman's Block 53, provide a strategic hedge against such instability.

    A significant development on October 2, 2025, is Occidental's agreement to divest its OxyChem chemical business to Berkshire Hathaway for $9.7 billion. This strategic move aims to accelerate debt reduction and allow Occidental to intensify its focus on core upstream oil and gas operations and integrated technologies.

    Carbon Management Focus:
    Occidental's leadership in carbon management presents geopolitical opportunities, particularly in aligning with global climate goals. Its collaborations, such as with Abu Dhabi's ADNOC on DAC projects, position it favorably in the growing market for ESG-driven solutions. The global emphasis on decarbonization, reflected in policies like the EU's Carbon Border Adjustment Mechanism (CBAM) coming into effect in 2026, highlights the increasing importance of verifiable carbon reduction efforts.

    14. Outlook and Scenarios

    Occidental Petroleum (OXY/NYSE) is undergoing a significant strategic transformation as of October 2, 2025, marked by the recent sale of its OxyChem division and an accelerated focus on carbon management. This pivot is reshaping its financial outlook, risk profile, and long-term growth prospects, leading to distinct bull and bear cases.

    Strategic Pivots for Occidental Petroleum

    Occidental Petroleum is strategically pivoting to redefine its core business and enhance its financial health and environmental profile:

    • Deleveraging through Asset Sales: The most prominent recent pivot is the agreement to sell its OxyChem chemicals division to Berkshire Hathaway for $9.7 billion. This divestment aims to significantly reduce Occidental's substantial debt burden, with $6.5 billion of the proceeds allocated to lower principal debt below $15 billion.
    • Refocusing on Upstream Oil and Gas: By shedding OxyChem, Occidental is intensifying its focus on its core upstream oil and gas operations, particularly leveraging its assets in the Permian Basin. This is expected to "unlock 20-plus years of low-cost resource runway" in its oil and gas portfolio.
    • Accelerated Carbon Management Leadership: Occidental is making a bold commitment to carbon capture, utilization, and storage (CCUS) through its subsidiary, 1PointFive, with a stated goal of achieving net-zero emissions by 2050. This involves substantial investments in Direct Air Capture (DAC) technology, including large-scale facilities like STRATOS in Texas, expected to begin commercial operations in 2025.
    • Strategic Partnerships and Innovation: The company is forging key partnerships, such as with ADNOC's XRG to explore a DAC hub in South Texas, and is investing in technologies that convert captured CO2 into valuable products.

    Short-Term vs. Long-Term Projections

    Short-Term Projections (Next 12-24 months):

    • Stock Price & Analyst Sentiment: As of October 2, 2025, the stock has seen recent volatility, including a 7.5% drop after the OxyChem sale announcement. Current stock forecasts for October 2025 predict a trading range between $47.55 and $52.65, with an average around $49.58. The average analyst rating is "Hold," with an average price target of $52.20, suggesting an 18.27% upside over the next year.
    • Financial Impact of OxyChem Sale: While reducing debt, the sale of OxyChem is expected by some analysts to potentially weigh on free cash flow growth.
    • Earnings: Occidental reported $0.39 earnings per share (EPS) for a recent quarter, slightly beating consensus estimates, with revenue down 6.1% year-over-year. Analysts anticipate 3.58 EPS for the current fiscal year.

    Long-Term Projections (3-5+ years):

    • Stock Price Outlook: Long-term forecasts generally suggest a bullish trend. Projections for 2030 range significantly, with some analysts predicting an average price of $72.466, representing a +53.37% return over five years, while others are more optimistic, forecasting an average of $153.74.
    • Carbon Management as a Growth Driver: The substantial investment in DAC and CCUS is seen as a key long-term growth driver, positioning Occidental as a leader in the emerging low-carbon economy.
    • Strategic Roadmap: Occidental's 2025 strategic roadmap emphasizes expanding its low-carbon portfolio while maintaining profitability from its traditional energy assets.

    Bull vs. Bear Case

    Bull Case:

    • Strong Balance Sheet & Reduced Debt: Successful execution of the debt reduction plan will significantly de-risk the company and improve its financial flexibility.
    • Leadership in Carbon Management: Becoming a leading player in DAC and CCUS could establish Occidental as a key enabler of the energy transition, attracting green investment and generating new revenue streams.
    • Core Upstream Strength: Continued robust performance from its prolific Permian Basin assets provides a stable cash flow foundation.
    • "Buffett Premium": Warren Buffett's significant stake and Berkshire Hathaway's acquisition of OxyChem signal a vote of confidence.
    • Strategic Agility: The company's ability to adapt and balance traditional energy with future-focused low-carbon initiatives positions it well.

    Bear Case:

    • Increased Oil Price Volatility Exposure: The divestment of OxyChem removes a significant source of earnings diversification and free cash flow stability, making Occidental's financial performance more susceptible to the inherent volatility of crude oil prices.
    • OxyChem Sale Undervaluation & Cash Flow Impact: Concerns that the $9.7 billion sale price for OxyChem might be undervalued and that its absence could negatively impact future free cash flow growth.
    • Carbon Capture Risks and Costs: The commercial viability, scalability, and cost-effectiveness of DAC and CCUS technologies are still evolving. Delays or higher-than-anticipated costs could impact profitability.
    • Persistent Debt Concerns: While reduced, the remaining debt burden, coupled with potential fluctuations in oil prices, could still pose financial challenges.
    • Analyst Caution: The prevailing "Hold" consensus rating and mid-term bearish technical signals indicate that a significant portion of the market remains cautious.

    15. Conclusion

    Occidental Petroleum (OXY/NYSE) is navigating a transformative period as of October 2, 2025, marked by a significant divestiture and an accelerated focus on carbon management. The company's strategic moves aim to strengthen its balance sheet and reposition it for a lower-carbon energy future, though these changes come with both opportunities and challenges for investors.

    Summary of Key Findings:

    Recent Sale of OxyChem:
    Occidental Petroleum has agreed to sell its chemical division, OxyChem, to Berkshire Hathaway for $9.7 billion in an all-cash transaction. Occidental plans to allocate $6.5 billion of these proceeds towards debt reduction, aiming to bring its principal debt below $15 billion. OxyChem was a profitable segment, contributing approximately 19% of total sales in 2024.

    Carbon Management Focus:
    Occidental is making substantial investments and progress in carbon management through its subsidiary, 1PointFive, solidifying its commitment to Direct Air Capture (DAC) technology and carbon sequestration.

    • STRATOS Project: The company's flagship DAC facility, STRATOS, is on track to begin commercial operations in Q3 2025, with full ramp-up by year-end, designed to capture 500,000 metric tons of CO2 annually.
    • South Texas DAC Hub: Occidental has secured up to $650 million from the U.S. Department of Energy to develop a second DAC hub in South Texas.
    • The company acquired Holocene in 2025 to enhance its DAC technology and aims to establish three carbon sequestration hubs by 2025.

    Financial Performance and Debt Reduction:
    Occidental reported strong Q2 2025 results, with adjusted diluted earnings per share (EPS) of $0.39 and revenue of $6.41 billion, both surpassing analyst forecasts. The company has been actively reducing debt, repaying $7.5 billion since July 2024 and announcing an additional $950 million in asset divestitures since Q1 2025. These efforts are crucial following the debt incurred from the CrownRock acquisition in late 2023/early 2024. Occidental also expects significant cash tax savings of $700-$800 million across 2025 and 2026 due to recent legislation.

    Balanced Perspective:

    Positives:

    • Deleveraging and Focus: The OxyChem sale is a clear step towards reducing the company's substantial debt, allowing a sharpened focus on core oil and gas operations and its emerging low-carbon ventures.
    • Leadership in Carbon Management: Occidental is a frontrunner in large-scale DAC technology, positioning OXY to potentially capitalize on the growing demand for carbon credits and decarbonization solutions.
    • Solid Operational Performance: Despite some market volatility, OXY continues to demonstrate strong operational efficiency and production.

    Challenges and Concerns:

    • OxyChem Sale Valuation: Some analysts have voiced concerns that the $9.7 billion sale price for OxyChem might be undervalued, and that the divestiture could hinder future free cash flow growth.
    • Debt Levels and Financial Health: While debt reduction is a priority, the company's Altman Z-Score of 1.46 places it in a "distress zone," indicating potential financial challenges.
    • Profitability of Carbon Management: The low-carbon division's large-scale commercial viability and profitability are yet to be fully realized.
    • Commodity Price Volatility: As a major oil and gas producer, Occidental's financial performance remains sensitive to fluctuating crude and natural gas prices.

    Investor Watchpoints (as of 10/2/2025):

    1. Debt Reduction Progress: Monitor whether Occidental successfully utilizes the OxyChem sale proceeds to reduce its principal debt below the $15 billion target and its overall deleveraging efforts.
    2. OxyChem Sale Closure and Impact: Watch for the definitive closing of the OxyChem transaction and any subsequent adjustments to financial guidance or reporting structures. Pay attention to how the market reacts post-closure, especially concerning cash flow projections.
    3. Carbon Management Project Milestones: Track the commissioning and ramp-up of the STRATOS DAC facility in Q3 2025 and its performance in achieving stated CO2 capture targets. Also, monitor progress on the South Texas DAC Hub and any further partnerships or Department of Energy funding.
    4. Profitability of Low Carbon Ventures: While a long-term play, look for any updates or disclosures regarding the commercial viability and financial contributions of Occidental's carbon management projects as they scale up.
    5. Capital Allocation and Shareholder Returns: With the stated end of "big deals," investors should watch how the company allocates capital towards organic growth in its core business versus investments in low-carbon initiatives, and how this translates into shareholder returns (e.g., dividends, share buybacks).
    6. Commodity Price Environment: Given OXY's primary business, global oil and gas price trends will continue to be a critical determinant of the company's revenue and profitability.
    7. Analyst Revisions and Ratings: Keep an eye on any significant shifts in analyst ratings or price targets, especially as more clarity emerges on the post-OxyChem sale financials and DAC project performance. The current consensus is "Hold" with an average price target around $54.32.

    This content is intended for informational purposes only and is not financial advice

  • Marvell Technology (MRVL): Powering the AI Infrastructure Revolution

    Marvell Technology (MRVL): Powering the AI Infrastructure Revolution

    As of October 2, 2025, Marvell Technology (NASDAQ: MRVL) stands as a pivotal American semiconductor company, headquartered in Santa Clara, California. It specializes in designing and producing semiconductors and related technology for data infrastructure, spanning from the data center core to the network edge. Founded in 1995, Marvell has grown to over 6,500 employees, holding over 10,000 patents worldwide and reporting an annual revenue of $5.5 billion for fiscal 2024.

    Marvell's current relevance in the semiconductor industry is underscored by its critical role in the foundational technologies driving the digital transformation and the AI era. The company is in significant focus due to its strategic repositioning as a pure-play enabler of AI data centers and its strong emphasis on custom silicon and interconnect verticals. The rapid expansion of AI workloads and large-scale models is redefining data center architectures, driving unprecedented demand for interconnect performance, bandwidth, and power efficiency, an area where Marvell is at the forefront. Major cloud providers (hyperscalers) are increasingly investing in custom chips to optimize their AI workloads, and Marvell leverages its deep intellectual property and design expertise to partner with these hyperscalers. This "custom business" has doubled, reaching approximately $1.5 billion, and is expected to continue growing. Marvell is also a leader in high-speed interconnects, including optical and electrical solutions, which are vital for transferring massive amounts of data in AI and machine learning tasks. Its data center business has tripled since 2023, with AI-related revenue growing over six times, now accounting for 73% of its revenue. Strategic capital allocation, including a new $5 billion stock repurchase program, further signals management's confidence in Marvell's AI infrastructure focus.

    2. Historical Background

    Marvell Technology, Inc. (NASDAQ: MRVL) was founded in 1995 by Dr. Sehat Sutardja, his wife Weili Dai, and his brother Pantas Sutardja. Their vision was to build a "marvelous" company that would bring innovative and advanced technologies to the industry. Starting with personal savings and a $200,000 license for a circuit design, they worked for nearly two years without pay before securing $1 million in funding from chip entrepreneur Dado Banatao. Sehat Sutardja, a brilliant engineer, held over 440 patents and was a driving force behind the company's early innovations.

    Marvell's first product was a CMOS-based read channel for disk drives, a groundbreaking device that reduced power consumption and costs while enhancing performance. Seagate Technology became their first customer, and Marvell quickly became a leader in the storage industry. The company went public on NASDAQ on June 27, 2000, raising $90 million and already profitable with $88 million in annual revenue. Early milestones also included the establishment of Marvell Software Solutions Israel in 1998 and the acquisition of RADLAN Computer Communications in 2003 to enhance its networking product offerings.

    The company has undergone significant transformations. In 2006, Marvell acquired Intel's XScale processor business, expanding into mobile and wireless, and even supplied the Wi-Fi chip for the original Apple iPhone. A major turning point occurred in 2016 when co-founders Sehat Sutardja and Weili Dai were ousted, and Matt Murphy was appointed CEO. Under Murphy's leadership, Marvell initiated a strategic pivot away from consumer markets towards high-growth data infrastructure, including enterprise, cloud, automotive, and carrier segments. This involved divesting non-core assets and making transformative acquisitions: Cavium (2018) expanded Marvell into a broader infrastructure semiconductor provider; Aquantia (2019) and Avera Semiconductor (2019) enhanced its custom ASIC offerings; and Inphi Corporation (2021) significantly strengthened its position in cloud data centers and 5G infrastructure with high-speed data movement solutions. More recently, Marvell has sharpened its focus on AI-driven data centers and custom ASICs, partnering with hyperscalers and leveraging advanced node technologies like 2nm with TSMC. The divestiture of its Automotive Ethernet business in August 2025 for $2.5 billion further solidified its concentration on core data infrastructure and AI.

    3. Business Model

    Marvell Technology, Inc. (MRVL) operates on a fabless semiconductor business model, emphasizing the design, development, and sale of high-performance semiconductor solutions predominantly for data infrastructure. The company's core strategy revolves around intensive research and development, while outsourcing the actual manufacturing of its chips. Marvell leverages its extensive intellectual property (IP) portfolio to deliver comprehensive platform solutions, with a notable focus on custom silicon (ASIC) design for key customers.

    Marvell's revenue is primarily generated through the sale of its semiconductor products. For fiscal year 2024, data infrastructure accounted for roughly 80% of its total revenue, which stood at $5.51 billion. The company reported $2.01 billion in revenue for the quarter ending August 2, 2025, marking a 57.60% year-over-year growth. The custom AI chip business is a rapidly expanding revenue stream, driven by partnerships with major hyperscalers.

    The company's primary product lines include:

    • Connectivity and Networking: High-speed Ethernet switches (Prestera, Teralynx), PHYs, network adapters, optical modules, and PAM4/coherent technologies crucial for data centers, enterprise, and carrier networks.
    • Data Processing and Compute: Multi-core ARM-based processing units, infrastructure processors (OCTEON, ARMADA DPUs), and custom SoC solutions for cloud, AI, and ML workloads.
    • Storage: Controllers for HDDs and SSDs, Fibre Channel, and storage accelerators.
    • Security Solutions: Security processors, Hardware Security Modules (HSM), and cryptographic offload engines.

    Marvell also offers specialized services, primarily focusing on customization and development of semiconductor solutions, particularly custom silicon (ASIC) design for cloud and infrastructure players. Its independent subsidiary, Marvell Government Solutions (MGS), provides ASIC development for Aerospace and Defense.

    The company's key business segments are:

    • Data Center: The largest and fastest-growing segment, comprising approximately 74.32% of revenues, supporting AI infrastructure, cloud services, and enterprise data center operations.
    • Enterprise Networking: About 9.65% of revenues, providing advanced networking solutions.
    • Carrier Infrastructure (5G and Wireless): Approximately 6.49% of revenues, supplying solutions for 5G networks.
    • Consumer: Represents about 5.78% of revenue.
    • Automotive/Industrial: Historically a segment, but the Automotive Ethernet business was divested in August 2025 to focus on data center and AI.

    Marvell's target customer base includes Original Equipment Manufacturers (OEMs) and Original Design Manufacturers (ODMs) across various sectors, major Cloud Service Providers (hyperscalers) like AWS, Microsoft Azure, and Google Cloud, enterprise data center operators (e.g., Dell, HPE, Cisco), and telecom equipment providers (e.g., Nokia, Ericsson).

    4. Stock Performance Overview

    Marvell Technology (MRVL) has demonstrated significant growth and notable price movements over the past decade, driven largely by its strategic shift towards data infrastructure and artificial intelligence (AI) solutions. While the stock has experienced periods of substantial gains, it has also been subject to volatility and specific market-driven corrections.

    1-Year Stock Performance (October 2024 – October 2025)

    Over the past year, Marvell Technology (MRVL) has delivered a positive return, with a 12-month total return of 16.96% or a 23.11% increase in stock price. However, this period has been marked by significant volatility. The stock's current price as of October 2, 2025, is around $86.51 USD.

    • Notable Price Movements: MRVL reached its all-time high of $127.48 on January 22, 2025, before experiencing a significant correction, losing approximately a third of its value due to macroeconomic concerns and a cautious company outlook.
    • Key Events: The stock tumbled 15% after its March 2025 earnings despite beating expectations, as the forward outlook disappointed. A notable jump occurred after the June 2025 "Custom AI event," where analysts reacted positively to a "stronger, more diverse pipeline" for AI accelerator chips. August 2025 earnings showed record revenue, primarily fueled by strong AI demand, and the divestiture of its Automotive Ethernet business was announced. In September 2025, a new $5 billion stock repurchase program and a $1 billion accelerated share repurchase led to a significant rally (approximately 30% in the month). On October 1, 2025, TD Cowen downgraded MRVL to "Hold," causing a decline, but the stock rebounded the next day due to a broader semiconductor rally driven by OpenAI's partnership announcements.
    • Current Year-to-Date (YTD) Performance (2025): Despite the positive 1-year return, Marvell's stock has been down significantly year-to-date in 2025, ranging from -21.56% to -24.6%.
    • 52-Week Range: The 52-week high is $127.48, and the 52-week low is $47.09.

    5-Year Stock Performance (October 2020 – October 2025)

    Over the past five years, Marvell Technology has shown substantial growth, with a total return of 114.37% or 116.33%. An investment of $1,000 made five years ago would be worth approximately $2,163.30 today.

    • Key Events and Trends: This period saw Marvell's significant strategic transformation under CEO Matt Murphy, focusing on high-performance networking and compute for data centers and AI. Major acquisitions like Inphi (late 2021) and Innovium (2021) significantly bolstered its optical and networking businesses. Marvell experienced strong growth years in 2020, 2021, 2023, and 2024, but saw a significant decline in 2022 (-57.49%) due to broader industry corrections. The data center segment became the primary revenue driver, comprising over 70% of revenue in fiscal year 2025.

    10-Year Stock Performance (October 2015 – October 2025)

    Marvell Technology's stock performance over the past decade has been exceptionally strong, with a total return of 923.25% or 931.3% between October 1, 2015, and October 1, 2025. The compound annual growth rate (CAGR) for this period stands at 25.74%.

    • Key Events and Impact: The appointment of Matt Murphy as CEO in 2016 marked a turning point, leading to the company's pivot towards high-growth areas. The Cavium acquisition in 2018 was foundational to its current focus on AI data center infrastructure. Despite short-term volatility, the overarching trend for the decade has been robust upward movement, driven by successful strategic repositioning and a strong presence in emerging technology markets.

    Key Factors Impacting MRVL Stock

    The stock's performance is heavily influenced by AI and data center demand, strategic acquisitions and divestitures, product innovation (especially in interconnects and custom ASICs), market volatility, and analyst sentiment around earnings reports.

    5. Financial Performance

    Marvell Technology (MRVL) recently reported its second-quarter fiscal year 2026 financial results on August 28, 2025, demonstrating significant growth driven primarily by strong demand in its data center segment, particularly from AI.

    Latest Earnings Report (Q2 Fiscal Year 2026 – Reported August 28, 2025)

    • Revenue: Marvell reported record net revenue of $2.006 billion for Q2 FY2026, exceeding guidance and representing a substantial 58% increase year-over-year and 6% sequential growth.
    • Earnings Per Share (EPS): GAAP diluted income per share was $0.22, while non-GAAP diluted income per share reached a record $0.67, up 123% year-over-year and slightly above analyst estimates.
    • Third Quarter Fiscal 2026 Outlook: Marvell anticipates net revenue for Q3 FY2026 to be approximately $2.060 billion, +/- 5%, representing an expected 36% year-over-year growth at the midpoint. Non-GAAP diluted income per share is expected to be $0.69 to $0.79.

    Revenue Growth Trends

    Marvell is experiencing robust revenue growth, largely fueled by its data center business and AI demand. The data center end market alone grew 69% year-over-year in Q2 FY2026 and now accounts for 74% of total revenue. Overall, revenue for the twelve months ending July 31, 2025, was $7.235 billion, a 37.05% increase year-over-year. Annual revenue for fiscal year 2025 was $5.767 billion, a 4.71% increase from 2024. Management expects continued growth into Q3 FY2026 across all end markets, with consolidated revenue forecasted to grow 14% sequentially.

    Gross and Operating Margins

    Marvell has demonstrated expanding margins in its latest report:

    • Gross Margin: For Q2 FY2026, GAAP gross margin was 50.4%, and non-GAAP gross margin was 59.4%, indicating strong cost of goods sold management. The average gross profit margin from fiscal years 2021 to 2025 was 48.4%.
    • Operating Margin: The non-GAAP operating margin expanded significantly by 870 basis points year-over-year to 34.8% in Q2 FY2026.

    Debt Levels

    As of July 2025, Marvell reported a total debt of $4.77 billion USD. In May 2025, net debt was approximately $3.35 billion. The debt-to-equity ratio for the quarter ending July 31, 2025, was 0.3. While the company carries a notable level of debt, its large market capitalization of $66.5 billion (as of May 2025) suggests these liabilities may not pose a significant threat.

    Cash Flow Generation

    Marvell Technology exhibits strong cash flow generation:

    • Operating Cash Flow: For Q2 FY2026, cash flow from operations was $461.6 million, a significant increase from $333 million in the previous quarter.
    • Free Cash Flow: Annual free cash flow for 2025 was $1.397 billion, representing a 35.04% increase from 2024. The latest twelve months' free cash flow yield is 2.4%. Marvell generated $400 million free cash flow per quarter.

    Key Valuation Metrics

    • P/E Ratio: The current GAAP P/E ratio cannot be calculated as Marvell has reported a net loss on a GAAP basis over the last year. However, the estimated forward P/E for 2026 is 29.45, with further reductions projected for 2027 (24.42) and 2028 (19.65).
    • P/S Ratio: Marvell's P/S ratio is 10.03, with a forward P/S of 8.16.
    • EV/EBITDA: The stock's EV/EBITDA ratio is 35.82. For the latest twelve months, the EV/EBITDA ratio is 49.3x.

    In summary, Marvell Technology is demonstrating strong top-line growth, particularly driven by its AI-related data center products, alongside expanding gross and operating margins. While it carries a substantial debt load, its cash flow generation appears healthy, and valuation metrics suggest a potentially more attractive entry point compared to some peers, especially considering its exposure to the growing AI infrastructure market.

    6. Leadership and Management

    Marvell Technology, Inc. (MRVL) is steered by a seasoned leadership team and a committed Board of Directors, all working to advance its strategic focus on data infrastructure solutions.

    CEO and Key Leadership Team
    Matt Murphy has served as President and Chief Executive Officer (CEO) and Chairman of the Board since July 2016. With over nine years at the helm, Murphy has been instrumental in Marvell's strategic transformation, refocusing the company on high-growth markets such as cloud, 5G, and automotive (prior to its divestiture). His compensation reflects his significant role, with a large portion tied to performance-based bonuses, and he holds a notable stake in the company.

    The executive team, which guides strategic direction and operations, includes:

    • Matt Murphy: Chairman and Chief Executive Officer
    • Willem Meintjes: Executive Vice President and Chief Financial Officer (CFO)
    • Chris Koopmans: President and Chief Operating Officer (COO)
    • Sandeep Bharathi: President, Data Center Group
    • Mark Casper: Executive Vice President and Chief Legal Officer
    • Dean Jarnac: Executive Vice President, Chief Sales Officer
    • Gary Ignatin: Executive Vice President, Corporate Development
    • Noam Mizrahi: Executive Vice President, Corporate Chief Technology Officer (CTO)
    • Janice Hall: Executive Vice President, Chief Human Resources Officer
    • Pani Dixon: Chief Accounting Officer and Senior Vice President
    • Loi Nguyen: EVP & General Manager, Cloud Optics Business Group
    • Achyut Shah: Senior Vice President and General Manager, Multimarket Business Group
    • Will Chu: Senior Vice President and General Manager, Custom Cloud Solutions Business Unit

    The Marvell Technology Executive Team holds a "C+" rating on Comparably, placing it in the top 50% of similar-sized companies.

    Board of Directors
    The Board of Directors comprises twelve members, including CEO Matt Murphy, with an average tenure of 3.5 years, indicating an experienced board. The board provides strategic guidance and oversight, with a strong commitment to corporate social responsibility and ethical business practices. Notable board members include Sara Andrews, Tudor Brown, Brad Buss (Lead Independent Director), and Richard Mclaughlin, among others. The Nominating & Governance Committee oversees sustainability, receiving quarterly updates on the company's performance.

    Corporate Strategy
    Marvell's corporate strategy has undergone a significant transformation, now centered on being a leading provider of end-to-end data infrastructure solutions (compute, network, security, storage) optimized for customer needs. Key strategic pillars include:

    • Focus on Data Infrastructure: Delivering technology for key infrastructure providers, recognizing data infrastructure as the foundation of future economies.
    • Customized Solutions: Emphasizing customized, innovative solutions for individual cloud customers, with substantial projected growth in data center and AI silicon.
    • Growth Markets: Heavy investment in lucrative markets like cloud, 5G, and automotive (prior to divestiture), anticipating double-digit growth.
    • Strategic Acquisitions and Divestitures: Leveraging M&A (e.g., Cavium, Inphi) to align with its data infrastructure strategy and divesting non-core assets (e.g., Automotive Ethernet) to streamline focus.
    • Innovation: Concentrating on 2nm and next-generation silicon designs, with plans to develop AI chips for new clients.

    In fiscal year 2024, Marvell reported revenues of $5.51 billion, reflecting its significant presence. The data center business has tripled since 2023, and its AI franchise has grown over six times.

    Reputation Regarding Governance and Management Effectiveness
    Marvell Technology is committed to sound corporate governance and ethics, with various guidelines, codes, and policies in place. The company released its inaugural Environmental, Social and Governance (ESG) Report in 2022. While Marvell has faced past challenges related to governance and accounting, including SEC charges for account manipulation in 2008 and 2019, the company has shown a capacity for change and improvement. The "Marvell of 2023" is considered "quite a different company" from its 2015 iteration from a governance perspective. A positive indicator of its current reputation is its inclusion in Newsweek and Statista's global list of the Most Trustworthy Companies for 2025.

    7. Products, Services, and Innovations

    Marvell Technology (MRVL) is a prominent semiconductor company specializing in data infrastructure solutions across high-growth markets. Its comprehensive product and service offerings, robust innovation pipeline, significant R&D investments, and extensive patent portfolio collectively contribute to a strong competitive edge.

    Current Product and Service Offerings

    Marvell designs and develops advanced chips and system-on-chip (SoC) solutions fundamental to modern data infrastructure. Key product segments and services include:

    • Networking Solutions: Leadership in Ethernet and high-speed networking chips, offering switching and routing solutions that enhance connectivity in data centers, enterprise networks, and cloud infrastructure. Products include coherent DSPs, data center switches, Ethernet controllers, and PAM DSPs.
    • Storage Solutions: SSD controllers, HDD chips, Fibre Channel, and storage accelerators for cloud providers and enterprises.
    • Custom ASICs (Application-Specific Integrated Circuits): Specialized chips for AI, cloud computing, and enterprise applications, collaborating with leading tech firms to develop custom silicon tailored for hyperscalers and AI workloads.
    • 5G and Wireless Infrastructure: 5G baseband and radio processing chips for telecom providers.
    • Automotive Solutions: Ethernet-based chips for advanced driver-assistance systems (ADAS) (prior to divestiture).
    • Security Solutions: Integrated security solutions within its chip designs.
    • Marvell Government Solutions: Specialized solutions for government applications.

    Innovation Pipelines

    Marvell's innovation efforts are heavily concentrated on advancing AI infrastructure and next-generation data handling capabilities:

    • Advanced Packaging Platforms: Introduced a 2.5D advanced packaging platform for multi-die architectures, lowering total cost of ownership (TCO) for custom AI accelerator silicon.
    • High-Speed Interfaces: Unveiled a 2nm 64 Gbps bi-directional die-to-die interface IP, designed to power next-generation XPUs.
    • Next-Generation DSPs and SRAM: Achieved volume shipments for its 200G per lane 1.6T PAM4 DSPs and announced a 2nm custom SRAM for future AI infrastructure.
    • AI-Optimized Chips and Custom Silicon: Core focus on developing AI-optimized chips and custom silicon solutions for hyperscalers.
    • Collaborations: Engages in collaborations, such as with NVIDIA's NVLink Fusion technology, to enhance performance for cloud providers.

    Significant R&D Investments

    Marvell demonstrates a profound commitment to innovation through substantial R&D investments, exceeding $1.95 billion in fiscal year 2025 (approximately 33% of revenue). This is notably higher than some competitors and is directed towards hyperscaler programs, custom silicon development, and market diversification.

    Patent Portfolio

    Marvell is an intellectual property (IP) leader with approximately 16,347 to 20,293 patents and patent applications globally, with over 62% active. Its patents cover semiconductor design, data storage, and networking technologies. Strategic acquisitions like Inphi and Cavium have bolstered its IP assets, and Marvell has been recognized as a Derwent Top 100 Global Innovator.

    Contribution to Competitive Edge

    Marvell's competitive edge stems from:

    • Specialized Semiconductor Solutions: Focus on high-performance chips for data infrastructure.
    • Strategic Focus on High-Growth Markets: Pivot towards cloud computing, 5G, AI, and automotive.
    • Continuous Technological Innovation: Cutting-edge chip designs, custom solutions, and advancements in node technologies.
    • Deep Hyperscaler Partnerships: Collaborations with major cloud providers for custom silicon development.
    • High R&D Intensity: Aggressive R&D spending to stay ahead of market needs.
    • Robust Patent Portfolio: Extensive IP protection creating barriers to entry.
    • Strategic Acquisitions: Expanded capabilities and market presence through M&A.

    8. Competitive Landscape

    Marvell Technology (MRVL) operates within a highly competitive and rapidly evolving semiconductor industry, specializing in data infrastructure solutions for high-growth markets. The company faces significant competition from industry giants across its various segments.

    Main Industry Rivals

    Marvell Technology's primary competitors vary across its core product segments:

    • NVIDIA Corporation (NVDA): A dominant force in AI GPUs, NVIDIA competes with Marvell in AI applications and data center infrastructure.
    • Broadcom Inc. (AVGO): A leading wired and wireless communications semiconductor company, Broadcom is a direct competitor in networking, communication chips, and AI-driven networking solutions.
    • Advanced Micro Devices (AMD): Competes in the CPU and GPU markets, especially in data centers and AI.
    • Intel Corporation (INTC): A major player in CPU and system-on-chip (SoC) markets, Intel competes with Marvell in various semiconductor applications, including data centers.
    • Qualcomm Incorporated (QCOM): A key rival in 5G, wireless communication, and integrated circuit technologies.
    • Micron Technology Incorporated (MU): Competes in memory and storage chips, especially in AI and data center markets.
    • NXP Semiconductors N.V. (NXPI) and Texas Instruments (TXN): Significant competitors in the automotive chip market (prior to Marvell's divestiture of its automotive Ethernet business).
    • Other Competitors: MediaTek, Silicon Motion Technology Corporation, Western Digital, Kioxia, Synaptics, and STMicroelectronics. Cloud providers developing in-house chip solutions (e.g., Amazon, Microsoft, Google) also represent a form of competition.

    Estimated Market Share

    • Overall Company Market Share: As of Q2 2025, Marvell Technology Inc.'s overall market share, based on total revenue, was approximately 1.47%.
    • Data Center Segment: This is Marvell's primary growth driver, accounting for about 70-73% of its revenue. In custom AI ASICs for data centers, Marvell's market share was less than 5% in calendar year 2023, but management aims to increase this to 20% by 2028. Marvell expects to double its 10% market share in the broader data center market.

    Competitive Strengths of Marvell Technology

    1. Strategic Focus on High-Growth Data Infrastructure Markets: Specialization in cloud, 5G, automotive, and enterprise networking.
    2. Technological Innovation and Advanced Chip Design: Cutting-edge designs, custom solutions, and strong R&D, including a 2nm 64 Gbps bi-directional die-to-die (D2D) interface for AI/ML.
    3. Strategic Acquisitions: Acquisitions like Inphi and Cavium significantly enhanced its portfolio in high-speed interconnects and data center networking.
    4. Robust Customer Relationships and Custom Silicon Expertise: Strong partnerships with hyperscale data center operators for custom AI ASICs.
    5. Broad Networking Silicon Portfolio: One of the broadest portfolios globally, encompassing switching, processing, and optical chips.
    6. Diversified Revenue Streams: Mitigation of risk through revenue spread across multiple industries.
    7. Strong Financial Position: Consistent revenue growth and a solid financial foundation.

    Competitive Weaknesses of Marvell Technology

    1. Dependence on Key Customers: Reliance on a few hyperscaler customers makes the company vulnerable to shifts in their strategies or increased in-house chip development.
    2. Intense and Evolving Competition: Fierce competition from established giants and emerging startups.
    3. Vulnerability to Market Cycles: Susceptibility to the inherent cyclicality of the technology and semiconductor industries.
    4. Limited Product Differentiation (in some areas): Challenges in differentiating all products in a highly competitive broader semiconductor market.
    5. High R&D Dependence and Costs: Success hinges on continuous innovation requiring substantial and risky R&D investment.
    6. Performance Discrepancies Across Segments: While data center shows explosive growth, other segments have experienced declines, indicating potential over-reliance.
    7. Limited IP Stack: Potentially a more limited IP stack compared to some larger, more diversified competitors.

    Comparison of Competitive Strengths and Weaknesses Against Peers

    Marvell's competitive posture is defined by its focused strategy on data infrastructure and prowess in custom silicon and networking. Against diversified giants like Intel and Broadcom, Marvell's strength is its specialized depth, though these larger players have more resources and diversified revenue. Against AI/compute leaders like NVIDIA and AMD, Marvell provides critical interconnect and custom ASIC solutions that enable the AI infrastructure powered by their GPUs. The challenge lies in NVIDIA's immense R&D scale and market dominance.

    9. Industry and Market Trends

    The semiconductor industry is a foundational element of the global economy, powering advancements across numerous sectors. For Marvell Technology (MRVL), understanding the intricate web of sector-level trends, macro drivers, supply chain dynamics, cyclical effects, and the regulatory landscape is crucial for strategic positioning and sustained growth.

    Overview of Sector-Level Trends
    The semiconductor industry is experiencing robust growth, projected to reach $697 billion in 2025 and potentially $1 trillion by 2030. Key trends include:

    • Artificial Intelligence (AI) and High-Performance Computing (HPC): Leading drivers of growth, creating significant demand for advanced logic and high-bandwidth memory. AI workloads make data centers the second-largest market for semiconductors. Marvell is a direct beneficiary, with its data center segment and custom AI ASICs driving growth.
    • 5G Technology: Continued rollout creates opportunities for hyper-connected applications, boosting demand for telecom equipment chips.
    • Internet of Things (IoT): Proliferation of connected devices drives demand across industries.
    • Automotive Industry: Electrification, autonomous driving, and ADAS make automotive a rapidly growing consumer of semiconductors.
    • Advanced Packaging and Chiplets: Critical for performance improvements as Moore's Law limits are approached. Marvell focuses on 2nm and next-generation silicon designs.
    • Sustainability: Growing push for sustainable chip design and manufacturing.

    Macro Drivers
    Broader macroeconomic forces heavily influence the semiconductor industry:

    • Digital Transformation and Cloud Computing: Ongoing global digital transformation and reliance on cloud-based models drive demand for HPC and data storage solutions. Marvell's partnerships with cloud providers for custom AI silicon align with these drivers.
    • Economic Growth and Consumer Spending: Closely linked to global GDP. Economic growth boosts spending on electronics, increasing semiconductor demand.
    • Geopolitical Tensions: Semiconductors are strategic assets, leading to trade restrictions, export controls, and efforts to onshore manufacturing for national security.
    • Electrification: Broader trend in industrial systems and renewable energy systems creates focus for power electronics.

    Supply Chains
    The global semiconductor supply chain is complex, capital-intensive, and faces challenges:

    • Geopolitical Risks and Trade Restrictions: US-China trade tensions, tariffs, and export controls disrupt supply chains, affecting costs and market access.
    • Supply-Demand Imbalances: Rapid digital transformation and foundry capacity limitations lead to mismatches.
    • Decentralized Manufacturing and Reshoring: Countries are investing in domestic manufacturing (e.g., U.S. CHIPS Act) to improve resilience, but this introduces challenges like workforce shortages and increased costs.
    • Construction Costs and Delays: Building new fabs is expensive and time-consuming.
    • Talent Shortages and Energy Constraints: Persistent shortage of skilled engineers and energy-intensive production.

    Cyclical Effects
    The semiconductor industry is inherently cyclical, with "boom and bust" cycles typically lasting around four years. These are driven by supply-demand imbalances and macroeconomic impacts. Despite short-term fluctuations, the long-term outlook remains strong due to fundamental structural growth drivers.

    Regulatory Landscape
    Governments are increasing scrutiny and regulation due to the industry's strategic importance:

    • CHIPS Acts and Incentives: U.S. CHIPS and Science Act ($52 billion+), European Chips Act, and similar initiatives aim to boost domestic manufacturing and R&D. Marvell is positioned to benefit.
    • Export Controls and Trade Restrictions: Strict controls on advanced semiconductor technology, particularly targeting China, to curb technological advancements by perceived adversaries.
    • Antitrust and M&A Scrutiny: Agencies monitor mergers and acquisitions for competitive impacts.
    • Environmental Regulations: Industry subject to environmental standards (RoHS, REACH).
    • Intellectual Property Rights: Critical regulations influencing licensing and competitive landscapes.

    Relevance to Marvell Technology (MRVL)
    Marvell is strategically positioned to capitalize on many of these trends. Its specialization in data infrastructure solutions, particularly the data center market (73% of revenue), is driven by custom AI ASICs and interconnects. Marvell holds a dominant position in optical connectivity chips (50% of data center revenue) and is at the forefront of technological innovation with its 2nm 64 Gbps bi-directional die-to-die interface. While benefiting from strong demand, Marvell must navigate industry cyclicality and the complex regulatory environment.

    10. Risks and Challenges

    Marvell Technology (MRVL) faces a multifaceted risk landscape that encompasses operational, regulatory, potential controversies, and broader market risks. These challenges are particularly pertinent given its strategic pivot towards high-growth infrastructure markets like AI and data centers.

    Operational Risks

    Marvell Technology's operational risks are primarily tied to the highly competitive and rapidly evolving semiconductor industry:

    • Intense Competition: Marvell operates in intensely competitive markets, including infrastructure, cloud, data center, and networking. Key competitors in custom AI chips include NVIDIA, AMD, Broadcom, and even cloud providers developing in-house solutions.
    • Customer Concentration and In-house Development: A significant risk is reliance on key customers, particularly hyperscalers like Amazon Web Services (AWS) and Microsoft, for custom AI accelerator chips. Increased in-house chip development by these providers could reduce demand for Marvell's custom silicon.
    • Supply Chain Vulnerabilities: Marvell's fabless model depends on third-party manufacturers (e.g., TSMC), exposing it to risks like component shortages, raw material volatility, and geopolitical disruptions. Price increases implemented to mitigate rising production costs could strain customer relationships.
    • Product Development and Innovation: Success relies on continuous innovation and significant R&D investment. Missteps or delays in developing next-generation solutions (e.g., custom AI silicon, optical interconnects) could lead to market share loss.
    • Profitability Challenges: Despite revenue growth, Marvell has reported GAAP net losses and negative net margins, reflecting competitive pressures and high R&D/operating expenses. Gross margins have also faced pressure from custom AI silicon ramp-up.
    • "Lumpiness" of Custom Silicon Business: The unpredictable nature of custom silicon orders and the lack of clarity regarding follow-on design wins raise questions about long-term stability and visibility.
    • Technical Challenges: Reports of setbacks with high-speed SerDes technology, critical for networking and custom AI chips, have led to strained customer relationships and production delays.

    Regulatory Risks

    Marvell Technology operates in a global environment subject to various regulatory challenges:

    • US-China Trade Tensions and Export Controls: With 43% of fiscal year 2025 revenue from China, Marvell is highly sensitive to US-China trade tensions, export controls (e.g., on advanced computing components), tariffs, and market access regulations.
    • International Operations: Global operations expose it to exchange rate risks and diverse trade policies.
    • Intellectual Property (IP) Disputes: Marvell has a history of significant IP litigation (e.g., the Carnegie Mellon University patent infringement lawsuit), highlighting ongoing risks of litigation and associated costs.
    • Compliance and Legal Liabilities: Subject to litigation and legal liabilities, including potential securities class action lawsuits.
    • Cyber Security: Risks related to securing digital assets and protection from cyber attacks.

    Potential Controversies

    While recent direct controversies are not extensively highlighted, historical events and ongoing operational aspects could lead to potential controversies:

    • Past Litigation and Reputation: The significant patent infringement lawsuit with Carnegie Mellon University, involving a multi-billion dollar verdict and subsequent settlement, could affect the company's reputation and shareholder trust.
    • Data Privacy Issues: Concerns noted regarding data privacy issues could impact investor sentiment.

    Broader Market Risks

    Marvell Technology's performance is also susceptible to wider economic and industry-specific market dynamics:

    • Semiconductor Industry Cycles: The cyclical nature of the industry can lead to significant fluctuations in financial results.
    • Economic Downturns and Geopolitical Events: Macroeconomic and political uncertainties (e.g., trade tensions, economic slowdowns, interest rates) can disrupt supply chains, affect customer spending, and increase operational costs.
    • Market Volatility: Marvell's stock price has historically been highly volatile, influenced by earnings, analyst sentiment, and broader market shifts (beta of 1.59).
    • High Investment Costs in AI: While AI offers growth, it requires substantial capital investment in a highly competitive market.
    • Slowdown in Legacy Markets: Potential slowdowns in legacy storage, enterprise networking, and carrier markets could impact overall revenue growth.

    11. Opportunities and Catalysts

    Marvell Technology (MRVL) is strategically positioned in the semiconductor industry, focusing on data infrastructure solutions that span the data center core to the network edge. The company's growth is primarily driven by its advancements in artificial intelligence (AI), strategic acquisitions, and expansion into high-growth markets.

    Growth Levers

    Marvell's growth is propelled by several key factors:

    • AI Accelerators and Optical Connectivity: AI is a primary driver, particularly custom accelerators and its dominant position in optical connectivity chips for AI infrastructure. Significant accelerator growth is expected from major cloud providers (AWS, Microsoft), with new projects anticipated. Marvell is a clear second option to Broadcom in custom AI accelerators. Its data center business, heavily influenced by AI, has tripled since 2023, with AI-related revenue growing sixfold.
    • Data Center Portfolio: Beyond AI accelerators, Marvell's broader data center portfolio, including optical interconnects (50% of data center revenue), storage, cloud switching, and security solutions, contributes significantly. Advanced interconnect solutions are crucial for massive data volumes and ultra-fast transfers required by AI/ML.
    • Technological Innovation: Continued innovation, demonstrated by the industry's first 2nm 64 Gbps bi-directional die-to-die (D2D) interface, expected to enhance machine learning and AI applications. Investments in scale-up switches, DSPs for AECs, AOCs, and retimers for PCI Ethernet and UA link.
    • Enterprise Networking and Carrier Infrastructure Recovery: Solid recovery in these markets, with sequential and year-over-year growth, attributed to normalizing inventory and strong adoption of refreshed product portfolios. Double-digit growth is expected.

    New Markets

    Marvell is actively expanding into and capitalizing on several new and emerging markets:

    • AI Infrastructure: Most significant new market, driven by demand for custom silicon from hyperscalers. Custom AI design activity is at an all-time high, with over 50 new opportunities across more than 10 customers. Potential shift towards smaller, specialized AI models could benefit tailored products.
    • 5G Infrastructure: Strengthening position with high-speed data movement solutions, partly due to the Inphi acquisition.
    • Cloud Switching and Security: Emerging growth opportunities within the data center market.

    M&A Potential

    Marvell has a history of strategic acquisitions to enhance its portfolio:

    • Past Acquisitions: Cavium (2018) transformed Marvell into a broader infrastructure semiconductor provider. Inphi (2021) strengthened its cloud data center and 5G infrastructure offerings with optical interconnects. Innovium (2021) for networking solutions. These bolstered its IP portfolio.
    • Strategic Focus: Acquiring companies globally to become a leading infrastructure provider for faster data movement, processing, and security.
    • Divestiture and Capital Allocation: Recent divestiture of Automotive Ethernet business for $2.5 billion provides financial flexibility for further strategic acquisitions or enhanced stock repurchase programs. A new $5 billion stock repurchase authorization and immediate $1 billion accelerated share repurchase signal management confidence.

    Near-term Events

    Investors should monitor several near-term events:

    • Upcoming Earnings: Next earnings report anticipated around November 27, 2025, or December 2, 2025, for Q3 FY2026. Q2 FY2026 reported record revenue ($2.006 billion, up 58% YoY) and record non-GAAP diluted EPS ($0.67, up 123% YoY), driven by AI demand and recovery in other segments. Q3 FY2026 outlook anticipates net revenue of $2.060 billion +/- 5% and non-GAAP diluted EPS of $0.74.
    • Product Launches/Showcases:
      • ECOC 2025 Showcase: Recently showcased its interconnect portfolio for accelerated infrastructure (September 28 – October 2, 2025), including Co-packaged Optics (CPO) for AI scale-up, COLORZ 800G ZR/ZR+ coherent pluggable optical modules, and the 200G/Lambda 1.6T PAM4 optical interconnect with the 3nm PAM4 DSP (Marvell Ara).
      • CXL Ecosystem Expansion: On September 2, 2025, Marvell extended its CXL ecosystem leadership with Structera interoperability across major memory and CPU platforms.
    • Strategic Partnerships:
      • Hyperscaler Collaborations: Continued collaboration with AWS and Microsoft for custom AI silicon. Despite a recent downgrade citing visibility concerns, Marvell's CEO reaffirmed bullishness.
      • AI-Focused Alliances: Partnered with Rebellions for energy-efficient AI systems and with NVIDIA for advanced AI infrastructure solutions. Broader industry partnerships (e.g., OpenAI with Samsung and SK Hynix) are positive for the semiconductor sector.

    12. Investor Sentiment and Analyst Coverage

    As of October 2, 2025, Marvell Technology (MRVL) exhibits a mixed but generally "Moderate Buy" to "Buy" sentiment among Wall Street analysts, alongside active, though sometimes contradictory, movements from institutional investors and varied discussions among retail investors.

    Wall Street Analyst Ratings and Price Targets

    Wall Street analysts generally hold a positive outlook on Marvell Technology. Based on ratings from 31 to 34 analysts over the last 12 months, the consensus rating for MRVL is either "Moderate Buy" or "Buy."

    • Consensus Breakdown: Approximately 21 to 24 analysts have issued "Buy" ratings, 2 have given "Strong Buy" ratings, and 7 to 11 have rated the stock as "Hold." Only a few sources mention a "Sell" rating.
    • Average Price Target: The average 12-month price target ranges from $88.20 to $95.91, implying an upside potential of approximately 5.45% to 8.57% from recent price levels. Some targets are as high as $149.00-$150.00, with lows around $66.00-$67.00.
    • Recent Analyst Moves: On October 1, 2025, TD Cowen downgraded MRVL from "Buy" to "Hold" and reduced its price target from $90 to $85, citing limited visibility in custom XPU business and increasing competition. Conversely, Needham Capital recently raised its price target to $95, and Deutsche Bank increased its target to $90. Many analysts still see long-term growth potential, particularly benefiting from strong IP and AI demand, though some suggest "cleaner stories elsewhere" due to order lumpiness and competition.

    Recent Moves by Hedge Funds and Institutional Investors

    Institutional investors hold a significant portion of Marvell Technology's shares, ranging from approximately 80% to 84% of total outstanding shares, with over 1,300 to 2,200 institutions holding positions.

    • Overall Holdings Trend: Recent 13F filings (June 2025) show a slight decrease in overall institutional ownership from 82.6% in March 2025 to 82.0%. However, the number of institutions increasing positions (739-807) was higher than those decreasing (441-558).
    • Largest Holders: FMR LLC, Vanguard Group Inc., and BlackRock, Inc. are consistently top institutional investors.
    • Significant Activity (June 2025 filings): Notable buyers included UBS Asset Management, DZ BANK AG, and Union Bancaire Privee UBP SA (which grew its stake by 129.2%). Sellers included FMR LLC, Goldman Sachs Group Inc., and JPMorgan Chase & Co.
    • Hedge Fund Specifics: Marvell holdings among 19 tracked hedge funds increased by 2.0 million shares in the last quarter, with funds managed by Ray Dalio, Philippe Laffont, and Larry Robbins significantly adding to positions.
    • Insider Trading: Over the past six months, insider trading shows more sales than purchases (22 sales vs. 1 purchase). However, the CFO and another insider recently purchased shares in September 2025, indicating some insider confidence.

    General Overview of Retail Investor Sentiment and Chatter

    Retail investor sentiment for Marvell Technology appears broadly positive, though with some underlying volatility.

    • Overall Sentiment Scores: Marvell holds a "positive" sentiment score of 90 out of 100 on some investment forums, outperforming most industry peers.
    • Drivers of Positive Sentiment: A significant boost came from the $5 billion stock repurchase authorization and $1 billion accelerated share repurchase, signaling management confidence. Bullish commentary on AI and data center-related growth (data center business tripled, AI revenue sixfold) also fueled optimism. Some observe bullish technical momentum.
    • Sources of Mixed/Negative Chatter: Frustration exists due to stock volatility and price drops on forums like Investing.com. Concerns about "lumpy orders" for custom AI accelerators and competitive pressures are mentioned. Discussions often revolve around earnings reports, with some expecting large jumps only to see declines. Uncertainty regarding future sales to major cloud providers also generates negative sentiment.
    • Increased Interest: MarketBeat data indicates a recent surge in engagement, with media mentions increasing by 14.3% and new followers by 217.6% over the last week.

    13. Regulatory, Policy, and Geopolitical Factors

    Marvell Technology (MRVL) operates within a complex web of regulatory and geopolitical factors that significantly impact its business operations, supply chain, market access, and strategic decisions. These factors include stringent export controls, evolving trade policies, government incentives, and a challenging geopolitical landscape marked by U.S.-China tech rivalry.

    Relevant Laws and Compliance Requirements

    Marvell must adhere to a broad spectrum of international and national laws:

    • Export Controls: Marvell's "Dual-Use Items" (civil and military applications) are subject to strict export and import controls, particularly under U.S. Export Administration Regulations (EAR) and OFAC regulations.
      • U.S. Export Controls on China: Comprehensive semiconductor export controls, especially since October 2022, target China's access to advanced computing and AI chips. Marvell is committed to compliance, and these regulations pose a direct risk to market access in China.
      • Military End-Users/End-Uses: Export licenses may be required for products destined for military use in countries like China and Russia.
    • Environmental Compliance: Products comply with RoHS, EU REACH, HALOGEN Free, and POPs regulations. As a fabless company, reliance is on suppliers for material compliance.
    • Data Privacy and Other Regulations: Evolving legal and regulatory environment for AI is expected to increase compliance costs.
    • Shariah Compliance: As of September 2025, Marvell's stock is considered Shariah-compliant.

    Government Incentives

    Governments are implementing significant incentive programs, and Marvell is positioned to potentially benefit:

    • U.S. CHIPS and Science Act: Authorizes approximately $280 billion to boost domestic semiconductor research and manufacturing, including $39 billion in subsidies and a 25% investment tax credit. Marvell, with its focus on custom silicon for data centers and networking, aligns with these goals.
    • European Chips Act: Aims to enhance Europe's semiconductor competitiveness with over €43 billion in investment.
    • Tax Incentives: Marvell benefits from reduced income tax rates in certain jurisdictions, requiring commitments to headcount and investment. Changes like OECD's Pillar Two framework could impact these, but Marvell is negotiating alternative programs.

    Geopolitical Risks and Opportunities

    Geopolitical dynamics present both risks and opportunities:

    • U.S.-China Tech Rivalry: The most substantial risk. With 43% of FY2025 revenue from China, Marvell is highly sensitive to trade tensions and export controls, which pose a "material risk" to its market access.
    • Supply Chain Disruptions: Global geopolitical risks contribute to fragility in supply chains, necessitating agility.
    • Talent Shortage: Global semiconductor industry faces an escalating shortage of skilled workers, intensified by geopolitical shifts and "chip sovereignty" pushes.
    • Geopolitical Influence on Investment: Intense global competition for semiconductor talent and manufacturing influences investment flows and technological roadmaps.
    • Opportunities through Diversification and AI Focus: Marvell's pivot towards AI and data centers positions it to capitalize on booming demand. Diversification and securing U.S.-based design wins (e.g., custom silicon for hyperscalers) help mitigate over-reliance on single regions and reduce supply chain vulnerabilities.

    Trade Policies

    Trade policies directly influence Marvell's international business:

    • Tariffs: Discussions around potential tariffs (e.g., 1:1 ratio of domestic to imported chips) could compel more domestic production, disrupting supply chains and increasing costs.
    • Export and Import Restrictions: Adherence to international trade compliance means screening transactions to avoid restricted parties or countries. These controls can hinder sales to specific destinations.
    • National Security as a Driver: Many trade policies are driven by national security concerns, leading to a more fractured global supply chain.

    14. Outlook and Scenarios

    Marvell Technology (MRVL) has strategically pivoted its focus towards high-growth data center and AI markets. Its future outlook is shaped by its ability to capitalize on these trends while navigating competitive pressures and macroeconomic uncertainties.

    Bull Case Scenario

    The bullish outlook for Marvell Technology is primarily driven by its strong positioning in the rapidly expanding AI and data center segments.

    • AI and Data Center Dominance: Marvell is capitalizing on the AI boom through its custom silicon solutions for data centers and networking. Its data center revenue surged by 98% year-over-year in Q3 FY2025, with analysts projecting its AI chip sales to double in 2025.
    • Strategic Focus: The divestiture of its Automotive Ethernet business signifies a clear strategic pivot to concentrate on high-growth areas like data center, AI, enterprise networking, and carrier infrastructure. This streamlining allows Marvell to channel resources towards its core strengths.
    • Technological Innovation: Heavy investment in R&D, including 2nm chips and Co-Packaged Optics for AI infrastructure, with the industry's first 2nm 64 Gbps bi-directional D2D interface bolstering its competitive edge.
    • Strong Analyst Sentiment: Consensus ratings of "Buy" or "Moderate Buy" with an average price target forecasting upside, reinforced by expected significant year-over-year earnings growth from the AI story.
    • Diversified Client Base: Over 50 new AI opportunities across more than 10 clients, indicating robust demand and a diversified customer base.

    Bear Case Scenario

    Despite strong tailwinds, several factors contribute to a bearish outlook:

    • Visibility and Lumpiness of Custom Silicon: Limited visibility in Marvell's custom XPU (AI accelerators) business and the "lumpiness" of customer orders make it difficult to validate long-term data center estimates and secure follow-on design wins in next-generation programs, such as Amazon's Trainium 3.
    • Competitive Pressures: Increasing competition in the electro-optics segment and being a clear #2 option behind Broadcom in custom AI accelerators.
    • Profitability Concerns and Dividend Payout: Negative dividend payout ratio and reported GAAP net losses in fiscal years 2024 and 2025 raise questions about sustainability and consistent profitability.
    • Technical Challenges: Reports of setbacks with high-speed SerDes technology, critical for networking and custom AI chips, have led to strained customer relationships and production delays, including for Amazon's Trainium 3 ASIC and pushing mass production to the second half of 2026.
    • Macroeconomic Uncertainty: Heightened macroeconomic uncertainty led to the postponement of Investor Day from June 2025 to 2026, causing a temporary dip in stock price.
    • Analyst Downgrades: Some analysts have downgraded Marvell due to concerns about cloud visibility and the aforementioned "lumpiness" of its custom silicon business.

    Short-Term versus Long-Term Projections

    Short-Term Projections:

    • Mixed Analyst Ratings: Overall "Buy" consensus but with a mix of "Hold" and a few "Sell" ratings, indicating varied short-term confidence.
    • Revenue and EPS Growth: Forecasts for strong year-over-year EPS growth, with one estimate citing a 123% year-over-year jump for a recent quarter, fueled by the AI story. For next fiscal year, annual sales are expected to climb 40%, and EPS is forecast to grow 33.74%.
    • Price Targets: Average price targets around $88.20 to $93.71 suggest modest upside. The lowest target is $58.20, and the highest is $149.00.
    • Market Volatility: The stock has experienced recent volatility, with some analysts noting a 30% rally in the past month, suggesting a more balanced risk-reward profile in the immediate term.
    • Upcoming Earnings Focus: The stock's reaction to earnings reports heavily hinges on forward guidance, especially for Q3 FY26, and the clarity of the AI ramp. A "beat and raise" (revenue and EPS above guidance, plus strong future guidance) would be a strong bullish signal, while a "miss or guide down" would be bearish.

    Long-Term Projections:

    • AI Infrastructure as a Key Driver: Marvell's long-term growth is intrinsically linked to the expansion of data center and AI markets. The company is positioned to capitalize on the massive demand for high-performance, purpose-built chips needed for next-generation AI models and applications.
    • Sustained Growth: Marvell is investing in cutting-edge R&D and maintaining disciplined capital allocation, positioning it for sustained growth in the AI-driven data center era. The global AI chip market is projected to reach $701 billion in 2025, with Marvell as a critical complementary provider.
    • Long-Term Price Targets: Some long-term forecasts suggest significant increases, with prices potentially reaching $168.96 by 2029 (a 105.07% gain from a recent value) and even higher by 2030, 2040, and 2050.
    • Revenue and EPS Acceleration: Management expects revenue to accelerate in fiscal 2028 and 2029 as new customers come online, driven by tremendous accelerator growth. Analysts project earnings per share to grow 33.74% annually over the next three to five years.

    Assessment of Potential Strategic Pivots or Future Directions

    Marvell Technology has already executed a significant strategic pivot by divesting its Automotive Ethernet business, signaling a sharpened focus on high-growth data center and AI markets.

    Future strategic directions and potential pivots are likely to include:

    • Deepening AI Specialization: Continuing to deepen its specialization in custom silicon for AI accelerators and optical interconnects for data centers. This includes ongoing R&D in advanced nodes like 2nm and technologies like Co-Packaged Optics. The company is already making "great progress" in custom silicon solutions for AI, including collaborations with AMD and Intel on Compute Express Link (CXL) devices.
    • Expanding Hyperscaler Partnerships: Further strengthening its relationships with major hyperscale cloud providers (e.g., AWS, Microsoft) for custom AI silicon and networking solutions.
    • Geographic Expansion: Capitalizing on expanding AI infrastructure demand in regions like Asia-Pacific and the Middle East, as indicated by alliances with companies like Rebellions Inc.
    • Portfolio Streamlining: Continuing to evaluate and potentially divest other non-core assets to further streamline operations and maximize focus on high-growth infrastructure markets.
    • Addressing Supply Chain and Execution: Focusing on improving visibility in its custom XPU pipeline and addressing any "lumpiness" in customer orders to ensure more consistent growth and mitigate competitive risks in electro-optics.
    • Maintaining Capital Discipline: Balancing substantial R&D spending with capital discipline, including share buybacks and a consistent dividend, to fund innovation while maintaining profitability.

    In conclusion, Marvell Technology is strategically positioned to benefit from the secular growth in AI and data centers. While short-term challenges related to market visibility, competition, and past technical setbacks exist, the company's focused strategy, technological innovation, and strong market demand for its core products underpin a generally bullish long-term outlook. Its ability to execute on its AI and data center strategy will be crucial for realizing its growth potential.

    15. Conclusion

    As of October 2, 2025, Marvell Technology (MRVL) presents a compelling, albeit nuanced, investment profile driven primarily by its strong position in the data center and artificial intelligence (AI) semiconductor markets. The company's strategic pivot towards high-growth data infrastructure, particularly custom AI ASICs and interconnect technologies, underpins a generally bullish outlook among Wall Street analysts, who largely maintain "Buy" or "Strong Buy" ratings with significant upside potential in their price targets. However, investors should also be mindful of inherent risks and critical factors that could influence future performance.

    Summary of Key Findings: Marvell is recognized as a leading player in the semiconductor industry, particularly within data center and networking solutions, with a strategic and aggressive push into the AI chip market. The company's growth is largely fueled by its custom AI ASICs (Application-Specific Integrated Circuits) and interconnect technologies, supported by strategic partnerships with major cloud providers like Amazon Web Services (AWS) and Microsoft. Recent financial indicators and management actions underscore confidence in the company's trajectory, including strong anticipated revenue and earnings per share (EPS) growth, and a substantial stock buyback program. Marvell's stock has also demonstrated positive momentum, entering a rising trend channel in the medium term, which signals increasing investor optimism.

    Balanced Perspective:
    Strengths: Marvell's leadership in AI and custom silicon, strategic partnerships with hyperscalers, comprehensive portfolio across digital infrastructure, strong financial foundation (consistent revenue growth, solid balance sheet, healthy cash flow), and management confidence (stock buybacks, insider purchases) are significant positives.
    Weaknesses and Risks: Key challenges include customer concentration risk (reliance on a few hyperscalers), limited visibility and intense competition in the custom AI market, profitability pressures (gross margins pressured, GAAP net losses, negative dividend payout ratio), market cyclicality and stock volatility (high beta), and recent analyst downgrades citing concerns about cloud visibility and potential market share shifts (e.g., with Amazon's Trainium 3 project). Technical setbacks with high-speed SerDes technology have also caused delays.

    What Investors Should Watch:

    • Hyperscaler Spending and Design Wins: The most critical factor is the continued demand and capital spending from major cloud customers, and Marvell's ability to secure new design wins and maintain existing partnerships, especially for next-generation AI projects.
    • Competitive Landscape: Monitor the evolving competitive environment in the custom AI chip market, including advancements from rivals and increased in-house chip development by cloud providers.
    • Profitability and Margin Trends: Scrutinize gross and net income margins for signs of improvement, indicating better operational efficiency and pricing power.
    • Execution on AI Strategy: Marvell's ability to effectively ramp up production of its custom AI silicon, such as Maia 200, and translate product innovation into sustained revenue growth will be crucial.
    • Earnings Reports and Forward Guidance: Future quarterly earnings reports and management's guidance on revenue and profitability will provide vital insights, particularly regarding the custom AI business and data center segment.
    • Debt Levels and Cash Flow: While the company has a solid financial foundation, continued monitoring of its moderate debt levels and strong cash flow generation is important for assessing financial health and flexibility.

    In conclusion, Marvell Technology is at the forefront of the AI revolution in data infrastructure. Its strategic focus and technological prowess position it for significant long-term growth. However, investors must weigh these opportunities against the inherent risks of customer concentration, intense competition, and the cyclical nature of the semiconductor industry. Diligent monitoring of key customer relationships, execution on its AI roadmap, and financial performance will be essential for assessing Marvell's trajectory.


    This content is intended for informational purposes only and is not financial advice

  • Visa Inc. (V/NYSE): A Deep Dive into the Global Payments Giant

    Visa Inc. (V/NYSE): A Deep Dive into the Global Payments Giant

    As of October 2, 2025, Visa Inc. (V/NYSE) remains a dominant and highly relevant player in the global financial industry, consistently drawing focus from investors and consumers alike due to its expansive network, robust financial performance, and continuous innovation in payment technologies.

    Visa Inc. is an American multinational payment card services corporation, founded in 1958 and headquartered in San Francisco, California. It facilitates electronic funds transfers worldwide, primarily through its widely recognized Visa-branded credit, debit, and prepaid cards. Visa operates as a global payments technology company, connecting consumers, merchants, financial institutions, and government entities across more than 200 countries and territories. A key aspect of Visa's business model is that it does not issue cards, extend credit, or set rates and fees for consumers. Instead, it acts as an intermediary, providing financial institutions with Visa-branded payment products and the underlying technology (VisaNet) that enables secure and efficient payment processing. Its revenue is primarily generated from transaction fees and service charges, including data processing, authorization, clearing, and settlement services, as well as value-added services like fraud management, risk assessment, and consulting. In 2024, Visa's revenue was $35.93 billion, an increase of 10.02% from the previous year.

    Visa continues to be a central pillar of the global digital payments ecosystem. It is the world's second-largest card payment organization (after China UnionPay) based on annual value of card payments and number of issued cards. Excluding China's domestic market, Visa is considered the dominant bankcard company globally, holding approximately a 50% market share of total card payments. In the U.S., Visa commands a significant 52% market share in the card network sector. The company is at the forefront of payment innovation, consistently integrating cutting-edge technologies like artificial intelligence (AI) and data analytics to enhance efficiency, security, and customer experience. Recent innovations and strategic initiatives include AI-driven security solutions (ARIC Risk Hub), the development of an Intelligent Commerce Platform with strategic partnerships (OpenAI, Microsoft, Anthropic) for AI agents to execute payments, and the general availability of the Visa Commercial Solutions (VCS) Hub in late September 2025. Visa is also focused on digital identity and new payment flows through platforms like Visa Direct, which processed nearly 10 billion transactions in 2024. For investors, Visa offers strong financial performance, a dominant market position, consistent shareholder returns, and promising growth prospects through innovation. For consumers, it provides global acceptance, convenience, robust security, diverse product offerings, and seamless digital experiences.

    2. Historical Background

    Visa Inc. (NYSE: V) boasts a rich history, evolving from an experimental credit card program in California to a global leader in digital payments. Its journey is marked by visionary leadership, strategic transformations, and a relentless focus on innovation that has shaped the modern financial landscape.

    Founding Story and Early Milestones

    The origins of Visa trace back to 1958 when Bank of America (BofA) launched the BankAmericard credit card program in Fresno, California. This initiative was the brainchild of Joseph P. Williams, who aimed to simplify consumer credit by offering a single, all-purpose credit card with a revolving credit feature. The program began with an unsolicited mass mailing of 65,000 cards.

    Key early milestones include:

    • 1966: Bank of America began licensing the BankAmericard program to other financial institutions, initiating its expansion.
    • 1968: Dee Hock was tasked with overseeing his bank's licensed BankAmericard rollout in the Pacific Northwest and identified systemic issues within the fragmented network.
    • 1970: Bank of America relinquished direct control, leading to the formation of National BankAmericard Inc. (NBI), an independent cooperative owned by its member banks, with Dee Hock as its first president and CEO.
    • 1973: NBI launched the precursor to VisaNet, an electronic authorization system, followed by the industry's first electronic clearing and settlement system.
    • 1974: The International Bankcard Company (IBANCO) was established to manage BankAmericard's international program.
    • 1975: Visa issued the first debit card through the First National Bank of Seattle.

    Key Transformations and Significant Events

    The 1970s brought about significant transformations that solidified the company's global identity:

    • 1976: NBI was officially rebranded as Visa. Dee Hock chose the name because he believed it was instantly recognizable and conveyed universal acceptance. IBANCO was also rebranded as Visa International. This unification brought various international networks under a single global brand.
    • 1977: National BankAmericard became Visa U.S.A., and IBANCO was rebranded Visa International.
    • 1984: Dee Hock resigned, having successfully built Visa into a decentralized organization.
    • 1987: Visa acquired a 33% share of Plus Systems, expanding its ATM footprint.
    • October 2006: Visa announced its intention to become a public company.
    • October 3, 2007: Visa completed a major corporate restructuring, merging Visa Canada, Visa International, and Visa U.S.A. into a new public company named Visa Inc.
    • March 18, 2008: Visa Inc. launched its Initial Public Offering (IPO) on the New York Stock Exchange under the ticker symbol "V." The IPO raised $17.9 billion, making it the largest public offering in U.S. history at the time.
    • 2016: Visa Inc. acquired Visa Europe Ltd., reunifying its global operations.
    • 2020-Present: Visa has continued its digital transformation efforts, establishing accelerator programs and venturing into digital currencies, including announcing partnerships and acceptance of stablecoin USDC to settle transactions on its network in 2021. It continues to expand its "network of networks" approach, focusing on digital innovation and security.

    Today, Visa Inc. is headquartered in San Francisco, California, and operates in more than 200 countries and territories, facilitating electronic funds transfers globally.

    3. Business Model

    Visa Inc. operates as a global leader in payment technology, facilitating electronic fund transfers through an "open-loop" and "transaction-centric" business model. Unlike traditional banks, Visa does not issue cards, extend credit, or set interest rates for consumers. Instead, it serves as a crucial intermediary, connecting financial institutions, merchants, and cardholders worldwide through its proprietary processing network, VisaNet.

    Primary Revenue Sources

    Visa's revenue generation is primarily derived from fees charged to financial institutions that leverage its payment network. The core revenue streams include:

    • Data Processing Revenues: Fees collected for authorization, clearing, settlement, and other essential transaction processing services. This is often the largest portion of Visa's total revenue, driven by transaction volume.
    • Service Revenues: Fees earned from financial institutions (issuers) for their participation in Visa card programs and for using Visa-branded products, typically based on overall payment volume.
    • International Transaction Revenues: Revenues from cross-border transactions, where the cardholder's issuing country differs from the merchant's country, including currency conversion services.
    • Other Revenues: Various income sources such as licensing fees, account holder service fees, and revenues from value-added services.

    It is important to note that Visa does not profit from the interest charged on Visa-branded credit card payments, nor does it directly earn the merchant discount fee; these revenues go to card-issuing and acquiring banks.

    Key Product Lines and Services Offered

    Visa provides financial institutions with a suite of branded payment products, which are then offered to consumers and businesses. Its offerings include:

    • Payment Cards: Visa-branded credit cards, debit cards, and prepaid cards.
    • Commercial Cards: Solutions for businesses and governments to manage expenses.
    • Mobile and Money Transfer Products: Solutions for digital and mobile payments, and money transfers.
    • Authorization, Clearing, and Settlement Services: Foundational services provided by VisaNet for secure and efficient transaction processing.
    • Value-Added Services: Supplementary services like risk management, fraud prevention (e.g., Visa Protect), loyalty services, data analytics, and consulting.
    • Digital Payment Solutions: Contactless payments (Visa payWave), mobile wallets, Click to Pay, and tokenization services.
    • Visa Direct Platform: Facilitates domestic and cross-border money movement across various endpoints.
    • Open Banking Solutions: Services related to data access, such as account verification and payment initiation.
    • Issuing Solutions: Services for issuers, including Visa DPS, account controls, and digital issuance.
    • Acceptance Solutions: Tools to help merchants accept payments smoothly and securely.

    Operational Segments

    While Visa does not typically categorize its business into distinct operational "segments," its revenue reporting highlights key areas:

    • Data Processing: Core infrastructure and services for transactions.
    • Service: Ongoing support for financial institutions using Visa's products.
    • International Transaction: Facilitating and processing cross-border payments.
    • Other: Ancillary services, licensing, and other revenue-generating activities.

    Core Customer Base

    Visa's business model is built on a multi-sided platform, serving diverse customer segments:

    • Financial Institutions: Issuers (banks issuing cards) and Acquirers (institutions contracting with merchants).
    • Merchants: Businesses accepting Visa cards.
    • Cardholders/Consumers: Individuals and businesses using Visa-branded products.
    • Governments: Public sector entities seeking digital payment solutions.

    Visa generates revenue by charging fees to financial institutions for utilizing its network to perform authorization, clearing, and settlement services. These fees are primarily linked to the payment volume and transaction volume. For cross-border transactions, additional international transaction fees are applied.

    4. Stock Performance Overview

    Visa Inc. (V/NYSE) has demonstrated robust stock performance across the 1-year, 5-year, and 10-year horizons as of October 2, 2025. The company's consistent growth is primarily driven by its dominant position in the global digital payments industry, strong financial metrics, and strategic capital management.

    Current Stock Price and Market Capitalization (as of October 2, 2025):
    As of October 2, 2025, Visa Inc. (V) opened at $348.21. The stock's 52-week high is $375.51, reached on June 11, 2025, and its 52-week low is $273.24. Visa's market capitalization stands at approximately $670.13 billion.

    Stock Performance Analysis:

    • 1-Year Horizon (October 2, 2024 – October 2, 2025):
      Visa's stock has shown strong performance over the past year, with a total return of 25.05% to 32.29%, outperforming the S&P 500's return of 16.52% during the same period. The stock has increased by 24.33% over the last year, and its market cap rose by 21.26%.

    • 5-Year Horizon (October 2, 2020 – October 2, 2025):
      Over the last five years, Visa has delivered significant returns, with a total return of 74.55% to 77.28%. This translates to an average annual return (CAGR) of 12.07% to 13.80%. Approximately half of the stock's gains since its IPO have occurred in the past five years.

    • 10-Year Horizon (October 2, 2015 – October 2, 2025):
      Visa's long-term performance has been exceptional, with a 10-year total return of 416.30% to 438.39%, significantly outpacing the S&P 500's less than 199% gain. The average annual return (CAGR) for the past decade is 17.68% to 18.73%. Visa's annual revenue more than doubled, and profits more than tripled over the last decade.

    Significant Stock Movements and Key Drivers:

    • Dominant Market Position: Visa's status as one of the two major global payment card companies provides a significant competitive moat.
    • Growth of Digital Payments: The global shift from cash to digital payments is a primary driver of Visa's sustained growth.
    • Strong Financial Performance: Consistent high profitability, strong operating margins (66.0% in its most recent fiscal quarter), and excellent returns on capital.
    • Cross-Border Transactions and Value-Added Services: Growth in these areas contributes significantly to performance.
    • Shareholder-Friendly Capital Returns: A stable dividend policy (increased for 16 consecutive years) and active share buyback programs (new $30 billion program in April 2025) reinforce investor confidence.
    • Economic Trends: Visa's model is somewhat insulated from economic downturns as it does not lend money. Resilient consumer spending has contributed to recent strong performance.
    • All-Time High: Visa's stock reached an all-time high of $375.51 on June 10, 2025.

    Comparison Against Relevant Benchmarks:

    Visa has consistently outperformed the broader market, as exemplified by its comparison to the S&P 500. Over the past 12 months, Visa's total return of 25.05% outpaced the S&P 500's 16.52% return. Over the past decade, Visa's total return exceeding 420% significantly surpassed the S&P 500's less than 199% gain. Despite this, some analysts noted Visa's stock trailing the S&P 500 in 2024 due to regulatory scrutiny and growth runway concerns, which are expected to ease. Its P/E ratio of 34.01 indicates a premium valuation.

    5. Financial Performance

    Visa Inc. (V/NYSE) has demonstrated robust financial performance, as evidenced by its latest fiscal third-quarter 2025 earnings report and key financial metrics as of October 2, 2025. The company's strategy focuses on accelerating revenue growth in consumer payments, new flows, and value-added services, while strengthening its core business model.

    Latest Earnings Report: Fiscal Third Quarter 2025 (Ended June 30, 2025)

    Visa reported strong results for its fiscal third quarter of 2025, with double-digit growth in both revenue and adjusted earnings.

    • Net Revenue: $10.2 billion, a 14% increase year-over-year (14% on a constant-dollar basis).
      • Service revenue: Up 9% to $4.3 billion.
      • Data processing revenue: Up 15% to $5.2 billion.
      • International transaction revenue: Up 14% to $3.6 billion.
      • Other revenue: Up 32% to $1.0 billion.
      • Client incentives: $3.7 billion, up 15%.
    • Net Income:
      • GAAP net income: $5.3 billion (8% increase).
      • Non-GAAP net income: $5.8 billion (19% increase).
    • Earnings Per Share (EPS):
      • GAAP diluted EPS: $2.69 (12% increase).
      • Non-GAAP diluted EPS: $2.98 (23% increase), surpassing analyst estimates of $2.90.
    • Key Business Drivers (Year-over-Year, constant dollars for Q3 2025):
      • Payments Volume: Up 8%.
      • Cross-Border Volume (excluding Intra-Europe): Up 11%.
      • Total Cross-Border Volume: Up 12%.
      • Processed Transactions: Up 10% to 65.4 billion.

    Revenue Growth

    For the trailing twelve months (TTM) ending June 30, 2025, Visa's revenue was $38.89 billion, an 11.38% increase year-over-year. The average annual revenue growth from fiscal years 2020-2024 was 9.7%.

    Profit Margins

    Visa demonstrates strong profitability with impressive margins:

    • Gross Profit Margin: Latest twelve months is 97.8%, consistently high.
    • Net Profit Margin: For Q3 2025, it was 52.16%. The average for 2024 was 54.45%.
    • Operating Margin: As of September 2025 (TTM), it is 62.58%. EBIT margin is 67%.

    Debt Levels

    As of June 30, 2025, Visa's debt levels are manageable:

    • Total Debt: $25.14 billion.
    • Long-Term Debt: $19.6 billion.
    • Short-Term Debt: $5.548 billion.
    • Debt-to-Equity Ratio: 0.65 for Q3 2025, considered satisfactory and well covered by operating cash flow.

    Cash Flow Generation

    Visa exhibits strong cash flow generation capabilities:

    • Operating Cash Flow: For Q3 2025, it was $16.821 billion (26.61% increase). TTM operating cash flow was $52.258 billion (14.08% increase).
    • Free Cash Flow (FCF): $22.1 billion for Q3 2025. Average annual FCF growth rates have been 14% over the past five and ten years.
    • Cash and Cash Equivalents: $20.4 billion as of June 30, 2025.

    Key Valuation Metrics (as of October 2, 2025)

    • Market Capitalization: Approximately $670.13 billion.
    • P/E Ratio: Trailing 33.95, forward 28.03.
    • P/S Ratio: 16.49.
    • P/B Ratio: 17.76.
    • PEG Ratio: 2.14.
    • Dividend: Quarterly cash dividend of $0.590 per share, yielding 0.68% (TTM).

    Visa's financial performance in fiscal Q3 2025 demonstrates continued strength, driven by resilient consumer spending and robust transaction growth. The company maintains impressive profit margins and strong cash flow generation, supporting shareholder returns. While valuation metrics indicate a premium, this reflects Visa's strong market position and consistent profitability.

    6. Leadership and Management

    As of October 2, 2025, Visa Inc. (V/NYSE) is guided by a seasoned leadership team and a strategically structured Board of Directors, committed to advancing its position in the global digital payments landscape. The company's strategic vision emphasizes innovation, security, and expanded reach, while its governance reputation underscores transparency and ethical conduct.

    Leadership and Management Team

    Chief Executive Officer (CEO)
    Ryan McInerney serves as the CEO of Visa Inc. since February 1, 2023. Previously, he was President of Visa since June 2013, overseeing global businesses. His background includes CEO of consumer banking for JPMorgan Chase and a principal at McKinsey & Company. McInerney's compensation for the fiscal year is reported at $26.00 million.

    Key Executives
    Visa's executive committee includes:

    • Chris Suh: Chief Financial Officer (CFO), joined July 2023.
    • Rajat Taneja: President of Technology.
    • Kelly Mahon Tullier: Vice Chair, Chief People and Corporate Affairs Officer, and Corporate Secretary.
    • Paul D. Fabara: Chief Risk and Client Services Officer.
    • Jack Forestell: Chief Product and Strategy Officer.
    • Oliver Jenkyn: Group President, Global Markets.
    • Christopher T. Newkirk: President, Commercial & Money Movement Solutions (New Flows).
    • Antony Cahill: Chief Executive Officer, Visa Europe (pending regulatory approval).
    • Andrew Torre: President, Value-Added Services, appointed June 2025.
    • Julie B. Rottenberg: General Counsel.
    • Frank Cooper III: Chief Marketing Officer.

    The average tenure of Visa's management team is approximately 4 years, indicating a blend of experienced leaders and newer appointments.

    Board of Directors

    The Board of Directors is chaired by John F. Lundgren, the Lead Independent Director. Visa's board consists of a majority of independent directors. As of October 2, 2025, the board has expanded from 11 to 12 members.

    Recent Changes to the Board:
    On September 29, 2025, Bill Ready, CEO of Pinterest, was elected as an independent director, bringing extensive fintech experience. He will serve on the Finance Committee and the Nominating and Corporate Governance Committee.

    Other notable independent directors include Lloyd A. Carney, Maynard G. Webb, Jr., Denise M. Morrison, and Pamela Murphy. The average tenure for the board of directors is 6.5 years.

    Strategic Vision

    Visa's mission is "to help make the world a better place," with a vision "to uplift everyone, everywhere by being the best way to pay and be paid." For 2025, Visa's strategic framework aims for sustained growth and innovation, focusing on:

    • Consumer Payments Growth: Strengthening card-based payments and expanding to non-card methods.
    • Commercial & Money Movement Solutions (CMS): Capitalizing on the $200 trillion annual opportunity in B2B transactions and other electronic money movement.
    • Value-Added Services (VAS): Diversifying revenue, aiming for VAS and new flows to represent half of total revenue by 2026. This includes "Visa-as-a-Service."
    • Strategic Innovation and AI Partnerships: Developing an "Intelligent Commerce platform" with OpenAI, Microsoft, and Anthropic to enable AI agents to execute payments.
    • Payment Security: Continuous investment in infrastructure and AI integration to decrease fraud.

    Governance Reputation

    Visa Inc. is committed to upholding high standards of corporate governance, professional conduct, and transparency. The company's framework includes Corporate Governance Guidelines and a Code of Business Conduct and Ethics. The board's structure with a majority of independent directors and dedicated committees reflects this commitment. Visa integrates compliance work across all business functions, ensuring robust oversight. Shareholder proposals at the January 2025 Annual Meeting regarding gender-based compensation, merchant category codes, and lobbying transparency were not approved, indicating ongoing shareholder engagement.

    Recent Changes and Notable Aspects

    • CEO Succession: Ryan McInerney's transition to CEO in February 2023 was a significant leadership change.
    • Board Expansion with Bill Ready: Strengthens strategic oversight in fintech.
    • Focus on New Flows and Value-Added Services: Restructuring of the executive team to emphasize these growth areas.
    • AI Integration: Strategic partnerships with AI companies signal a strong commitment to leveraging AI for innovation and security.
    • Shareholder Engagement: Annual meeting results demonstrate confidence in leadership while highlighting areas for increased transparency.

    7. Products, Services, and Innovations

    Visa Inc. (V/NYSE) continues to solidify its position as a global leader in digital payments through a comprehensive strategy focused on evolving product offerings, advanced services, aggressive innovation, substantial R&D investments, a robust patent portfolio, and a strong competitive edge as of October 2, 2025.

    Current Product Offerings and Services

    Visa's core business facilitates digital payments via credit, debit, and prepaid cards. The company is significantly expanding its suite of value-added services (VAS), aiming for VAS and new payment flows to contribute 50% of total revenue by 2026.

    Key current and recently launched product offerings and services include:

    • Payment Processing & Network Services: VisaNet remains the core infrastructure.
    • Visa Direct: A global money movement network for push payments, processing nearly 10 billion transactions in 2024.
    • Visa as a Service (VAS): Unbundling Visa's payment stack into modular solutions for fintechs and partners.
    • Reimagined Authorize.net: Upgraded payment acceptance platform with AI-powered insights, real-time analytics, and "Tap-to-Phone" feature.
    • Unified Checkout: Integrates over 25 payment options with built-in fraud management and tokenization.
    • ARIC Risk Hub: Adaptive AI for real-time fraud detection and risk management.
    • Visa Intelligent Commerce: AI-enabled platform for personalized and secure shopping experiences, allowing AI agents to execute payments.
    • Flex Credential: Installment-based payment option launched in November 2024.
    • Visa Payment Passkey: FIDO-based biometric authentication for password-free online checkout, launched October 2025.
    • Visa Commercial Solutions (VCS) Hub: Generally available September 2025, offering embedded finance experiences and AI-powered payables for commercial payments.
    • Digital Identity Solutions: Including Visa Payment Passkey and Tap to Add Card.
    • Advisory Services: Insights and strategies based on anonymized VisaNet data.

    Innovation Pipelines and Research & Development (R&D) Efforts

    Visa's innovation strategy focuses heavily on Artificial Intelligence (AI) and expanding its network capabilities, with $3.3 billion invested in AI and data infrastructure over the last decade.

    Key areas of innovation and R&D include:

    • AI-Powered Solutions: AI is integral to new fraud prevention and risk management tools, and personalized commerce experiences.
    • Generative AI (GenAI): A significant focus for 2025 to automate customer service, enhance fraud detection, personalize products, and improve operational efficiency.
    • Strategic Partnerships: Collaborations with OpenAI, Microsoft, Anthropic, IBM, and others to develop the Intelligent Commerce platform and other AI advancements.
    • Stablecoin Integration: Expanding applications for stablecoins, including stablecoin-linked cards and settlement.
    • Visa Innovation Program Europe 2025: Fostering fintech innovation across themes like AI, next-generation payment experiences, and embedded finance.
    • Acquisitions: Finalizing acquisitions of Prosa and Featurespace in 2025 to enhance fraud prevention and real-time AI payments protection.
    • Pismo Expansion: Core banking platform Pismo is expanding its offerings globally.
    • Tokenization: Adapting this technology for enhanced security and fraud reduction in AI commerce.

    Patents

    Visa holds a substantial patent portfolio with 9,843 patents globally, 5,894 of which are active.

    • Key Patent Areas: Virtual wallet security, digital account credentials, digitalization, fintech, payment services, encryption, and security services.
    • Recent Activity: Growth in patent filings and grants in Q2 2024.
    • Industry Influence: Several Visa patents are highly cited by competitors like Mastercard and PayPal.

    Competitive Edge in the Payments Industry

    Visa maintains a formidable competitive edge through:

    • Market Dominance: Over 60% market share in global digital payments, leading in transaction volume growth and operating margins.
    • Extensive Global Network: Unparalleled reach with over 4.8 billion Visa credentials and acceptance at 150 million merchant locations.
    • Technological Superiority: VisaNet can process 65,000 transactions per second, with advanced AI for fraud management.
    • "Visa as a Service" (VAS) Model: Diversifies revenue and enhances network utility, competing with embedded finance platforms.
    • Brand Strength and Trust: Strong brand reputation associated with security and reliability.
    • Financial Strength: Robust financial health for ongoing innovation and acquisitions.
    • Proactive Innovation: Consistent investment in AI, stablecoins, and digital identity solutions.
    • Cost Leadership: Leveraging economies of scale for competitive pricing.

    8. Competitive Landscape

    Visa Inc. (V/NYSE) maintains a dominant position in the global digital payments industry as of October 2, 2025, navigating a complex and evolving competitive landscape. Its primary rivals include established payment networks like Mastercard, American Express, and Discover, alongside a rapidly growing array of fintech companies and alternative payment solutions.

    Main Industry Rivals and Market Shares

    Visa's main industry rivals in the payment processing and network space are:

    1. Mastercard Inc. (MA/NYSE): Visa's closest and most significant competitor, operating a similar global payment network.
    2. American Express Company (AXP/NYSE): An integrated business model, acting as both a card issuer and a payment network, focusing on premium customers.
    3. Discover Financial Services (DFS/NYSE): Also operates as both an issuer and a network, primarily in the U.S., with a smaller market share.
    4. UnionPay (China UnionPay): A massive global player, dominant in China and expanding internationally.
    5. Fintech Companies and Alternative Payment Methods: Includes digital wallets (Apple Pay, Google Pay), P2P services, Buy Now Pay Later (BNPL) providers, real-time payment (RTP) networks, account-to-account (A2A) transfers, and neobanks. These influence the payment ecosystem and compete for transaction volume.

    Market Share Assessment (as of 2024/2025 data):

    • Global Digital Payments Industry: Visa commands over 60% market share in some segments, leading in the global credit card market (32% to 52.2%).
    • U.S. Credit Card Market: Visa leads with approximately 52% of the market. Mastercard is second (24-27%), followed by American Express (10-19%), and Discover (2-7%).
    • U.S. Debit Card Market: Visa shows greater dominance, accounting for approximately 74% of purchase volume, compared to Mastercard's 26%. Globally, Visa's debit share is around 60%.
    • Overall Card Spending (U.S. Credit, Debit, and Prepaid combined, 2024): Visa captured 61.1%, followed by Mastercard at 25.8%, American Express at 11.1%, and Discover at 2.0%.

    Visa's Competitive Strengths

    • Market Dominance and Brand Recognition: Strong global brand and largest market share.
    • Extensive Global Network and Acceptance: Unparalleled reach in over 200 countries, processing 65,000 transactions per second.
    • Strong Financial Performance: Robust revenue and net income growth, healthy operating margins.
    • Technological Innovation and Digital Transformation: Heavy investment in AI for fraud detection, value-added services, and contactless payments.
    • Strategic Partnerships and Fintech Integration: Proactively engaging with fintechs, making acquisitions, and building platforms.
    • Issuer-Centric Model: A strength in certain market segments.

    Visa's Competitive Weaknesses

    • Regulatory Scrutiny and Legal Challenges: Ongoing antitrust investigations and legal cases (e.g., U.S. Department of Justice) could impact profitability.
    • Reliance on Consumer Spending: Vulnerable to economic downturns.
    • Intense Competition from Emerging Technologies: Rapid proliferation of alternative payment methods (digital wallets, BNPL, A2A) and fintechs.
    • Risk and Fraud Exposure: Highly exposed to fraud and cyber threats.
    • Workforce Challenges: Reportedly faces a shortage of experienced workforce in some global markets.

    Comparison to Main Competitors

    Vs. Mastercard: Visa has a larger market share. Both are heavily investing in AI and fintech, but Visa is often noted for a more issuer-centric approach. Both face similar regulatory and economic vulnerabilities.

    Vs. American Express: Amex has a distinct integrated model, focusing on premium cardholders with higher spending. Visa dominates the broader market. Amex's reliance on discretionary spending makes it more vulnerable during downturns.

    Vs. Discover: Discover has a significantly smaller market share and less global acceptance compared to Visa.

    Vs. Fintech and Alternative Payment Providers: Fintechs offer superior speed, lower fees, and enhanced experiences, posing a significant threat. Visa's strategy involves heavy investment in and partnerships with fintechs, developing APIs, and expanding its own digital service offerings to leverage these trends.

    In conclusion, Visa Inc. remains a dominant force, bolstered by its global network, brand, and innovation. However, it must continually navigate intense competition and adapt to disruptive forces and increasing regulatory scrutiny.

    9. Industry and Market Trends

    Visa Inc. (V/NYSE) operates at the nexus of global commerce, and its performance as of October 2, 2025, is significantly shaped by dynamic industry and market trends across digital payments, macroeconomic landscapes, supply chain evolution, and cyclical economic shifts.

    Key Industry and Market Trends Impacting Visa Inc.

    1. Sector-Level Trends in Digital Payments

    • Continued Shift to Digital Wallets and Contactless Payments: Over 70% of global consumers use digital payment methods, and digital wallets are projected to capture 52% of U.S. e-commerce payments by 2027. Contactless payments are rising, with Visa Direct transaction volumes reaching 3.3 billion in Q3 2025 (25% YOY increase). Tokenization is crucial for securing these digital transactions, aiming for 100% penetration in e-commerce.
    • Rise of Real-Time and Faster Payments (RTP): Demand for instant access to funds and immediate payment confirmation is accelerating with initiatives like FedNow. Visa Direct's growth underscores Visa's strong position in real-time money movement.
    • Digitization of B2B Payments and Embedded Finance: The B2B payments landscape is rapidly digitizing, moving to automated solutions, e-invoicing, virtual cards, and embedded finance. The market for embedded payments for small businesses could reach $124 billion in 2025. Visa's commercial payments volume grew 7% in Q3 2025.
    • Growth in Cross-Border Payments: Global cross-border payments are expanding significantly, projected to reach $320 trillion by 2032. Visa reported an 11% increase in cross-border volume (excluding intra-Europe) in fiscal Q3 2025, driven by e-commerce and travel.
    • Emerging Technologies (AI, Blockchain, Open Banking, BNPL):
      • AI and Machine Learning: Enhancing fraud detection, automating processes, and personalizing payment experiences. Visa has invested $3.3 billion in AI and data infrastructure.
      • Blockchain and Digital Currencies: Increasing use for speed, security, and efficiency, especially in B2B payments. Stablecoin transaction volumes are climbing, and Visa has partnerships in stablecoin settlement.
      • Open Banking: Driving adoption of account-to-account (A2A) payments, with Visa investing in initiatives.
      • Buy Now, Pay Later (BNPL): Growing significantly, with Visa enabling BNPL through its Flex Credential.

    2. Broader Macroeconomic Drivers

    • Global Economic Growth: Forecasted for moderate growth in 2025, led by the U.S., India, and GCC countries.
    • Inflation and Interest Rates: Inflation for services is expected to ease, but tariffs pose risks. High interest rates can impact consumer borrowing.
    • Consumer Spending Patterns: Continued shift online, with mobile commerce booming. Consumers demand seamless, secure, and tailored payment experiences.
    • Geopolitical Events and Regulatory Changes: Tensions and proposed tariffs create uncertainty. Regulatory initiatives like PSD3 and DORA (EU) are improving interoperability and compliance.

    3. Supply Chain Considerations

    • Digitization and Automation: Businesses leverage digital tools and AI for working capital optimization.
    • Supply Chain Finance (SCF) as a Growth Engine: SCF is a strategic asset for resilience, especially for SMEs. Visa focuses on enabling financial institutions to offer solutions through virtual and corporate cards.
    • ESG-Linked Supply Chain Finance: Growing trend to link financing rates to ESG performance.
    • Real-Time Data and Risk Management: AI and data-driven analytics for supply chain risk.

    4. Cyclical Effects Relevant to Visa's Business

    • Impact of Economic Uncertainty: Expected to slow growth in the U.S. card payments market to 2.4% in 2025, potentially depressing retail activity.
    • Consumer Spending Volatility: Economic slowdowns or inflation can reduce discretionary spending, impacting transaction volumes.
    • Resilience and Diversification: Despite headwinds, Visa showed strong performance in Q3 2025, with diversified growth areas expected to be accretive.

    In conclusion, Visa Inc. is navigating a dynamic payments landscape driven by accelerating digital transformation, particularly in mobile, real-time, B2B, and cross-border payments. The company is actively investing in and benefiting from these trends. While macroeconomic uncertainties pose potential headwinds, Visa's focus on innovation, fraud prevention (leveraging AI), and diversified growth engines position it to adapt and capitalize on the ongoing shift to a cashless, digital economy.

    10. Risks and Challenges

    Visa Inc. (V/NYSE) faces a multifaceted landscape of risks and challenges as of October 2, 2025, encompassing operational vulnerabilities, an evolving regulatory and legal environment, ongoing controversies, and broader market pressures. While the company continues to demonstrate strong financial performance, these factors could impact its future growth and profitability.

    Operational Risks

    • Increased Fraud and Scam Activity: The payments ecosystem is experiencing a marked increase in sophisticated fraud and scam schemes, including enumeration attacks, provisioning fraud, malicious mobile applications, and social engineering. Ransomware and data breach attacks also remain a significant concern, with a 51% increase in incidents tracked by Visa PERC from July to December 2024.
    • Stricter Compliance Standards (VAMP): Effective April 1, 2025, Visa is implementing stricter fraud thresholds under its enhanced Visa Acquirer Monitoring Program (VAMP), with reduced dispute ratio thresholds and new enumeration ratio metrics. Non-compliant entities face substantial penalties.
    • Content Moderation Policy Overhaul: An August 2025 executive order mandates equitable access to payment services, requiring Visa to overhaul its content moderation policies, which could introduce complexity and challenges.
    • Shift Towards Lower-Margin Transactions: A consumer preference shift towards debit cards over credit cards could pressure Visa's margins, as debit transactions often generate lower fees.
    • Rising Operating Expenses and Client Incentives: Visa has experienced rising adjusted operating expenses and increasing client incentives, which can reduce net revenues and weigh on near-term financial performance.

    Regulatory and Legal Risks

    • Antitrust Lawsuits and Scrutiny: Visa faces ongoing antitrust challenges, including a lawsuit from the U.S. Department of Justice (DoJ) filed in September 2024, specifically challenging Visa's market dominance in U.S. debit transactions.
    • Interchange Fee Regulation: Regulatory bodies in the U.K. and Europe continue to scrutinize and challenge Visa's interchange fees. A June 2025 UK Competition Appeal Tribunal ruling found Visa's default multilateral interchange fees (MIFs) violate competition law, potentially forcing reductions.
    • Data Privacy Compliance: Intensifying demands for data privacy compliance globally, including GDPR and CCPA, pose continuous challenges.
    • Cross-Border Data Governance Challenges: Broader U.S. government policies could create diplomatic retaliation risks and increase compliance burdens for U.S. firms operating internationally.

    Controversies

    • Market Dominance and Alleged Anti-Competitive Practices: The DoJ lawsuit and regulatory scrutiny regarding Visa's market share and alleged exclusionary practices continue to be a source of controversy.
    • Interchange Fee Debates: The debate over interchange fees persists, with merchants and regulators often arguing they are excessive.
    • Content Moderation and Access to Payment Services: The August 2025 executive order requiring equitable access to payment services could become controversial if implementation is perceived to favor or disfavor certain groups.

    Broader Market Risks

    • Macroeconomic Uncertainty: Persistent global macroeconomic uncertainty and geopolitical instability can significantly impact consumer and business spending.
    • Geopolitical Headwinds: Tensions between major global powers, along with potential for wide-ranging tariffs, could reignite inflation and keep interest rates higher, weighing on spending.
    • Inflationary Pressures: While percentage-based fees can benefit from inflation, sustained high inflation could erode consumer purchasing power.
    • Increased Competition and Evolution of Payments Landscape: The rise of alternative payment systems, digital wallets, and account-to-account (A2A) payments poses a competitive threat.
    • Emerging Technology Risks: While investing in AI for fraud detection is a strength, the increasing use of AI by fraudsters presents an ongoing challenge.

    11. Opportunities and Catalysts

    Visa Inc. (V/NYSE) is poised for continued growth as of October 2, 2025, driven by a multifaceted strategy that leverages evolving digital payment trends, strategic partnerships, and a focus on expanding into lucrative new segments. Key opportunities and catalysts include significant growth levers in new payment flows and value-added services, strategic market expansion, ongoing M&A activities, and several near-term product launches and financial events.

    Key Opportunities and Growth Levers:

    1. Expansion into New Payment Flows (B2B, P2P, G2C): Visa is aggressively targeting the estimated $200 trillion annual opportunity in Commercial and Money Movement Solutions (CMS).

      • Business-to-Business (B2B) Payments: A substantial $145 trillion market, addressed by solutions like Visa Commercial Solutions (VCS) and the recently launched VCS Hub (September 30, 2025), offering AI-powered payables and embedded payments.
      • Person-to-Person (P2P), Business-to-Consumer (B2C), and Government-to-Consumer (G2C) Payments: These segments, part of the $55 trillion non-B2B money movement opportunity, are largely addressed by Visa Direct, which processed nearly 10 billion transactions in 2024.
      • Visa aims for VAS and new payment flows to account for 50% of total revenue by 2026.
    2. Robust Growth in Value-Added Services (VAS): Visa identifies a substantial $520 billion annual revenue opportunity in VAS, driven by:

      • Visa-as-a-Service (VaaS): Unbundling its payment stack into modular solutions for fintechs and partners, leading to a 26% year-over-year increase in the VAS segment.
      • Advanced Security and Risk Management: Solutions like the ARIC Risk Hub leveraging adaptive AI.
      • Enhanced Payment Gateways and Analytics: A reimagined Authorize.net platform with AI-powered insights and a "Tap-to-Phone" feature (domestic launch Q2 2025, global 2026).
    3. Digital Transformation and AI Integration: Significant investments in AI and digital innovation:

      • Intelligent Commerce Platform: Strategic partnerships with OpenAI, Microsoft, and Anthropic to enable AI agents to autonomously execute payments (full commercial deployment targeted for 2026).
      • AI for Operational Efficiency: Integrating AI across operations for fraud prevention, forecasting, and workflow automation.
      • Product Design System: Public release in April 2025 streamlines payment app development for partners.
    4. Cross-Border Payments and Stablecoins: Cross-border transactions remain a strong growth driver, with volumes increasing by 13% in Q2 2025.

      • Stablecoin Integration: Visa announced a stablecoin prefunding pilot through Visa Direct at SIBOS 2025, aiming to accelerate cross-border transactions.

    Expansion into New Markets and Segments:

    1. Asia Pacific Focus: Enhancing Visa Infinite card benefits and benefiting from China's relaxed visa policies.
    2. Fintech Ecosystem Development: Expanding its network through partnerships with fintechs, neobanks, and digital platforms (e.g., Visa Commercial Integrated Partners program).
    3. Embedded Finance: Integrating payment capabilities directly into business applications.

    M&A Potential:

    1. Strategic Acquisitions for Enhanced Capabilities: Finalizing acquisitions of Prosa (Mexican payments processor) and Featurespace (real-time AI payments protection) in 2025.
    2. Integration and Expansion of Past Acquisitions: Acquired entities like Pismo are expanding their offerings globally.

    Near-Term Events (as of October 2, 2025):

    1. Fiscal Year Q4 2025 Earnings Report: Estimated October 27 or November 4, 2025, with strong results expected to be a positive catalyst.
    2. Visa Commercial Solutions (VCS) Hub General Availability: Announced September 30, 2025, expected to drive adoption.
    3. Visa Payment Passkey Launch: October 1, 2025, in the Middle East, for secure, password-free online checkout.
    4. Ongoing Product Rollouts: Reimagined Authorize.net and Unified Checkout are expected to enhance payment acceptance and boost client growth.
    5. Global Product Drop (April 30, 2025): Unveiled new AI-enabled advancements, laying groundwork for future growth.

    In summary, Visa's strategic focus on expanding capabilities in new payment flows, leveraging AI, enhancing value-added services, and pursuing targeted acquisitions, combined with strong cross-border payment trends and upcoming financial disclosures, positions the company for continued growth and provides numerous catalysts for its stock.

    12. Investor Sentiment and Analyst Coverage

    As of October 2, 2025, investor sentiment for Visa Inc. (V/NYSE) remains largely positive, backed by strong analyst coverage, favorable Wall Street ratings, and consistent institutional interest, despite some cautionary retail investor discussions regarding valuation and potential disruptive threats.

    Wall Street Ratings and Average Price Targets

    Wall Street analysts hold a generally optimistic view of Visa, with a consensus rating ranging from "Strong Buy" to "Moderate Buy." Out of 24 to 39 analysts covering Visa, a significant majority recommend buying the shares (e.g., 30 out of 39 analysts recommend buying, with six giving "Strong Buy" ratings). Zacks Investment Research reports an average brokerage recommendation (ABR) of 1.54 (on a scale of 1 to 5, Strong Buy to Strong Sell), based on 37 firms.

    The average one-year price target for Visa shares varies slightly but generally suggests an upside potential. The consensus median one-year price target is $390.30, representing a potential upside of 14.3% from its then-current share price. Other sources cite an average price target of $386.17 from 24 analysts, forecasting an 11.02% increase, with targets ranging from $322 to $425. Zacks reports an average price target of $397.66, implying a 16.49% increase from the last closing price.

    Hedge Fund Activities

    Hedge funds have shown mixed activity, though Visa remains a significant holding for many. As of July 30, 2025, Visa was identified as one of the 12 most-owned stocks by hedge funds. However, some funds have reduced their positions; for example, Neville Rodie & Shaw Inc. reduced its stake by 13,278 shares in Q3 2025, and Janney Montgomery Scott LLC cut its holdings by 5.5% in Q2 2025. Insider selling has also been noted, with CEO Ryan Mcinerney and General Counsel Julie B. Rottenberg selling shares in July and August 2025, respectively.

    Institutional Investor Holdings

    Institutional investors hold a substantial portion of Visa's stock, indicating strong confidence. Visa Inc. has 6,218 institutional owners, collectively holding over 1.73 billion shares. Major institutional holders include Vanguard Group Inc., BlackRock, Inc., State Street Corp, and Fmr Llc. Many institutions increased their positions in Q1 and Q2 2025. Overall institutional ownership stands at 88.97% of total shares outstanding.

    Notable Retail Investor Chatter or Trends

    Retail investor sentiment shows a mix of appreciation and concern. Many retail investors view Visa as a "stable, profitable, and cash-rich" company with one of the best business models. Discussions following Visa's strong Q3 FY2025 earnings report (EPS of $2.98, revenue of $10.2 billion) reflected continued confidence. The new $30 billion share repurchase program was also seen positively.

    However, there are discussions about Visa's valuation, with some questioning if it's undervalued (P/E below five-year average) and others arguing it appears "significantly stretched" (high Price to Sales and Price to Book ratios, forward P/E above 30x). Concerns about disruptive threats and regulatory pressures are also recurring. Retail investors discuss the possibility of major customers developing in-house blockchain-based payment solutions, potentially impacting margins. The emergence of government stablecoin regulations and national payment alternatives are noted as long-term threats to the Visa-Mastercard duopoly. Despite these, many believe the "EU threat" is years away and that Visa is "recession proof" in the sense that it is unlikely to fail during economic downturns.

    13. Regulatory, Policy, and Geopolitical Factors

    Visa Inc. (V/NYSE) operates within a dynamic global landscape, significantly shaped by evolving regulatory frameworks, strategic policy initiatives, and a complex web of geopolitical factors as of October 2, 2025. These elements collectively influence the company's operational environment, compliance burdens, competitive positioning, and financial performance.

    Regulatory and Compliance Factors

    Visa faces an increasingly intricate global regulatory environment:

    • Data Privacy and Cybersecurity:
      • EU GDPR and stricter cybersecurity legislation in the EU and UK necessitate robust data handling.
      • In the U.S., CCPA is influential, with calls for new federal privacy laws.
      • Increased focus on explicit consent, data minimization, and transparency in AI-driven decision-making.
    • Payment Processing Regulations:
      • Payment Services Directive 3 (PSD3) in the EU expands on PSD2, introducing stricter mandates on data portability, authentication (SCA), and fraud prevention.
      • The Digital Operational Resilience Act (DORA), effective January 17, 2025, requires financial entities to register ICT third-party service providers.
      • PCI DSS v4.0 is fully effective in 2025, raising data security standards.
      • Visa's Acquirer Monitoring Program (VAMP), with changes from April 2025, tightens controls on chargebacks.
      • KYC and AML requirements are becoming more comprehensive, particularly for cross-border transactions (Visa Direct compliance changes October 2025 and April 2026).
      • ISO 20022 messaging standard becomes mandatory by November 2025.
      • Open Banking initiatives are expanding, with the U.S. CFPB issuing final rules under Section 1033 of the Dodd-Frank Act.
      • Interchange Fee Reforms are anticipated, with the UK expecting final rules in late 2025. A U.S. District Court ruling (implied August 2025) could impact debit card interchange rates.
    • Antitrust Scrutiny:
      • The U.S. Department of Justice (DoJ) continues to probe Visa's financial incentives to fintechs, examining potential anti-competitive practices.
      • European antitrust authorities are actively pursuing cases in financial services.

    Government Incentives and Opportunities

    Governments are increasingly recognizing the benefits of digital payments:

    • Promotion of Digital Payments: Initiatives like tax rebates and discounts encourage the shift from cash, benefiting Visa by increasing transaction volume.
    • Financial Inclusion Initiatives: Governments partner with payment ecosystems to make public disbursement programs more efficient and inclusive.
    • Visa's Own Initiatives: Visa proactively offers incentives to accelerate digital adoption, such as programs for small businesses.

    Geopolitical Factors

    Geopolitical dynamics pose both risks and opportunities:

    • Global Economic Outlook and Stability: Visa's economists project moderate global economic growth in 2025, but with risks from instability, slower interest rate cuts, and government deficits.
    • Geopolitical Instability and Conflicts: Escalating foreign conflicts could strain global supply chains, leading to inflation and hindering economic growth, impacting cross-border transaction volumes.
    • Sanctions and Trade Restrictions: Visa must adhere to U.S. trade sanctions (e.g., OFAC), limiting its operational reach in affected regions.
    • Tariffs and Trade Policies: New tariffs anticipated in 2025 could lead to higher inflation, reduced consumer purchasing power, and slower economic growth.
    • Government Shutdowns: A potential U.S. government shutdown could disrupt services and indirectly impact consumer confidence.
    • Competition from New Payment Technologies: Rise of real-time payment systems, blockchain, and stablecoins presents a competitive challenge, with new networks aiming to bypass traditional card networks.
    • Opportunities in Digital Transformation and AI: The global shift towards digital payments and advancements in AI offer significant growth. Visa is integrating AI into fraud detection and exploring stablecoins for faster cross-border payments.

    In conclusion, Visa Inc. in October 2025 navigates a complex environment characterized by stringent and evolving global regulations in data privacy, payment processing, and antitrust. Simultaneously, it benefits from government-led initiatives promoting digital payments and financial inclusion. Geopolitical risks, including instability, tariffs, and potential government shutdowns, pose challenges, while the rapid evolution of payment technologies, particularly AI and stablecoins, presents both competitive threats and significant opportunities for innovation and growth. Visa's ability to adapt to these multi-faceted factors will be crucial for its sustained financial performance.

    14. Outlook and Scenarios

    As of October 2, 2025, Visa Inc. (V/NYSE) presents a generally robust outlook, underpinned by strong financial performance and strategic initiatives aimed at capitalizing on the evolving digital payments landscape. However, potential headwinds such as regulatory scrutiny and intense competition warrant consideration in both bullish and bearish scenarios.

    Current Performance Snapshot (Fiscal Q2 and Q3 2025)

    Visa has demonstrated strong financial health. In Q2 2025, net revenue grew 9% (11% constant-dollar) year-over-year to $9.6 billion, with non-GAAP EPS up 10% to $2.76. Q3 2025 saw net revenue rise 14% to $10.2 billion, and non-GAAP EPS grew 23% to $2.98. Payments volume increased 8%, cross-border volume by 12%, and processed transactions by 10%. CEO Ryan McInerney noted resilient consumer spending, and the company authorized a new $30 billion share repurchase program.

    Short-Term Projections (Rest of Fiscal Year 2025)

    Analysts anticipate continued growth for Visa in Q4 2025, with revenue projected at approximately $10.81 billion and EPS at $3.07. For the full fiscal year 2025, consensus estimates suggest revenue of $40.30 billion and EPS of $11.56. Visa itself projects adjusted net revenue growth in the high single to low double digits.

    Long-Term Projections (2026-2030 and Beyond)

    The long-term outlook for Visa remains largely positive. Analysts project continued revenue growth, with some forecasts placing Visa's share price around $374.21 by the end of 2025, and potentially reaching $410.02 by 2030, with some bullish estimates as high as $599 by year-end 2030. This growth is expected from the ongoing shift to digital payments, emerging market expansion, and Visa's scalable, high-margin business model.

    Strategic Pivots or Shifts in Company Direction

    Visa is actively pursuing several strategic initiatives:

    1. "Visa as a Service" (VAS): Unbundling its payment stack to integrate deeper into the fintech ecosystem, aiming for VAS and new payment flows to account for 50% of total revenue by 2026.
    2. AI and Fraud Prevention: Developing an "Intelligent Commerce platform" with AI partners (OpenAI, Microsoft, Anthropic) and acquiring Featurespace to enhance real-time AI payments protection.
    3. Stablecoin Settlements: Expanding its digital currency foray with a $1 billion annualized run rate in stablecoin settlements and expanding pilot programs.
    4. Global Market Expansion and Premium Offerings: Focusing on high-growth segments like Asia Pacific (e.g., Visa Infinite cards) and leveraging sponsorships.
    5. Digitization of B2B Payments: Actively pursuing opportunities in this growing market.

    Bull Case Scenario

    In a bull case, Visa benefits from strong global macroeconomic conditions, resilient consumer spending, and accelerated digital payment adoption.

    • Successful execution of "Visa as a Service" strategy.
    • Leading in AI-powered commerce and fraud prevention.
    • Widespread adoption of stablecoin settlements.
    • Strong international growth, especially in Asia Pacific.
    • Effective competitive responses against rivals and fintechs.
      Under this scenario, Visa could exceed analyst expectations, with its stock price potentially reaching the higher end of long-term forecasts (e.g., $425 in the short term and above $500-$599 by 2029-2030).

    Bear Case Scenario

    A bear case for Visa would involve significant setbacks from regulatory pressures, a global economic downturn, or increased competitive disruption.

    • Intensified regulatory scrutiny: Adverse rulings from antitrust lawsuits or new regulations on interchange fees could impact profitability.
    • Macroeconomic headwinds: A severe global recession, high inflation, or sustained elevated interest rates could significantly decline consumer spending.
    • Increased competition and technological disruption: Rapid acceleration of alternative payment systems (real-time bank transfers, CBDCs) could erode market share.
    • Cybersecurity breaches or operational failures: A major breach could damage reputation and lead to losses.
      In this scenario, Visa's growth could slow, potentially leading to its stock price hitting the lower end of analyst targets (e.g., $297-$322 in 2025) or even experiencing a decline.

    In conclusion, Visa Inc. (V/NYSE) is well-positioned for continued growth in the digital payments industry, driven by its strategic focus on innovation, new payment flows, and global expansion. While strong tailwinds exist, investors should closely monitor regulatory developments and the evolving competitive landscape.

    15. Conclusion

    Visa Inc. (V/NYSE) continues to demonstrate robust financial performance and maintain a dominant position in the global payments industry as of October 2, 2025. However, it operates within an evolving landscape marked by increasing regulatory scrutiny and a dynamic competitive environment.

    Key Findings:

    • Strong Financial Performance: Visa reported strong fiscal Q3 2025 results, with revenue up 14% and adjusted EPS up 23% year-over-year, exceeding expectations. The company forecasts high single-digit to low double-digit revenue growth for FY2025.
    • Market Dominance and Competitive Moat: Visa is the leading global payments processor, with a vast network, widespread brand acceptance, and a highly scalable business model characterized by impressive margins and strong free cash flow.
    • Strategic Growth Drivers: The company is actively expanding its Value-Added Services (VAS) and new payment flows (e.g., B2B), which are growing faster than traditional transactions. Significant investments in AI (e.g., VCS Hub, Intelligent Commerce Platform) and stablecoins are aimed at future growth and innovation.

    Investment Appeal: A Balanced Perspective

    Strengths:

    • Leading Market Position and Network Effects: Visa's extensive global network provides a powerful and difficult-to-replicate competitive moat.
    • Resilient Business Model: Its transaction-based revenue model is highly scalable and generates strong, consistent cash flow.
    • Diversified Growth Avenues: Expansion into VAS, new payment flows, and digital/mobile solutions provides additional growth drivers.
    • Shareholder Returns: Consistent dividend increases and substantial share buyback programs underscore its commitment to shareholder value.
    • Positive Analyst Sentiment: A consensus "Strong Buy" or "Moderate Buy" rating with an average price target suggesting upside.

    Challenges:

    • Regulatory and Legal Scrutiny: Ongoing antitrust lawsuits (U.S. DoJ) and legislative initiatives (Credit Card Competition Act) could impact interchange fees and increase competition.
    • Intensifying Competition: Fierce competition from Mastercard, fintechs, real-time payment systems, and stablecoins poses a threat to market share.
    • Valuation Concerns: Some analyses suggest the stock is trading at a premium, potentially limiting near-term upside.
    • Macroeconomic Headwinds: Potential economic downturns or shifts in consumer behavior could impact transaction volumes.

    Conclusion and What Investors Should Monitor:

    Visa Inc. remains a fundamentally strong company with a powerful market position, robust financial health, and clear avenues for continued growth through digital payments and value-added services. Its consistent profitability, strong cash generation, and shareholder-friendly policies make it an attractive long-term investment.

    However, investors should closely monitor several key areas in the near and long term:

    • Regulatory and Legal Outcomes: The progress and resolution of the U.S. Department of Justice antitrust lawsuit and the potential impact of legislative efforts are critical.
    • Competitive Landscape Evolution: Keep an eye on how Visa adapts to and integrates new payment technologies, particularly stablecoins and real-time payment networks, and how it maintains its competitive edge against agile fintechs and rival networks like Mastercard.
    • Global Economic Trends: Consumer spending patterns, cross-border travel volumes, and overall macroeconomic stability will directly influence Visa's core transaction volumes.
    • Innovation and Diversification Execution: Assess Visa's success in expanding its Value-Added Services, B2B payment solutions, and adoption of new technologies like AI and Tap to Phone, as these are crucial for long-term growth and staying ahead of disruption.
    • Valuation and Share Performance: While analysts generally maintain a bullish outlook, investors should continuously evaluate the stock's valuation in light of these opportunities and challenges, especially given recent periods of underperformance relative to broader market indices.

    This content is intended for informational purposes only and is not financial advice

  • FICO: The Unseen Architect of Global Credit – A Deep Dive

    FICO: The Unseen Architect of Global Credit – A Deep Dive

    Date: 10/2/2025

    1. Introduction

    FICO (NYSE: FICO), formally known as Fair Isaac Corporation, stands as an often-unseen but profoundly influential architect in the global financial ecosystem. Best known for its ubiquitous FICO® Score, the company is far more than just a credit scoring agency; it is a leading provider of decision management and predictive analytics solutions. In today's data-driven world, where instantaneous and accurate risk assessment is paramount, FICO's relevance has only intensified. Its technologies power critical decisions across numerous industries, from lending and insurance to telecommunications and retail, making it a pivotal player in facilitating commerce and managing risk. This deep dive will explore FICO's multifaceted business, financial health, market position, and future trajectory, offering a comprehensive view for investors and industry observers alike.

    2. Historical Background

    FICO's journey began in 1956 when engineer Bill Fair and mathematician Earl Isaac founded Fair, Isaac and Company in San Rafael, California. Their vision was to apply mathematical models and data analysis to business problems, a revolutionary concept at the time. Early milestones included developing the first credit scoring system in the 1950s, a breakthrough that transformed lending practices by standardizing risk assessment. The company's most significant transformation occurred in 1989 with the introduction of the FICO® Score, which quickly became the industry standard for consumer credit risk evaluation in the United States. Over the decades, FICO expanded its offerings beyond credit scoring to encompass a broad suite of decision management software, fraud prevention tools, and marketing solutions, leveraging its core expertise in predictive analytics to serve a wider array of enterprise clients globally.

    3. Business Model

    FICO operates a sophisticated business model centered on providing predictive analytics and decision management solutions. Its revenue streams are primarily generated from two core segments:

    • Scores: This segment includes the FICO® Score, which is licensed to credit bureaus, lenders, and other businesses for assessing credit risk. Revenue is generated through transaction fees, subscriptions, and licensing agreements. This segment benefits from its entrenched position as the industry standard.
    • Software: This segment offers a range of enterprise software solutions that leverage FICO's analytical capabilities. These include fraud detection and compliance, customer lifecycle management, originations, collections and recovery, and marketing solutions. Revenue comes from software licenses, maintenance, professional services, and cloud-based subscriptions (SaaS).

    FICO's customer base is diverse, primarily serving financial institutions (banks, credit unions, mortgage lenders), but also extending to insurance companies, retailers, telecommunications providers, and government agencies. The company's strength lies in its ability to translate complex data into actionable insights, helping clients automate and optimize critical business decisions.

    4. Stock Performance Overview

    FICO (NYSE: FICO) has demonstrated a remarkably strong stock performance over various time horizons, reflecting its essential role in the financial infrastructure and its consistent profitability.

    • 1-Year Performance: Over the past year, FICO's stock has generally shown robust growth, often outperforming broader market indices. This can be attributed to the continued demand for its analytics solutions, particularly in an environment where risk management and operational efficiency are paramount for businesses.
    • 5-Year Performance: Looking back five years, FICO's stock has delivered substantial returns, making it a significant wealth generator for long-term investors. This sustained appreciation underscores the enduring value of its credit scoring and decision management platforms, as well as its successful transition to a more recurring revenue model through software and subscription services.
    • 10-Year Performance: Over the last decade, FICO has been an exceptional performer, showcasing a multi-bagger return. This long-term trend highlights the company's strong competitive moat, its ability to innovate within its niche, and the increasing reliance of the global economy on data-driven decision-making. Notable moves often correlate with strong earnings reports, strategic acquisitions, or increased adoption of its cloud-based offerings.

    5. Financial Performance

    FICO consistently exhibits strong financial performance, characterized by healthy revenue growth, robust margins, and efficient capital management. The company's latest earnings reports typically showcase:

    • Revenue Growth: Steady, often high single-digit to low double-digit percentage growth, driven by increasing adoption of its cloud-based software solutions and continued demand for its FICO® Scores. The recurring nature of its revenue model provides stability.
    • Margins: FICO boasts impressive operating and net profit margins, indicative of its high-value, intellectual property-driven business. The leverage inherent in its software and data licensing models allows for significant profitability as revenue scales.
    • Debt: The company generally maintains a manageable debt profile, balancing strategic investments and share buybacks with prudent financial stewardship. Cash flow generation is strong, enabling it to service debt comfortably.
    • Cash Flow: FICO is a strong cash flow generator, with significant free cash flow. This allows for strategic investments in R&D, potential M&A, and returning capital to shareholders through share repurchases.
    • Valuation Metrics: Given its market leadership, high margins, and consistent growth, FICO often trades at a premium valuation compared to broader market averages. Metrics like Price-to-Earnings (P/E) and Enterprise Value-to-EBITDA (EV/EBITDA) reflect investor confidence in its future earnings power and competitive moat.

    6. Leadership and Management

    FICO's leadership team is characterized by a blend of industry veterans and technology-focused executives, steering the company's strategic direction. The CEO, often a long-tenured leader with deep experience in analytics and financial services, typically emphasizes innovation, cloud transformation, and expanding FICO's global footprint. The broader leadership team and board of directors are usually composed of individuals with diverse backgrounds in finance, technology, and corporate governance, providing robust oversight. FICO's strategy generally revolves around enhancing its core FICO® Score, expanding its software platform capabilities (especially in AI and machine learning), and driving recurring revenue through its cloud offerings. The company typically maintains a strong reputation for corporate governance, focusing on ethical data practices and transparent reporting, which is crucial given its role in sensitive financial decisions.

    7. Products, Services, and Innovations

    FICO's product and service portfolio is extensive, built upon a foundation of advanced analytics and decision science.

    • Current Offerings:
      • FICO® Score: The benchmark credit risk score used by 90% of top U.S. lenders.
      • FICO® Platform: An integrated decision management platform that allows enterprises to deploy FICO's analytics and optimize various business processes, from customer acquisition to collections.
      • Fraud & Compliance Solutions: Tools like FICO® Falcon® Fraud Manager, which uses AI to detect and prevent financial crime.
      • Customer Lifecycle Management: Solutions for originations, account management, and collections.
      • Marketing Solutions: Analytics to personalize customer engagement and improve campaign effectiveness.
    • Innovation Pipelines & R&D: FICO consistently invests heavily in R&D, focusing on leveraging cutting-edge technologies like artificial intelligence (AI), machine learning (ML), and cloud computing. Innovations often target alternative data sources for credit scoring, real-time decisioning, and enhancing the predictive power of its models.
    • Patents: FICO holds numerous patents related to its scoring methodologies, analytical algorithms, and decision management systems, protecting its intellectual property and reinforcing its competitive edge.
    • Competitive Edge: Its primary competitive advantage stems from its proprietary data, sophisticated algorithms, and the network effect of the FICO® Score being the industry standard. The high switching costs associated with integrating FICO's solutions into complex enterprise systems also contribute to its moat.

    8. Competitive Landscape

    While FICO enjoys a dominant position in credit scoring, particularly in the U.S., it operates within a competitive landscape across its broader decision management software offerings.

    • Credit Scoring Rivals: While no direct competitor has achieved the same level of ubiquity as the FICO® Score, companies like VantageScore (a joint venture of the three major credit bureaus) offer alternative credit scores. Other players might offer specialized risk scores for specific industries or customer segments.
    • Decision Management Software Rivals: In the broader analytics and decision management space, FICO competes with:
      • Enterprise Software Giants: Companies like SAS Institute, IBM, and Oracle, which offer various analytics and business intelligence platforms.
      • Specialized Analytics Firms: Niche providers focusing on fraud detection, risk management, or customer relationship management.
        • In-house Solutions: Some large financial institutions develop their own proprietary scoring models and decisioning systems.
    • Market Share: FICO maintains a commanding market share in the U.S. consumer credit scoring market. Its software solutions also hold strong positions in specific niches like fraud detection.
    • Competitive Strengths: FICO's strengths include its brand recognition, proprietary data and algorithms, deep industry expertise, vast customer base, and the network effect of its core score.
    • Competitive Weaknesses: Potential weaknesses could include reliance on traditional data sources (though they are addressing this), the cost of its solutions for smaller players, and the need to continuously innovate to stay ahead of rapidly evolving analytical technologies.

    9. Industry and Market Trends

    The credit scoring and decision management industry is dynamic, influenced by several key trends:

    • Digital Transformation: The accelerated shift to digital channels across all industries necessitates real-time, automated decision-making, directly benefiting FICO's software solutions.
    • Alternative Data: Growing interest in using non-traditional data (e.g., utility payments, rent payments, banking transaction data) to assess creditworthiness, especially for "thin file" or "credit invisible" populations. FICO is actively developing solutions incorporating these.
    • Artificial Intelligence & Machine Learning: AI/ML are becoming indispensable for enhancing predictive accuracy, detecting fraud, and personalizing customer experiences. FICO's R&D is heavily focused here.
    • Cloud Adoption: The migration of enterprise software to cloud-based platforms (SaaS) is a major trend, driving FICO's shift to a recurring revenue model and platform-as-a-service offerings.
    • Regulatory Scrutiny: Increased focus on fairness, bias, and transparency in algorithmic decision-making, particularly in lending, which FICO must navigate carefully.
    • Economic Cycles: While FICO's business is somewhat resilient due to its critical nature, economic downturns can impact lending volumes and thus transaction-based revenue. Conversely, periods of economic growth often spur demand for credit and related decisioning tools.

    10. Risks and Challenges

    Despite its strong market position, FICO faces several risks and challenges:

    • Regulatory Scrutiny and Compliance: As a key player in financial decision-making, FICO is subject to intense regulatory oversight (e.g., Fair Credit Reporting Act in the U.S.). Changes in regulations, increased compliance costs, or findings of algorithmic bias could impact its business.
    • Competition: While dominant, FICO faces competition from alternative scoring models, in-house solutions developed by large financial institutions, and emerging fintech companies leveraging new data sources and AI.
    • Data Security and Privacy: Handling vast amounts of sensitive financial data makes FICO a target for cyberattacks. A data breach could severely damage its reputation and lead to significant financial and legal repercussions.
    • Technological Disruption: The rapid pace of innovation in AI, machine learning, and big data analytics requires continuous investment in R&D to maintain its competitive edge. Failure to adapt could lead to obsolescence.
    • Economic Downturns: While resilient, a severe or prolonged economic recession could reduce lending activity, impacting demand for FICO Scores and related software, particularly in areas like originations.
    • Reliance on Credit Bureaus: A significant portion of FICO Score revenue comes through the major credit bureaus. Any changes in their business models or relationships could affect FICO.
    • Algorithmic Bias: Increasing public and regulatory concern over potential biases in AI/ML models could necessitate costly re-development or lead to legal challenges.

    11. Opportunities and Catalysts

    FICO has several compelling opportunities and potential catalysts for future growth:

    • Expansion into New Markets: Significant opportunities exist in emerging economies where credit infrastructure is still developing, and there's a growing need for sophisticated risk assessment tools.
    • Alternative Data Integration: Leveraging alternative data sources to score more consumers (e.g., "credit invisibles") could significantly expand its addressable market and enhance its scoring accuracy.
    • Cloud and SaaS Adoption: Continued migration of its software offerings to the cloud and a subscription-based (SaaS) model provides more predictable, recurring revenue and potentially higher margins.
    • AI and Machine Learning Enhancement: Further integration of advanced AI/ML across its platform can improve the efficacy of its fraud detection, decision management, and personalized marketing solutions, driving greater value for clients.
    • Strategic Acquisitions: FICO could pursue strategic acquisitions of smaller analytics firms or fintech companies to expand its product portfolio, gain new technologies, or enter new industry verticals.
    • Broadening Industry Reach: Beyond financial services, FICO's decision management expertise is applicable to telecommunications, utilities, healthcare, and government, offering avenues for diversification and growth.
    • Near-term Catalysts: Strong quarterly earnings reports, announcements of major new client wins for its FICO® Platform, successful product launches incorporating new AI capabilities, or strategic partnerships could act as positive catalysts.

    12. Investor Sentiment and Analyst Coverage

    Investor sentiment towards FICO is generally positive, reflecting its consistent financial performance, strong market position, and recurring revenue model.

    • Wall Street Ratings: Most Wall Street analysts typically hold "Buy" or "Outperform" ratings for FICO, citing its competitive moat, high margins, and growth opportunities. Price targets are often revised upwards following strong earnings.
    • Hedge Fund Moves: Hedge funds and institutional investors tend to have significant holdings in FICO, often viewing it as a quality growth stock with defensive characteristics due to its essential service. Movements in institutional ownership can provide insights into sentiment.
    • Institutional Investors: Large institutional investors are typically long-term holders, attracted by FICO's stable business model and consistent shareholder returns.
    • Retail Chatter: While less prominent in daily retail chatter compared to high-growth tech stocks, retail investors who are aware of FICO often recognize its "picks and shovels" role in the financial industry and its strong fundamentals. Discussions often revolve around its valuation and long-term growth potential.

    13. Regulatory, Policy, and Geopolitical Factors

    FICO operates in a highly regulated environment, and its business is significantly influenced by policy and, to a lesser extent, geopolitical factors.

    • Laws and Compliance: Key regulations include the Fair Credit Reporting Act (FCRA) in the U.S., which governs how credit information is collected, used, and disseminated. Similar data protection and consumer credit laws exist globally. FICO must ensure its models and operations are compliant, which can be a significant cost.
    • Government Incentives/Disincentives: Policies aimed at expanding financial inclusion or regulating consumer lending practices can directly impact FICO. For instance, initiatives to incorporate alternative data could be a tailwind. Conversely, stricter regulations on algorithmic transparency or bias could impose new burdens.
    • Geopolitical Risks: While FICO's core business is less exposed to direct geopolitical conflicts than, say, manufacturing, global economic instability stemming from geopolitical tensions could impact international lending volumes and overall demand for its services. Cyber warfare also poses an indirect risk to data security.
    • Data Governance: Evolving global data privacy regulations (e.g., GDPR in Europe, CCPA in California) require FICO to continuously adapt its data handling practices, which can be complex and costly.

    14. Outlook and Scenarios

    FICO's future outlook is generally positive, but different scenarios present varying degrees of growth.

    • Bull Case: In a bull scenario, FICO successfully expands its FICO® Platform globally, drives significant adoption of its cloud-based SaaS offerings, and effectively integrates alternative data sources to capture new market segments (e.g., the "unbanked"). Strong economic growth globally would fuel lending activity, boosting demand for FICO Scores. Aggressive M&A in complementary analytics or AI firms could further accelerate growth and market share. Under this scenario, FICO could see sustained double-digit revenue growth and expanding margins, leading to continued premium valuation.
    • Bear Case: A bear scenario could see increased regulatory pressure leading to restrictions on credit scoring models or data usage, significantly impacting FICO's core business. Aggressive competition from new fintech players leveraging superior AI or alternative data could erode market share. A prolonged global recession would dampen lending volumes and enterprise software spending, hurting FICO's revenue. A major data breach or reputational damage due to algorithmic bias could also severely impact the stock. In this case, FICO might experience stagnant growth, margin compression, and a de-rating of its stock multiple.
    • Short-term Projections: In the short term (next 12-18 months), FICO is likely to benefit from ongoing digital transformation efforts by financial institutions and continued demand for fraud prevention solutions. Its cloud transition will be a key metric to watch.
    • Long-term Projections: Over the long term, FICO's success hinges on its ability to remain at the forefront of predictive analytics, adapt to evolving data privacy landscapes, and expand its decision management solutions into new industries and geographies. Strategic pivots towards broader AI-powered enterprise intelligence could unlock significant value.

    15. Conclusion

    FICO stands as a foundational pillar of the modern financial system, its ubiquitous FICO® Score and sophisticated decision management solutions indispensable for risk assessment and operational efficiency. The company boasts a strong historical track record, robust financial performance, and a significant competitive moat built on proprietary data, algorithms, and industry standardization. While facing challenges from regulatory scrutiny, evolving data privacy norms, and continuous technological innovation, FICO is well-positioned to capitalize on opportunities in cloud adoption, AI integration, and expansion into new markets and data sources.

    For investors, FICO presents a compelling case as a high-quality, profitable company with strong recurring revenue and significant barriers to entry. However, its premium valuation necessitates careful consideration of growth drivers and potential risks. Investors should closely watch FICO's progress in its cloud transformation, its ability to innovate with AI and alternative data, and any shifts in the regulatory landscape governing credit and data. Its long-term trajectory will depend on its continued ability to adapt and lead in the ever-evolving world of predictive analytics.


    This content is intended for informational purposes only and is not financial advice

  • Corteva: A Deep Dive into the Future of Agricultural Innovation

    Corteva: A Deep Dive into the Future of Agricultural Innovation

    10/2/2025 – Corteva Agriscience (NYSE: CTVA) stands as a pivotal global agricultural technology company, dedicated to equipping farmers with an extensive array of seed, crop protection, and digital solutions. Emerging in 2019 as a strategic spin-off from DowDuPont, Corteva, headquartered in Indianapolis, Indiana, extends its operations across 110 countries. The company's core mission revolves around pioneering products for seeds and crop protection, encompassing herbicides, insecticides, fungicides, and biologicals, marketed under renowned brands such as Pioneer and Brevant. With approximately $17.23 billion in net sales in 2023 and a market valuation around $50 billion, Corteva is recognized as one of the top three global leaders in agricultural inputs.

    Corteva is currently at the center of investor attention due to its recently unveiled plan to bifurcate into two distinct, publicly traded entities. This significant corporate restructuring, unanimously approved by its board of directors, is slated for completion in the latter half of 2026. The separation will establish "New Corteva," focusing on the crop protection business with estimated 2025 net sales of $7.8 billion, and "SpinCo," which will house the seed business, anchored by the iconic Pioneer brand, projected to achieve $9.9 billion in net sales in 2025. This strategic move aims to sharpen the focus of each business, allowing for optimized strategies and capital allocation in response to the evolving agricultural landscape.

    Beyond this transformative split, Corteva's relevance is underscored by its continuous innovation in addressing global food security and sustainability challenges. The company allocates approximately 8% of its sales, roughly $4 million daily, to research and development, driving advancements in seed traits, crop protection, gene editing (e.g., CRISPR-Cas), precision agriculture, and biologicals. Corteva's commitment to "climate-positive farming" solutions, including naturally derived crop protection and lower-carbon feedstocks for biofuels, positions it as a key player in shaping the future of sustainable agriculture.

    2. Historical Background

    Corteva Agriscience's journey as an independent global agricultural leader commenced on June 1, 2019, following its strategic spin-off from DowDuPont. This establishment was the culmination of a multi-year vision to forge a specialized leader in agricultural science, integrating the extensive agricultural portfolios of Dow Chemical and DuPont.

    Founding Story: The genesis of Corteva traces back to the 2017 merger of Dow Chemical and DuPont, a union conceived with the explicit intent of subsequently segmenting into three distinct public companies: Dow (materials science), DuPont (specialty products), and Corteva Agriscience (agriculture). Corteva was formally constituted in March 2018 as a DowDuPont subsidiary, consolidating the agricultural divisions of both parent companies, including Dow AgroSciences and DuPont Pioneer. The name "Corteva," a blend of Latin "cor" (heart) and an ancient word "teva" (nature), encapsulates its mission in agricultural science and environmental stewardship. Upon its official launch, Corteva debuted with an estimated initial market capitalization of approximately $28 billion on the NYSE, bringing together a rich legacy of scientific innovation.

    Early Milestones: In its formative years, Corteva concentrated on integrating its vast product offerings, which included established seed brands like Pioneer and Brevant Sementes, alongside a broad spectrum of crop protection products. Significant early achievements included the introduction of the Enlist E3 soybean system, which swiftly became a leading trait system in the U.S. The company also expanded its global footprint by opening Seed Applied Technology Centers in France and Brazil in 2019. A notable strategic adjustment occurred in February 2020 when Corteva ceased chlorpyrifos production, a move influenced by declining sales and health concerns. By June 2024, Corteva marked five years of operations, having launched approximately 2,000 new products, achieved over $78 billion in cumulative net sales, and increased its annual operating EBITDA by 63%.

    Key Transformations Over Time: Corteva's history is characterized by its foundational transformation from a conglomerate's agricultural divisions into a specialized, independent entity, and its ongoing strategic evolution. The DowDuPont merger and subsequent spin-off (2017-2019) were the most defining, instantly positioning Corteva as a global leader. Post-spin-off, a major transformation involved integrating diverse legacy operations and intellectual property into a cohesive "pure-play" agriculture company. Corteva has also strategically expanded into the rapidly growing biologicals market through acquisitions like Stoller Group and Symborg. A sustained commitment to R&D, focusing on genomics, biotechnology, and new active ingredients, has been a constant. Looking ahead, the company's announced plan in October 2025 to split into two independent entities—"New Corteva" (crop protection) and "SpinCo" (seeds)—represents another profound transformation, aimed at further sharpening focus and maximizing long-term value.

    3. Business Model

    Corteva Agriscience operates a robust business model centered on delivering agricultural solutions to farmers worldwide, primarily through its Seeds and Crop Protection segments, supplemented by digital services and a broad customer base.

    Revenue Sources: Corteva's revenue is predominantly generated from the sale of essential agricultural products. In 2024, the company's net sales reached approximately $16.9 billion. The two main segments contribute significantly:

    • Seed Sales: Accounting for about $9.5 billion in net sales in 2024 (approximately 56% of total revenue), this includes corn seeds ($4.2 billion in 2023), soybean seeds ($1.6 billion in 2023), and other seeds.
    • Crop Protection Sales: Generating around $7.4 billion in net sales in 2024, this segment comprises herbicides, insecticides, fungicides, and seed treatments.
    • Licensing Agreements: Corteva also earns revenue through licensing agreements for its proprietary technologies.

    Product Lines: Corteva offers a comprehensive portfolio designed to enhance crop yields and protect against threats:

    • Seeds: High-performance seeds under brands like Pioneer® and Brevant® for crops such as corn, soybeans, canola, sunflower, rice, and wheat. This includes advanced traits like the Enlist™ weed control system and Pioneer Protector® traits for disease resistance.
    • Crop Protection: Products for weed control (herbicides), insect management (insecticides), fungal disease control (fungicides), and seed treatments. This segment also includes a growing focus on biologicals—environmentally friendly solutions for crop protection and enhancement—and nitrogen stabilizers.
    • Other Products: Offerings for vegetation management, range & pasture, pest management, turf & ornamental, and post-harvest protection.

    Services: Corteva integrates digital and advisory services to help farmers optimize operations:

    • Digital Agricultural Tools: Platforms like Granular Insights provide data-driven insights for optimizing seed selection and crop management.
    • Farmer Training and Education Programs: Programs to educate farmers on product utilization and sustainable practices.

    Segments: Corteva operates through two primary segments:

    • Seed Segment: Focuses on research, development, production, and sale of seeds with advanced genetics.
    • Crop Protection Segment: Concentrates on developing and marketing products to protect crops from various stresses.

    Notably, Corteva announced in October 2025 a plan to separate these two businesses into independent, publicly traded companies by the second half of 2026. The crop protection business will retain the "New Corteva" name, while the seed-focused entity will be called "SpinCo."

    Customer Base: Corteva serves a diverse global customer base, including individual farmers, large-scale commercial operations, and agricultural cooperatives (approximately 3,200 worldwide). The company also partners with about 750 global agricultural businesses. With a presence in North America, Latin America, Europe (EMEA), Asia Pacific, and the Middle East, Corteva aims to build loyalty through high-performing, tailored solutions that enhance productivity and sustainability.

    4. Stock Performance Overview

    10/2/2025 – Corteva Inc. (CTVA) initiated regular trading as an independent, publicly traded company on June 3, 2019, following its spin-off from DowDuPont. Its initial trading price was approximately $25.675. Therefore, any analysis of Corteva's 10-year performance inherently covers its entire history as a standalone entity.

    1-Year Performance (Approximately October 2024 – October 2025): Over the past year, Corteva's stock has demonstrated growth, with reported increases of 4.72% to 6.00% by different sources. Including dividends and splits, the "1 Year Price Total Return" was approximately 41.4% as of Investing.com data. The stock reached a 52-week high of $77.41 and a low of $53.40. A significant event impacting the stock was the announcement on October 1, 2025, of its plan to separate into two independent companies. This news, initially reported on September 12, 2025, led to a 14.5% decline in the stock price from $74.29 to $63.14 by October 1, 2025, as investors weighed potential operational disruptions against long-term value creation.

    5-Year Performance (Approximately October 2020 – October 2025): Corteva has exhibited strong growth over the last five years, with its stock price appreciating by 109.08%. An initial $1,000 investment at IPO in 2019 would have grown to approximately $1,535 by September 29, 2025, representing a compound annual growth rate of 16.77% over six years. The company has consistently increased its dividends for five consecutive years. During this period, Corteva reported robust financial results, though its crop protection segment faced competitive pricing and unfavorable currency impacts, while the seed business benefited from strong demand and increased corn acreage in North America.

    10-Year Performance (Reflecting Spin-off in 2019): Since its inception in June 2019, Corteva's shares have surged over 133%. From its initial trading price in the mid-$20s, the stock has climbed into the $60-$70 range, hitting an all-time high of $76.93 in July 2025. This trajectory underscores significant value generation for shareholders since its spin-off. Overall, Corteva's performance has been bolstered by operational discipline, cost reduction, and continuous R&D investment, particularly in new products and biological solutions. The impending separation is the most recent and impactful event, poised to redefine its future strategic direction and financial performance.

    5. Financial Performance

    10/2/2025 – Corteva (NYSE: CTVA) has demonstrated a dynamic financial performance, marked by strategic operational execution and resilience in a complex market. The company's financials reflect its position as a pure-play agriculture company.

    Latest Earnings and Revenue Growth (Q2 2024 & FY 2024):

    • Q2 2024: Net sales were $6.11 billion (up 1% year-over-year), slightly below estimates. GAAP income from continuing operations was $1.06 billion, with EPS of $1.51 (up 23%). Operating EPS was $1.83, and Operating EBITDA reached $1.92 billion (up 10%). Seed net sales increased 5% in price but declined 2% in volume. Crop Protection net sales were flat, with a 6% volume increase offset by a 5% price decline.
    • First Half 2024: Net sales were $10.60 billion (down 3% from 2023). GAAP income was $1.43 billion, with an EPS of $2.03. Operating EBITDA was $2.95 billion.
    • Full Year 2024: Net sales were $16.9 billion (down 2% from 2023, but organic sales up 1%). Net income was $907 million, with an EPS of $1.30. Q4 2024 net sales increased 7% to $4.0 billion, with organic sales up 13%.
    • Guidance (FY 2025): Corteva projects FY 2025 EPS of $3.00-$3.20 and revenue between $17.6 billion and $17.8 billion. Operating EBITDA midpoint is expected to increase to $3.8 billion. Q3 2025 earnings are estimated for November 4, 2025.

    Margins: Corteva shows varying margin performance:

    • Full Year 2024: Gross Profit Margin ~54.5%, Operating Profit Margin ~10.8%, Net Profit Margin ~7.1%.
    • TTM (September 2025): Operating Margin 13.13%.
    • Q2 2024: Operating EBITDA margin expanded ~250 bps, driven by a ~500 bps improvement in Seed, while Crop Protection saw a 365 bps decline.
    • Longer Term: Net profit margin for Q2 2025 was 8.16%. Average net profit margin for 2024 was 4.54% (up 15.77% from 2023). 3-year revenue growth rate is 4.8%, gross margin 45.65%.

    Debt: Corteva manages its debt prudently:

    • Total Debt: $3.62 billion USD (June 2025); $2.7 billion (December 2024).
    • Long-Term Debt (June 2025): $1.687 billion (down 31.73% year-over-year).
    • Debt-to-Equity: 13.9% (satisfactory).
    • Debt Coverage: Well covered by operating cash flow (86.6%) and EBIT (29.9x interest coverage).
    • Liquidity: Current ratio 1.48, quick ratio 1.13 (December 2024), indicating solid liquidity.

    Cash Flow: Corteva has increased its free cash flow:

    • Free Cash Flow (TTM June 2025): $2.594 billion. Annual FCF for 2024 was $1.553 billion (up 26.16% from 2023). Raised full-year FCF guidance to $1.9 billion.
    • Operating Activities (2024): Net cash provided was $2.416 billion (up from $2.336 billion in 2023).

    Key Valuation Metrics:

    • Market Cap: ~$41.74 billion to $45.93 billion.
    • P/E Ratio: Trailing 30.22x-47.5x; Forward 18.50x-20.24x. Some suggest undervaluation at 30.78x, near historical lows.
    • P/S Ratio: 2.46-2.53.
    • P/B Ratio: 1.61-1.66.
    • EV/EBITDA: 12.10x-13.8x.
    • Dividend: Yield ~1.14%-1.15%; Annual $0.68/share. Payout ratio ~50.5%-54.62% (sustainable). Recently increased quarterly dividend to $0.18/share.
    • Analyst Consensus: Generally "Strong Buy" or "Moderate Buy," with average 12-month price targets from $69.93 to $82.00, suggesting an 18-27% upside. Simply Wall St estimates fair value at $72.49, indicating 23% undervaluation.

    Corteva's upcoming separation into two companies is expected to further drive margin expansion and sustainable growth.

    6. Leadership and Management

    Corteva, Inc. is guided by a well-defined leadership structure, an evolving corporate strategy, and a robust governance framework.

    Corteva's CEO: Chuck Magro currently serves as Chief Executive Officer, appointed in November 2021. Under his leadership, Corteva has achieved substantial growth and margin expansion, particularly with its Pioneer brand dominating corn and soybean technology in the U.S. The company has returned nearly $4 billion in cash to shareholders between 2021 and 2024. Following the announced strategic separation, Magro is slated to become the CEO of "SpinCo," the independent seed genetics business, post-split in the second half of 2026.

    Leadership Team: Corteva's leadership team is instrumental in shaping the company's strategic direction, focusing on innovation, diversity, and sustainable practices. Key members include David Johnson (CFO), Sam Eathington (CTO & Digital Officer), Robert King (Crop Protection BU), Judd O'Connor (Seed BU), Audrey Grimm (Chief People Officer), Cornel B. Fuerer (Strategic Advisor & Corporate Secretary), and Jeff Rudolph (Chief Strategy Officer). The management team boasts an average tenure of approximately 3.4 years.

    Board of Directors: The Board provides critical strategic oversight and governance, ensuring the company's mission to enhance farmer productivity and develop sustainable global food systems is met. The average tenure of the board is 5.9 years. Gregory R. Page, the Non-Executive Chair, a former Chairman and CEO of Cargill, is expected to lead "New Corteva" (the crop protection business) as its chairman post-split. Other notable board members include Lamberto Andreotti, Klaus A. Engel, and Michael O. Johanns.

    Corporate Strategy: Corteva's most significant strategic move is the announced separation into two independent, publicly traded companies by mid-2026. This split aims to allow "New Corteva" (crop protection) and "SpinCo" (seeds) to pursue distinct market strategies with dedicated leadership and capital allocation. This aligns with Corteva's broader strategy of cost reductions, portfolio simplification, and technology investment. The company also focuses on expanding its product portfolio, market reach, and investing heavily in R&D, aiming to launch 20 new products with substantial revenue potential in 2024 and 2025. Disciplined capital allocation, including targeted M&A and share repurchases, and investment in its digital agriculture platform, Granular, are also key strategic pillars.

    Governance Reputation: Corteva maintains robust corporate governance arrangements, aligning with regulatory requirements and its enterprise risk management program. The Board of Directors oversees risks related to business strategy, reputation, and sustainability. Committees like the Sustainability and Innovation (S&I) Committee, Audit Committee, People and Compensation Committee, and Governance and Compliance Committee play crucial roles in overseeing ESG goals, financial risks, human capital management, ethics, and enterprise risk management. Corteva's ESG Risk Rating from Sustainalytics reflects its commitment to strong environmental, social, and governance performance.

    7. Products, Services, and Innovations

    10/2/2025 – Corteva Agriscience maintains a comprehensive portfolio of products and services, driven by a robust innovation pipeline, significant R&D investments, a strong patent estate, and a competitive edge rooted in advanced agricultural technologies.

    Corteva's Current Product and Service Offerings

    Corteva's offerings span two primary segments: Seeds and Crop Protection, complemented by a growing suite of digital solutions.

    • Seed Products: High-performance germplasm and traits for major crops under brands like Pioneer®, Brevant®, and regional labels. This includes corn technologies (e.g., Vorceed® Enlist®, PowerCore® Enlist®, Qrome® corn products) and soybean varieties (e.g., Enlist E3® Soybeans, Plenish® high oleic soybeans). Corteva produces over 2,500 corn hybrids and 1,800 soybean varieties.
    • Crop Protection Products: Innovative solutions to protect crops from weeds (herbicides like Arylex™ Active), diseases (fungicides such as Inatreq™ active and Adavelt™ active), and insects (insecticides like Blackhawk™ Naturalyte). This segment also includes seed treatments and a rapidly expanding biologicals portfolio.
    • Digital Solutions: Platforms like Granular Insights provide data-driven insights for optimizing seed selection and crop management, while LandVisor™ offers comprehensive land management tools. Corteva also offers Carbon Solutions to incentivize regenerative farming practices and leverages AI for crop yield prediction.

    Innovation Pipelines

    Corteva's R&D pipeline addresses global agricultural challenges such as food security and climate change. Key areas of innovation include:

    • Biotech Traits and Gene Editing: Developing early-stage seed solutions for disease resistance and leveraging CRISPR-Cas technology.
    • Next-Generation Crop Protection: Introducing new modes of action for herbicides, insecticides, and fungicides, including third and fourth-generation insect control technology.
    • Biologicals: Expanding its biologicals business with products like Utrisha™ N, aiming for $1 billion in annual revenues by the end of the decade.
    • Hybrid Wheat Systems: Developing proprietary hybrid wheat systems with potential yield advantages of 10-20%.
    • Reduced Stature Corn: An emerging technology to improve crop resilience.
    • Biofuels: Researching bio-feedstock for low-carbon biofuels.
    • Seed and Trait Out-licensing: A strategic growth platform to strengthen royalty income.

    R&D Investments

    Corteva invests approximately 8% of its sales into R&D, equating to roughly $4 million daily. Annual R&D expenses for 2024 were $1.402 billion, projected to increase to $1.423 billion for the twelve months ending June 30, 2025. The company recently broke ground on a $27.5 million Process Research & Development Lab in Midland, set for completion in early 2027.

    Patents

    Corteva holds a substantial global intellectual property portfolio with 2,799 patents worldwide, 1,915 of which are active across 625 unique patent families. The U.S., Europe, and China are key regions for its patent filings. Corteva, alongside Bayer, controls nearly 80% of patents related to genetically engineered crops.

    Competitive Edge Through Technology

    Corteva maintains its leading position through:

    • Continuous Innovation: Consistent R&D investment drives a steady stream of new products.
    • Proprietary Technologies: Unique technologies like hybrid wheat systems and advanced gene-editing capabilities.
    • Diverse Product Portfolio: A broad range of seeds and crop protection products, coupled with digital solutions.
    • Sustainability Focus: All new solutions meet sustainability criteria, with an emphasis on environmentally friendly and targeted solutions.
    • Digital Transformation: Platforms like Granular Insights, AI, and machine learning for data-driven insights.
    • Strategic Separation: The planned split into "New Corteva" (crop protection) and "SpinCo" (seeds) is designed to sharpen focus, optimize capital allocation, and enhance responsiveness to market shifts, thereby maximizing long-term value.

    8. Competitive Landscape

    10/2/2025 – Corteva Agriscience operates within a highly concentrated and intensely competitive global agricultural inputs industry. Its primary rivals include a handful of multinational corporations that dominate the market for seeds, crop protection products, and digital farming solutions.

    Key Competitors and Their Market Share

    The agricultural inputs market is largely controlled by four major players: Bayer, Corteva, Syngenta Group, and BASF. These companies hold significant sway in both the global seed and pesticide markets.

    • Bayer Crop Science: A formidable global competitor with a diverse portfolio, strengthened by its acquisition of Monsanto. Bayer held 23% of the global seeds market as of 2025. In U.S. corn, soybean, and cotton retail seed sales from 2018-2020, Corteva and Bayer collectively accounted for over half the market. Bayer CropScience reported sales of €4.788 billion in Q2 2025.
    • Syngenta Group: Owned by the Chinese state-owned enterprise Sinochem, Syngenta offers a broad range of crop protection products and seeds. In 2023, Syngenta Group reported total sales of $32.2 billion, with $15.5 billion from Crop Protection and $4.8 billion from Seeds. It held an estimated 12.7% of the total U.S. pesticide manufacturing revenue.
    • BASF Agricultural Solutions: A division of BASF SE, providing crop protection, seeds, and digital farming solutions. Its Agricultural Solutions segment generated €10.09 billion in sales in 2023, aiming to strengthen its position as an integrated provider.
    • FMC Corporation: A significant competitor in crop protection and agricultural solutions.
    • Nutrien: One of the largest providers of crop inputs and services, including potash, nitrogen, and phosphate, with an extensive retail network. Nutrien, Mosaic, ICL, and K+S collectively occupy 50% of the global potash fertilizer market.

    In the U.S. corn seed market (2018-2020), Corteva and Bayer together accounted for 71.6% of sales, and 65.9% of U.S. soybean seed sales.

    Corteva's Competitive Strengths

    • Diverse Product Portfolio: A broad range of seeds (Pioneer, Brevant) and crop protection solutions (herbicides, insecticides, fungicides, biologicals) caters to diverse farming needs.
    • Strong Research & Development (R&D) Capabilities: Consistent heavy investment in R&D (approximately 8% of sales) drives continuous innovation in seed technologies, gene-editing, and sustainable crop protection.
    • Global Market Presence: A robust footprint in over 110 countries, with significant operations in North America, EMEA, Latin America, and Asia Pacific.
    • Integrated Business Model (Pre-Split): The current integrated model facilitates cross-selling and shared R&D, aligning with industry standards.
    • Commitment to Sustainability: All new solutions meet sustainability criteria, aligning with market trends and demand for environmentally friendly practices.

    Corteva's Competitive Weaknesses

    • Intense Competition: Constant pressure from major rivals on market share and pricing.
    • Market Volatility and Commodity Price Dependency: Performance is significantly impacted by fluctuations in agricultural commodity prices and market volatility.
    • Regulatory Hurdles: Operates in a complex regulatory environment, affecting product approvals and market access.
    • High Research and Development Costs: Significant R&D investment (10.3% of revenue in 2023) can impact short-term profitability.
    • Supply Chain Vulnerabilities: Global supply chain challenges can disrupt operations, leading to increased costs and potential revenue loss.
    • Lower Consumer Brand Recognition: Compared to some rivals, Corteva has lower consumer brand recognition (38% vs. 52-65% for competitors).
    • Upcoming Business Split: While strategic, the planned separation into two companies by mid-2026 introduces concerns about the potential loss of synergies, which could weaken its competitive stance against integrated rivals. The seed division (SpinCo) is projected at $9.9 billion in 2025 net sales, and the crop protection business ("New Corteva") at $7.8 billion.

    9. Industry and Market Trends

    10/2/2025 – The agricultural inputs industry is undergoing profound transformations, shaped by a complex interplay of sector-level trends, macro drivers, supply chain dynamics, and cyclical effects. These forces dictate the landscape for suppliers of seeds, fertilizers, crop protection, and agricultural machinery.

    Sector-Level Trends

    1. Fertilizers: The market is projected to reach $246.6 billion by 2033 (CAGR 3.07% from 2025). Key trends include a shift towards sustainable agriculture, boosting demand for organic and bio-based fertilizers and slow-release formulations. Precision agriculture can reduce fertilizer volumes by up to 5% by 2040. Geopolitical instability also influences the market.

    2. Seeds: Expected to reach $53.53 billion by 2033 (CAGR 1.53% from 2025). Trends include surging demand for hybrid and high-yield seeds, increased adoption of genetically modified (GM) seeds, and rising demand for organic/non-GMO varieties. R&D in seed treatment and climate-resilient varieties is significant.

    3. Crop Protection: Projected to grow from $87.6 billion in 2023 to $114.7 billion by 2028 (CAGR 5.5%). Strong growth is seen in biological crop protection products, driven by sustainable farming demands and reduced environmental impact. Precision agriculture and RNA-based solutions are also emerging.

    4. Agricultural Machinery: Valued at $152.89 billion in 2025, projected to grow at a CAGR of 4.9% through 2033. Trends include AI-powered and autonomous machinery, electrification, and precision agriculture with smart sensors. Automation addresses labor shortages, while high input costs lead farmers to extend machine lifespans or invest in used equipment.

    Macro Drivers

    • Population Growth and Food Demand: A global population projected to reach 9.7 billion by 2050 drives demand for increased food production and, consequently, agricultural inputs.
    • Climate Change: Leads to investment in drought-tolerant and pest-resistant crops, and influences demand for inputs that withstand extreme weather, exacerbating pest damage and impacting synthetic input effectiveness.
    • Sustainability and Environmental Concerns: Drives demand for organic, bio-based inputs, and precision agriculture to minimize waste and pollution.
    • Technological Advancements: AI, IoT, big data, drones, and satellite imagery revolutionize farming through precision agriculture, optimizing resource use and improving productivity.
    • Government Policies and Regulations: Initiatives promoting sustainable agriculture, mechanization, and regulations on agrochemical use significantly impact the market.
    • Energy Prices: Directly affect the cost of producing and transporting agricultural inputs.
    • Global Economic Conditions: Economic cycles, interest rates, and trade policies influence farmer profitability and investment capacity.

    Supply Chains

    Agricultural input supply chains face disruptions from geopolitical uncertainties, high freight costs, raw material concentration (e.g., phosphates), and labor shortages. Efficient inventory management and improved communication among trading partners are crucial.

    Cyclical Effects

    • Commodity Prices and Farm Income: High commodity prices boost farm income, leading to increased input investment; low prices reduce spending. Current low commodity prices and high input costs create strain.
    • Weather Patterns: Favorable weather can depress commodity prices; unfavorable weather increases demand for resilient inputs.
    • Seasonal Demand: Demand for certain machinery peaks during planting seasons.
    • Government Support: Subsidies and policies can positively affect farm income and input markets.
    • Global Economic Cycles: Broader economic trends directly impact the agriculture sector.
    • Input Cost-Revenue Lag: Input costs often remain elevated longer than revenues during downturns.
    • Disease and Pest Pressure: Increased problems drive demand for crop protection and resilient seeds.

    In essence, the agricultural inputs industry is navigating a period of significant transformation. While population growth and technological advancements offer opportunities, challenges like climate change, supply chain vulnerabilities, and commodity market cyclicity demand constant adaptation and innovation. The overarching shift towards sustainable and precision agriculture is a defining theme across all input sectors.

    10. Risks and Challenges

    10/2/2025 – Corteva faces a diverse set of risks and challenges inherent to the agribusiness sector, spanning operational complexities, stringent regulatory landscapes, potential controversies, and dynamic market conditions.

    Operational Risks

    Corteva's global supply chain is vulnerable to disruptions, leading to increased costs and raw material shortages. Events such as energy supply issues or China's export allocations can severely impact manufacturing and distribution. The planned separation of its seed and crop protection businesses into two independent companies by mid-2026, while strategic, introduces operational risks like the potential loss of synergies between integrated segments. This could complicate the development of combined solutions and potentially weaken Corteva's competitive standing against fully integrated rivals. The company also faces general risks from industrial espionage and IT system disruptions.

    Regulatory Risks

    Corteva operates in a highly regulated industry globally:

    • Antitrust Scrutiny: A U.S. government investigation into agricultural input suppliers, including Corteva, for potential antitrust violations, could impact business practices and pricing strategies.
    • Pesticide and Seed Regulations: Products must meet stringent government standards and undergo extensive testing and review by agencies like the U.S. EPA. This includes recurring registration reviews and compliance with regulations in over 100 countries.
    • Bans and Restrictions: Corteva ceased production of chlorpyrifos (Lorsban) by the end of 2020 due to declining sales and health concerns, following bans in various regions. A federal appeals court also ruled that the U.S. EPA unlawfully approved an expanded use of a Corteva pesticide without assessing its danger to honeybees. Furthermore, some Corteva products banned in the EU are still manufactured and exported to countries with weaker regulations.

    Potential Controversies

    Corteva has been involved in several controversies:

    • PFAS Contamination: Numerous class-action lawsuits and settlements over PFAS contamination of drinking water and groundwater, including a $65.25 million settlement in New York and lawsuits from multiple U.S. states and municipalities.
    • Pesticide-Related Health and Environmental Concerns: This includes potential class-action lawsuits related to chlorpyrifos and allegations of widespread crop damage from dicamba (an estimated 650,000 acres of soybeans damaged in Arkansas in 2021). A lawsuit also alleged worker exposure to aerially sprayed pesticide in Illinois.
    • Environmental Violations: Over $40 million in fines for environmental violations between 2018-2022, including a $3.2 million settlement for alleged federal pollution control law violations at a Texas plant where a 2014 accident killed four workers.
    • Anticompetitive Practices: Allegations of paying distributors to exclude competitors' generic options.
    • Intellectual Property Disputes: A lawsuit against Inari Agriculture, Inc. for allegedly unlawfully obtaining and modifying Corteva's patented seed technology.

    Market Risks

    • Intense Competition: Stiff competition from major players like Bayer, Syngenta, and BASF impacts market share and pricing power. Bayer and Corteva collectively control approximately 70% of the U.S. corn and soybean seed market.
    • Market Volatility and Commodity Prices: Fluctuations in agricultural commodity prices and higher interest rates reduce farmer margins, impacting spending on inputs.
    • Demand Fluctuations: Farmers' "just-in-time" purchasing behavior and events like floods can depress demand for crop protection products.
    • Geopolitical and Economic Conditions: A stronger U.S. dollar, shifts in purchasing strategies (e.g., China's preference for South American soybeans), and geopolitical tensions can significantly impact sales.
    • Climate Change Impact: A long-term threat necessitating continuous innovation in seeds and crop protection.
    • Impact of Business Separation: The proposed split, while strategic, could lead to initial operational disruptions, loss of existing synergies, and investor uncertainty, with some analysts expressing concerns about potential "dis-synergies" and transaction costs.

    11. Opportunities and Catalysts

    10/2/2025 – Corteva Agriscience is actively pursuing a multi-faceted strategy to drive growth, expand into new markets, and enhance shareholder value, underpinned by a significant corporate restructuring.

    Growth Levers

    Corteva's growth strategy is built on expanding its product portfolio, increasing market reach, and substantial R&D investment. The company projects net sales growth of 6% to 8% and operating EBITDA growth of 9% to 11% through 2027.

    • Product Portfolio Expansion: Continuous launch of new seed varieties with enhanced traits and innovative crop protection solutions. Corteva aims to launch 20 new products with over $200 million in revenue potential in 2024 and 2025.
    • Digital Agriculture: Significant investment in Granular, its digital agriculture platform, to provide data-driven insights, optimize decision-making, and support sustainable practices, including carbon solutions.
    • Biologicals: A rapidly growing segment, with Corteva aiming for $1 billion in annual revenues from biologicals by the end of the decade.
    • Advanced Genetics and Gene Editing: Leveraging over a century of hybrid corn breeding and exploring CRISPR-Cas technology. The company recently announced proprietary non-GMO hybrid technology in wheat, with launches planned as early as 2027 in North America.
    • Out-licensing: A strategic growth platform to increase royalty income from its seed and genetics technologies.

    New Markets

    Corteva is focused on geographical and product portfolio expansion:

    • Emerging Geographical Markets: Actively entering regions with high agricultural productivity potential, such as Latin America, where digital platforms are a focus.
    • Biologicals Market: A significant new frontier, projected to exceed $20 billion by 2035, with Corteva positioned as a major player through recent acquisitions.
    • Biofuels and Hybrid Wheat: Pursuing opportunities in biofuels for lower-carbon alternatives and in hybrid wheat, which offers substantial yield advantages, particularly in water-stressed environments. The wheat seed market historically presents a significant expansion opportunity.

    M&A Potential

    Corteva's financial strategy includes disciplined capital allocation, with a focus on targeted mergers and acquisitions.

    • Recent Acquisitions: Expanded its biologicals business by acquiring Symborg and Stoller Group, Inc. for $1.2 billion in late 2022 and early 2023, bringing immediate scale and profitability.
    • Future M&A Post-Split: The announced separation into two independent companies is expected to enable more "disciplined M&A" for the Crop Protection business ("New Corteva") and "targeted M&A" for the Seed business ("SpinCo"), allowing each to pursue specialized growth opportunities.

    Near-term Events

    • Corporate Separation: On October 1, 2025, Corteva announced its plan to separate into two independent, publicly traded companies by the second half of 2026. "New Corteva" will focus on crop protection ($7.8 billion estimated 2025 sales), and "SpinCo" on seeds ($9.9 billion estimated 2025 net sales). The transaction is structured to be tax-free for U.S. shareholders.
    • Upcoming Earnings: Corteva's next earnings date is estimated for Wednesday, November 5, 2025 (Q3 2025).
    • Product Launches (2025): Including Forcivo™ Fungicide for corn and soybeans, Salibro® CA Nematicide, expansion of Brevant® Seeds portfolios, new preemergence soybean herbicides (Kyber® Pro, Sonic® Boom), Incitro Insecticide in Brazil, and Pioneer brand Plenish high oleic soybean varieties with the Enlist E3 trait.

    Corteva's reaffirmation of its full-year 2025 guidance and its 2027 value framework, through these strategic initiatives and the upcoming separation, demonstrates confidence in its future growth trajectory.

    12. Investor Sentiment and Analyst Coverage

    10/2/2025 – Investor sentiment surrounding Corteva (NYSE: CTVA) is generally optimistic, characterized by positive Wall Street ratings, dynamic hedge fund activity, substantial institutional ownership, and varied retail investor commentary.

    Wall Street Ratings

    Corteva consistently receives a favorable outlook from Wall Street analysts, with a consensus rating often cited as a "Moderate Buy" or "Strong Buy." The average price target typically ranges from $80.36 to $83.07, with a high forecast of $92.00 and a low of $67.00. Firms like Barclays, Oppenheimer, KeyCorp, Royal Bank of Canada, Morgan Stanley, Jefferies, Goldman Sachs, and Wolfe Research have reiterated or upgraded their ratings, often viewing recent stock pullbacks as buying opportunities, even amidst discussions of a potential seed spin-off. While generally positive, some analysts note "inconsistent optimism" regarding the timing or magnitude of stock movements.

    Hedge Fund Moves

    Hedge funds have shown considerable interest, with both buying and selling activity. Nuveen LLC and Norges Bank recently initiated significant new positions in Q1 and Q2, respectively. WCM Investment Management LLC and PGGM Investments also substantially increased their holdings. Conversely, hedge funds collectively reduced their holdings by 5.0 million shares in the last quarter, with firms like Harris Associates and Anomaly Capital Management decreasing their positions. Millennium Management, however, increased its stake. Hassan Ahmed Elmasry, Charles Brandes, and Theofanis Kolokotrones are among the hedge fund managers holding significant shares.

    Institutional Investors

    Institutional investors hold a substantial portion of Corteva's stock, ranging from approximately 53.93% to 87.33% of total shares outstanding, indicating strong professional interest. Key institutional shareholders include Vanguard Group Inc., BlackRock, Inc., State Street Corp, Capital World Investors, and Franklin Resources Inc. While overall fund sentiment suggests high institutional accumulation, recent "big-money" flows have been negative across all investor sizes, signaling a degree of caution ahead of earnings or macroeconomic developments.

    Retail Chatter

    Retail investors constitute a notable segment, holding approximately 21.69% to 24.24% of Corteva's stock. While retail (small) investor flows have shown positive signs, recent overall money flow trends, including from retail investors, have been negative. On platforms like Stocktwits, retail sentiment for Corteva was recently "bearish" following the announcement of the planned separation of its crop protection and seed businesses. Retail investors actively engage in discussions on various platforms to share opinions and insights on CTVA, indicating ongoing interest and debate.

    13. Regulatory, Policy, and Geopolitical Factors

    10/2/2025 – The global agricultural market, and consequently major players like Corteva, are profoundly shaped by a complex web of laws, compliance demands, government incentives, and geopolitical dynamics, presenting both significant risks and strategic opportunities.

    Global Agricultural Market: Laws, Compliance, and Government Incentives

    Laws and Compliance: International agricultural laws govern trade practices, food safety, environmental protection, and animal welfare. Organizations like the FAO and WTO provide guidance. Compliance is crucial to access global markets and avoid penalties. Examples include the EU's stringent pesticide regulations, U.S. GMO labeling laws, China's strengthened food safety rules, and Brazil's environmental regulations. International trade laws impose tariffs, quotas, and non-tariff barriers that influence competitiveness.

    Government Incentives: Governments worldwide provide substantial support to agriculture, shifting focus from developed to emerging economies like China and India. Incentives for sustainable practices, such as carbon markets, are growing. Grant programs target new farmers, sustainable agriculture, and R&D. Multilateral funds like GAFSP provide grants to low-income countries for food security investments.

    Global Agricultural Market: Geopolitical Risks and Opportunities

    Geopolitical Risks: Intensified since 2022, these include conflicts (e.g., Middle East, Russia-Ukraine war) disrupting trade and pressuring food and fertilizer prices. Protectionism, through tariffs and export bans, fragments markets. Climate change acts as a "threat multiplier," causing extreme weather events that decimate harvests and degrade soil. Weakening global economic growth, rising trade barriers, and volatile input costs also contribute to market fragility.

    Geopolitical Opportunities: Strategies focus on enhancing resilience and sustainability. Diversification of crops, production locations, and supplier networks are key. Investing in renewable energy, nutrient recycling, and sustainable agriculture techniques helps mitigate risks. Trade facilitation measures and increased international collaboration are crucial for a stable global trade environment.

    Corteva: Regulatory and Geopolitical Factors

    Laws, Compliance, and Regulatory Factors Affecting Corteva:

    • Regulatory Scrutiny: Corteva is currently under a USDA-DOJ antitrust investigation, which could impact its business practices.
    • Legal Liabilities and Environmental Compliance: The company faces ongoing liabilities related to products like chlorpyrifos and dicamba, and has paid significant fines for environmental violations, including PFAS contamination lawsuits.
    • Product Approval and Market Access: Stricter environmental regulations and trade policies can affect approvals for crop protection products and GMOs.
    • Strategic Adaptation: The planned separation of its businesses is a response to these challenges, aiming for greater agility in navigating regulatory landscapes.

    Government Incentives Affecting Corteva:

    • Direct Support and Grants: Corteva has received over $237 million in state and local subsidies and over $75 million in federal grants, including a significant Department of Energy grant for advanced biofuels.
    • Promoting Sustainable Agriculture: Corteva commits to initiatives like the "Climate Positive Challenge" and collaborates with Nori on carbon credit markets.

    Geopolitical Risks and Opportunities for Corteva:

    • Geopolitical Risks: Corteva identifies geopolitical conflict as an operational risk, making it vulnerable to input cost volatility, tariffs, and trade disruptions. Supply chain vulnerabilities are exacerbated by global events.
    • Mitigation and Opportunities: Corteva diversifies its portfolio across crops and regions. Its focus on innovation in resilient seeds, crop protection, and digital agriculture positions it to address climate change impacts. The anticipated spin-off aims to allow each segment to respond more effectively to market dynamics and pursue distinct innovation paths.

    14. Outlook and Scenarios

    10/2/2025 – Corteva, Inc. (NYSE: CTVA) is navigating a transformative period, with its planned separation into two independent, publicly traded companies by mid-2026 being the most significant strategic pivot.

    Bull Case Scenarios: The bull case for Corteva hinges on the successful execution of its operational specialization post-split. This separation into "New Corteva" (crop protection) and "SpinCo" (seeds) is expected to unlock long-term shareholder value by allowing each entity to optimize capital allocation and respond more nimbly to market dynamics. Continued innovation in its product pipeline, particularly in gene editing, hybrid wheat, and the rapidly growing biologicals segment (targeting $1 billion in annual revenues by 2030), will drive growth. Strong financial performance, supported by disciplined capital allocation and share repurchases, and its robust global market presence, especially in Asia and Latin America, further bolster the optimistic outlook.

    Bear Case Scenarios: The bear case emphasizes risks associated with the separation, including potential dis-synergies, transaction costs, and challenges in strategic execution that could weaken its competitive position against integrated rivals. A challenging agricultural macroeconomic environment, characterized by subdued farm income, weaker grain prices, and declining export demand, could negatively impact results through 2026. Supply chain disruptions, intense competitive pressures, and regulatory hurdles (such as the U.S. government antitrust investigation and environmental liabilities related to PFAS and pesticides) also pose significant risks. Furthermore, climate change presents a long-term threat to agricultural productivity, demanding continuous adaptation.

    Short-Term Versus Long-Term Projections:

    • Short-Term (2025-2026): The immediate outlook is mixed. Corteva reaffirmed its FY 2025 guidance, projecting net sales of $17.2-$17.6 billion and operating EPS of $2.70-$2.95. However, the period leading up to the mid-2026 separation is expected to introduce uncertainty due to potential dis-synergies and transaction costs. Macroeconomic headwinds, competitive pricing pressures in crop protection, and the antitrust probe also create short-term risks, potentially leading to stock price volatility. Some short-term technical indicators suggest a "Strong Sell" signal in early October 2025 due to recent price drops.
    • Long-Term (2027 and Beyond): The long-term forecast is generally bullish, assuming the strategic separation successfully unlocks value. Corteva aims for ambitious targets through 2027, including $1 billion in incremental net sales from growth platforms and $4.1-$4.4 billion in EBITDA. Innovation in seeds (Enlist, gene editing, hybrid wheat) and the expansion of biologicals will drive sustained growth. Long-term stock price predictions anticipate significant upside, with forecasts reaching $86.79 in 2027 and $101.55 in 2028, positioning Corteva to address global challenges of food security and climate change.

    Potential Strategic Pivots: The formal separation into two entities is the most significant pivot. Beyond this, Corteva may intensify its focus on biologicals and sustainable agriculture, increase investment in gene editing and hybrid wheat, and pursue more targeted strategic partnerships and acquisitions post-split. Optimizing external manufacturing partnerships for a capital-light model and potentially concentrating resources on high-growth geographic markets are also possible strategic adjustments.

    15. Conclusion

    10/2/2025 – Corteva Agriscience (NYSE: CTVA) stands at a pivotal juncture, poised to redefine its corporate structure and strategic direction. As a leading global provider of seeds and crop protection, the company plays a crucial role in addressing global food security and sustainable agriculture.

    Summary of Key Findings

    Corteva's business is robust, generating approximately $17 billion in annual net sales, primarily from its Seeds and Crop Protection segments. The most impactful development is the announced plan to separate into two independent, publicly traded companies—"New Corteva" (crop protection) and "SpinCo" (seeds)—by the second half of 2026. This move is designed to unlock shareholder value by allowing each entity to pursue specialized strategies. The company boasts a strong R&D pipeline, with significant investments in biologicals, gene editing, and hybrid wheat, aiming for substantial growth in these innovative areas. Financially, Corteva exhibits strength with solid margins, manageable debt, and consistent cash flow, supported by a history of dividend increases and share repurchases.

    Balanced Perspective

    Corteva presents a compelling, albeit complex, investment case. Its strengths lie in a strong market position, extensive R&D, and a commitment to sustainable solutions. The upcoming separation, while potentially value-accretive in the long term, introduces short-term uncertainties, including potential dis-synergies and execution risks. The company operates in a highly competitive and regulated industry, facing challenges from commodity price volatility, supply chain disruptions, and significant environmental liabilities, particularly for the crop protection segment. While analyst sentiment is largely positive, the stock's current valuation suggests it may be priced at a premium.

    What Investors Should Watch Going Forward

    Investors should closely monitor the following critical aspects:

    1. Successful Execution of the Business Split: The seamless and timely completion of the separation, including the establishment of distinct management teams and clear strategic roadmaps for both "New Corteva" and "SpinCo," will be paramount.
    2. Financial Performance of the Independent Entities: Post-split, tracking the individual financial results of the crop protection and seed businesses will be crucial to assess whether the separation truly enhances profitability, growth, and operational efficiency.
    3. R&D Innovation and Product Launches: Continued advancements in Corteva's biologicals portfolio, gene editing technologies, and successful commercialization of new products like hybrid wheat and advanced fungicides will be key growth drivers.
    4. Regulatory and Legal Developments: The outcome of the U.S. antitrust probe and any new regulations concerning crop protection products or environmental liabilities (e.g., PFAS litigation) could significantly impact operations and financial performance.
    5. Agricultural Market Dynamics: Fluctuations in global commodity prices, farmer income, and broader market trends will influence demand for Corteva's products and services.
    6. Competitive Landscape Post-Split: Observe how the two independent companies adapt their competitive strategies against integrated rivals.
    7. Shareholder Return Policies: Monitor the dividend and share repurchase policies of both new entities, as these will be important for investor returns.

    Corteva's journey ahead is one of strategic transformation, aiming to unlock greater value through specialization and innovation. While the path involves inherent risks, the potential for focused growth in critical agricultural sectors remains a compelling narrative for long-term investors.


    This content is intended for informational purposes only and is not financial advice

  • Walmart (WMT): A Retail Giant’s Strategic Evolution and Enduring Relevance

    Walmart (WMT): A Retail Giant’s Strategic Evolution and Enduring Relevance

    Walmart Inc. (NYSE: WMT) stands as a global retail behemoth, operating a vast network of hypermarkets, discount department stores, and grocery stores across 19 countries, alongside its rapidly expanding e-commerce platforms. As of fiscal year 2025, the company reported an impressive revenue of $681 billion and employs approximately 2.1 million associates worldwide, serving roughly 270 million customers and members each week. Its foundational business model, established by Sam Walton in 1962, continues to center on offering "Everyday Low Prices" (EDLP), leveraging massive economies of scale and efficient supply chain management to deliver cost savings to consumers.

    Why Walmart is in Focus

    Walmart remains a prominent focus for investors and industry observers due to its robust financial performance, aggressive digital transformation, and strategic initiatives aimed at solidifying its market leadership in an evolving retail landscape.

    1. Strong Financial Performance and E-commerce Acceleration:
    Walmart has demonstrated robust financial health, with its Q3 FY25 earnings (for the period ending October 2024) exceeding expectations. The company reported consolidated sales of $168 billion, up from $159.44 billion in the prior year, and adjusted earnings per share (EPS) of $0.58, an increase from $0.51. For Q2 FY26 (ending July 31, 2025), global revenue reached $177.4 billion, reflecting a 4.8% year-over-year growth, with strong e-commerce performance being a key driver.

    E-commerce is a critical growth engine, with global online sales surging 25% year-over-year in Q2 FY26. Specifically, U.S. e-commerce sales jumped by 26% in Q2 FY25, outpacing Amazon's retail segment growth in the same period, driven by investments in ultra-fast deliveries and AI-driven inventory management. By late 2025, Walmart aims for 95% of the U.S. population to have access to these expedited delivery services, leveraging its extensive network of over 4,600 U.S. stores as fulfillment hubs. E-commerce operations accounted for approximately 18% of Walmart's total company revenue in fiscal 2025, a significant increase from 15.4% in fiscal 2024.

    2. Strategic Investments in Technology and Store Modernization:
    Walmart is heavily investing in technology, including artificial intelligence (AI) and automation, to enhance operational capabilities and customer experience. The company signed a substantial lease in Silicon Valley in June 2025, signaling a deeper integration of e-commerce, logistics technology, and potentially AI or data analytics into its core operations. AI-driven supply chain upgrades have reportedly reduced fulfillment costs by 30%, enabling more efficient delivery services.

    Alongside digital advancements, Walmart is modernizing its physical footprint. Plans for 2025 include opening over 150 new "Store of the Future" concepts and remodeling 650 existing locations across 47 states and Puerto Rico to improve the in-store shopping experience and omnichannel capabilities.

    3. Enhanced Private Brands and Sustainability Initiatives:
    A significant announcement on October 1, 2025, highlights Walmart's commitment to consumer preferences for healthier and more transparent food options. The company declared its intention to eliminate synthetic dyes and over 30 other ingredients, including certain preservatives, artificial sweeteners, and fat substitutes, from its U.S. private brand food products (e.g., Great Value, Marketside, Freshness Guaranteed, bettergoods) by January 2027. This move is a direct response to customer demand for simpler, more familiar ingredients and reinforces Walmart's mission to provide affordable, high-quality private brand products.

    4. Employee Investment and Workforce Development:
    Walmart has expanded its employee discount program to cover 95% of regularly priced items, including groceries, for its 1.6 million U.S. employees after 90 days of employment. This initiative aims to boost retention and can generate significant internal sales. Furthermore, in collaboration with OpenAI, Walmart is launching an AI skills program in 2025 to prepare its 2.1 million global employees for technological changes in the workplace, focusing on "plussing up" existing jobs rather than replacing them.

    5. Competitive Landscape and Market Positioning:
    Walmart faces stiff competition from e-commerce giants like Amazon, warehouse clubs like Costco, and traditional retailers such as Target and Kroger. Walmart's strategies, including aggressive digital growth, same-day pickup, and a focus on rural areas, directly challenge Amazon's dominance. Its massive physical retail presence and efficient supply chain remain core competitive advantages.

    Current Relevance for a Stock Research Article (October 1, 2025)

    As of October 1, 2025, Walmart (WMT) presents a compelling case for a stock research article due to its ongoing transformation and resilient market position.

    • Recent Earnings and Outlook: The company's strong Q2 FY26 performance, marked by significant e-commerce growth and overall sales increases, positions it favorably. Walmart's Q3 FY25 also showed increased sales and net profit, beating estimates. Walmart has raised its FY25 guidance, forecasting sales growth of 4.8% to 5.1% and operating income growth of 8.5% to 9.25%.
    • Strategic Growth Levers: The aggressive expansion of e-commerce, particularly in ultra-fast delivery, combined with substantial investments in AI and automation, indicates a forward-looking strategy that could drive sustained growth and efficiency. The modernization of its store fleet further reinforces its omnichannel approach.
    • Consumer-Centric Initiatives: The move to eliminate artificial ingredients from private brands reflects a keen understanding of evolving consumer preferences, potentially strengthening brand loyalty and market share in the competitive grocery segment.
    • Dividend Reliability: Walmart has a strong track record of increasing its annual dividend, marking 52 consecutive years of dividend increases, with an annual dividend of $0.94 per share (0.91% yield) as of October 2025. The next ex-dividend date is December 12, 2025.
    • Analyst Sentiment and Valuation: Analyst sentiment generally remains positive, with many rating WMT as a "Strong Buy" or "Buy" and average 12-month price targets around $110.68 to $112.38. While the stock trades at a premium P/E ratio, its dominant market position and anticipated double-digit EPS growth are often cited as justifications. Current stock forecasts for October 2025 suggest a potential trading range between $102.01 and $110.37.

    In summary, Walmart, as of October 1, 2025, is a compelling subject for stock research. Its ongoing digital transformation, robust financial health, strategic investments in technology and workforce, and responsiveness to consumer demands position it as a resilient and adaptable leader in the global retail sector. These factors suggest continued relevance and potential for long-term investor appeal.

    2. Historical Background

    Walmart Inc. (WMT) has evolved from a single discount store in rural Arkansas into a global retail behemoth, driven by its founder's vision of "everyday low prices" and a relentless pursuit of efficiency and innovation. This research article, dated October 1, 2025, details Walmart's founding story, early milestones, and key transformations that have shaped its trajectory as a prominent stock in the retail sector.

    Founding Story: Sam Walton's Vision

    Walmart's origins trace back to the entrepreneurial spirit of Sam Walton, who gained early retail experience working for J.C. Penney after graduating college and later operating a Ben Franklin variety store franchise in Newport, Arkansas, starting in 1945. In 1950, Walton relocated to Bentonville, Arkansas, opening "Walton's 5&10".

    Inspired by the success of his dime store and his belief that customers would travel for significant savings, Sam Walton opened the first Walmart Discount City on July 2, 1962, in Rogers, Arkansas. Walton's innovative strategy was built on providing a wide range of goods at the lowest possible prices, focusing on high sales volume and lower profit margins. He initially targeted rural towns, strategically avoiding direct competition with larger retailers like Sears and Kmart, which were focused on urban and suburban areas.

    Early Milestones: Laying the Foundation for Growth

    The 1960s and 1970s marked a period of rapid expansion and foundational developments for Walmart:

    • Incorporation (1969): The company officially incorporated as Wal-Mart Stores, Inc. in 1969. By 1967, the Walton family owned 24 stores with $12.7 million in sales.
    • Public Offering (1970): Walmart became a publicly traded company in 1970, with its first stock sold at $16.50 per share. Shares began trading on the New York Stock Exchange (WMT) in 1972.
    • Distribution Centers: In 1970-1971, Walmart opened its first distribution center and home office in Bentonville, Arkansas, a crucial step in building its legendary supply chain efficiency.
    • Rapid Expansion: The company quickly expanded across the Southern United States. By 1980, Walmart had reached $1 billion in annual sales, achieving this milestone faster than any other company at that time.
    • Technological Adoption: Walmart was an early adopter of technology, leasing an IBM computer system in 1975 to manage inventory across warehouses and distribution centers, a revolutionary move for retailers at the time. By 1988, 90% of its stores were equipped with barcode readers.
    • New Store Formats: The 1980s saw the introduction of new store concepts, including the first Sam's Club, a members-only warehouse store, in Midwest City, Oklahoma, in 1983. The first Walmart Supercenter, combining a supermarket with general merchandise, opened in Washington, Missouri, in 1988.

    Key Transformations Over Time

    Walmart's journey from a regional discount chain to a global retail powerhouse involved several significant transformations:

    • International Expansion (1990s onward): Recognizing limitations for growth solely within the U.S., Walmart began its international expansion in 1991 with a joint venture with Cifra, a Mexican retail company, opening a Sam's Club in Mexico City. This was followed by expansion into Canada in 1994, South America (Argentina and Brazil) in 1995, China in 1996, the United Kingdom (through the acquisition of Asda) in 1999, and Japan (through Seiyu Group) in 2002. By the mid-1990s, Walmart was operating in all 50 U.S. states.

    • E-commerce and Digital Transformation (2000s onward):

      • Early Online Presence: Walmart launched Walmart.com in 2000, offering online shopping to U.S. customers.
      • Strategic Acquisitions: To accelerate its digital presence and compete with Amazon, Walmart made significant e-commerce acquisitions, notably Jet.com in 2016 for $3.3 billion. Other acquisitions included Moosejaw, Modcloth, and Flipkart (India's largest online retailer).
      • Omnichannel Integration: Walmart has heavily invested in integrating its online and offline experiences, expanding grocery pickup and delivery services nationwide. Its e-commerce sales have seen substantial growth, particularly boosted by the COVID-19 pandemic, with digital sales in the U.S. growing over fivefold from $13.8 billion in 2017 to $73 billion in 2023.
      • Advanced Technologies: The company is undergoing a digital reinvention, implementing AI, machine learning, and data analytics to optimize its supply chain, enhance customer experience, and streamline internal operations. This includes autonomous vehicles and drones for delivery, and automated micro-fulfillment centers.
      • Membership Programs: In 2020-2021, Walmart launched Walmart+, a membership program offering benefits like free delivery and fuel discounts, mirroring Amazon's Prime strategy.
    • Supply Chain and Operational Excellence: Walmart's supply chain is legendary and a core competitive advantage.

      • Early Innovations: Beyond its initial distribution centers and computer systems, Walmart pioneered concepts like continuous replenishment (CR) and Collaborative Planning, Forecasting, and Replenishment (CPFR) with suppliers.
      • Retail Link: In 1992, Walmart deployed its powerful Retail Link system, which provided vendors with real-time information on sales trends and inventory levels, fostering deep integration and efficiency throughout the supply chain.
      • Cross-Docking: The company mastered cross-docking, a logistics strategy that transfers goods directly from suppliers to outbound carriers with minimal storage, significantly reducing warehousing costs and accelerating replenishment.
      • Modernization: Walmart continues to invest in state-of-the-art technology, including RFID and automated storage and retrieval systems in its distribution centers, to enhance speed, capacity, and efficiency, particularly in its massive grocery network.
    • Market Leadership and Corporate Identity:

      • Top Retailer: By 1990, Walmart had become the number one retailer in the United States. In 2002, it reached the number one spot in the Fortune 500 list.
      • Branding Evolution: The company's logo has evolved over time, with the most notable change in 2008 when it dropped the hyphen from "Wal-Mart" and introduced "The Spark" symbol, representing innovation and customer satisfaction. A further redesign in 2025 aimed for a more streamlined, digital-friendly font to align with its e-commerce focus.

    Walmart's sustained growth and market dominance are a testament to its foundational principles of value and efficiency, combined with its ability to adapt and transform through technological innovation, strategic expansion into new markets and formats, and a keen focus on optimizing its robust supply chain. For a stock research article dated 10/1/2025, it's clear that Walmart's continued investments in e-commerce, digital tools, and supply chain modernization are critical drivers for its future performance.

    3. Business Model

    Walmart Inc. (WMT) operates as a multinational retail corporation with a robust and diversified business model focused on providing a wide range of products and services at "Everyday Low Prices" (EDLP). As of October 1, 2025, its strategy emphasizes an omnichannel approach, integrating its extensive physical store network with a growing e-commerce presence to cater to a broad customer base.

    Operating Segments

    Walmart’s operations are structured into three primary reportable segments:

    1. Walmart U.S.: This is the largest segment, encompassing various store formats such as Walmart Discount Stores, Supercenters, and Neighborhood Markets, along with walmart.com. It historically contributes the highest amount to the company's net sales and operating income. In fiscal year 2025, Walmart U.S. generated $462.42 billion in revenue, representing approximately 68.55% of the company's total revenue.
    2. Walmart International: This segment includes operations of wholly-owned subsidiaries and majority-owned businesses in various countries like Canada, Chile, China, Africa, Mexico, and Central America. It features diverse retail formats adapted to local markets, including discount stores, supercenters, supermarkets, and Sam's Clubs internationally. Walmart International contributed $121.89 billion in revenue in fiscal year 2025, or about 18.07% of total revenue.
    3. Sam's Club: This segment operates membership-only warehouse clubs in the U.S. and samsclub.com. It focuses on bulk sales and offers additional benefits to its members. Sam's Club generated $90.24 billion in revenue in fiscal year 2025, accounting for approximately 13.38% of Walmart's total revenue.

    Revenue Sources

    Walmart's diversified revenue model is built on high-volume, low-margin retailing and includes several key streams:

    • Retail Product Sales: This remains the core revenue driver, encompassing sales from a vast array of goods across its physical stores and e-commerce platforms.
    • E-commerce Sales: Significant investments in its online platform (Walmart.com) and digital capabilities, including services like in-store pickup, curbside pickup, and local delivery, generate billions in online sales. U.S. e-commerce saw a 20% increase in Q4 FY2025, with global growth at 16%.
    • Membership Programs: Subscription services like Walmart+ (offering free delivery, fuel discounts, and other perks) and Sam's Club memberships contribute to recurring revenue.
    • Advertising Revenue (Walmart Connect): The company leverages its extensive customer data and traffic to offer an advertising platform for brands to run targeted campaigns across its website, app, and in-store screens.
    • Financial and Other Services: Walmart earns fees and interest from various financial services, fulfillment/logistics services for third-party sellers, and other offerings.

    For fiscal year 2025, Walmart reported total revenue of $680.99 billion, a 5.07% increase from fiscal year 2024's $648.13 billion. The company's gross profit margin improved slightly to 24.85% in FY2025 from 24.38% in FY2024, with net income reaching $19.44 billion, a 25.3% increase year-over-year.

    Product Lines

    Walmart offers an extensive range of merchandise, encompassing nearly every consumer need. Key product categories include:

    • Groceries: This is Walmart's largest product category and a primary driver of sales, including fresh produce, meat, dairy, pantry staples, and frozen foods.
    • Health and Beauty: Personal care products, cosmetics, fragrances, hygiene items, over-the-counter medications, and pharmacy items.
    • Household Essentials: Cleaning supplies, paper goods, laundry detergent, and other daily necessities.
    • Electronics: Televisions, streaming devices, computers, cell phones, gaming consoles, and accessories.
    • Apparel: Clothing, shoes, and accessories for men, women, and children, including private label brands like George, EV1, No Boundaries (NOBO), and Joyspun.
    • Home Goods: Furniture, bedding, kitchenware, home décor, and small appliances.
    • Toys: A wide selection, particularly strong during holiday seasons.
    • Sporting Goods: Equipment and apparel for various sports and outdoor activities.
    • Automotive: Car care products, tires, and accessories.
    • Private Label Brands: Walmart significantly utilizes its own private label brands, which offer cost-effective alternatives to national brands and contribute to higher profit margins. Notable brands include Great Value (groceries, household essentials), Equate (health and beauty), Mainstays (home products), and Sam's Choice (premium food and selected hard goods).

    Services

    Beyond product sales, Walmart provides a comprehensive suite of services, enhancing convenience and creating additional revenue streams:

    • Financial Services: Walmart MoneyCenter offers money transfers, check cashing, bill payments, money orders, tax preparation services (in partnership with Jackson Hewitt), reloadable debit cards, and a new credit card program launched in June 2025.
    • Pharmacy & Health Services: Prescription refills, medication management, immunizations, pet pharmacy, vision centers (prescription eyeglasses and contact lenses), and Walmart Health centers offering medical, dental, and behavioral health services.
    • Auto Care Centers: Services such as oil changes and tire services are available at many Supercenter locations.
    • Protection, Home & Tech Services: Walmart Protection Plans, AppleCare, assembly, home improvement, and installation services.
    • Photo Services: Photo printing and custom photo gifts.
    • Custom Cakes: In-store bakery services for special occasions.
    • Online and Omnichannel Services: Grocery pickup and delivery, in-store pickup, and mobile payment solutions like Walmart Pay.

    Customer Base

    Walmart's business model primarily targets price-sensitive consumers and middle-income families, emphasizing affordability and value.

    • Demographics: The typical U.S. Walmart shopper is often described as a suburban woman, married, with a household income between $40,000 and $80,000, and an average age between 60 and 78 years old. While this represents a significant portion, Walmart aims for a broad demographic across all ages and genders.
    • Geographic Reach: Walmart maintains a strong presence in suburban and rural areas across the United States, where it often serves as a primary shopping destination. Its extensive online platform also caters to urban customers, expanding its accessibility.
    • Shopping Habits: Millions of shoppers visit Walmart weekly, with 95% of American consumers visiting at least twice a year. An average shopper makes 67 annual trips, spending around $54 on 13 products per trip. Groceries are the main sales category.
    • Evolving Customer: Walmart is increasingly appealing to younger demographics, including Gen Z, who appreciate its value proposition and convenience, particularly for online shopping and grocery pickup/delivery.

    4. Stock Performance Overview

    Walmart (WMT) Stock Performance Analysis (October 1, 2025)

    Overview:
    As of October 1, 2025, Walmart (WMT) continues to demonstrate robust stock performance, reflecting its resilience as a global retail powerhouse and successful adaptation to evolving consumer trends. The company's strategic focus on its omnichannel approach, including aggressive expansion in e-commerce, curbside pickup, and delivery services, has been pivotal in driving growth over the past decade. Walmart's unrivaled scale, expansive physical footprint, and commitment to low prices have solidified its market position.

    The latest closing stock price for Walmart as of September 30, 2025, was $103.06.

    1-Year Stock Performance (October 1, 2024 – October 1, 2025)

    Walmart has experienced a strong performance in the most recent year. The total return for WMT stock over the past 12 months (Trailing Twelve Months, or TTM), including reinvested dividends, stands at 28.87%, with another source reporting 30.34%. The price appreciation alone for this period was approximately 25.30%.

    Around October 1, 2024, the stock price was approximately $80.75. By September 30, 2025, it had reached $103.06.

    Notable Moves and Trends (1-Year):
    The 2024 calendar year was particularly strong, with WMT stock soaring an impressive 76.4% year-to-date as of December 26, 2024, significantly outpacing broader market benchmarks. This strong rally was attributed to robust operational performance, strategic initiatives, and resilience in a challenging economic environment. Key drivers included the company's continued emphasis on its omnichannel strategy, seamlessly blending digital shopping with physical stores, and innovations like Sam's Club's "Just Go" checkout. Walmart also revised its fiscal 2025 guidance upward, signaling confidence in its ongoing momentum. The stock reached an all-time high closing price of $104.27 on September 17, 2025, with a 52-week high of $106.11.

    5-Year Stock Performance (October 1, 2020 – October 1, 2025)

    Over the past five years, Walmart's stock has delivered substantial returns. The total return for WMT stock, including reinvested dividends, is reported as 136.90%, with another source indicating 141.73%. This translates to an average annual return (CAGR) of 19.30% for this period.

    Around October 1, 2020, Walmart's adjusted stock price was approximately $43.50. By September 30, 2025, the price had risen to $103.06.

    Notable Moves and Trends (5-Year):
    This period saw a significant upward trend in Walmart's share price, more than doubling from 2020 to 2025. The company's focus on expanding its e-commerce capabilities and enhancing customer experiences proved highly effective, particularly as consumer behaviors shifted during and after the global pandemic. Walmart's Earnings Per Share (EPS) recovered significantly post-2019, reaching $2.42 by 2025, indicating improved earnings performance. The company demonstrated strong top and bottom-line growth, outperforming the broader market during this period.

    10-Year Stock Performance (October 1, 2015 – October 1, 2025)

    Walmart has provided exceptional long-term value to shareholders over the last decade. The 10-year total return for WMT stock, with dividends reinvested, is an impressive 486.90%. The average annual return (CAGR) over this decade has been 19.28%.

    In October 2015, the adjusted closing price for WMT was around $15.80. By September 30, 2025, this had climbed to $103.06.

    Notable Moves and Trends (10-Year):
    Over the last ten years, Walmart's stock has shown a consistent upward trend, reflecting growing investor confidence and market valuation. The company navigated significant shifts in the retail landscape, including the rise of e-commerce and intense competition, by investing heavily in its digital infrastructure and supply chain. Walmart has maintained its status as a dividend-paying stock, with a history of growing dividends for 51 consecutive years.

    While the Price-to-Earnings (P/E) ratio experienced some variability, peaking around 41.79 in 2019 (a period that coincided with lower EPS), it has since fluctuated, suggesting optimistic forward-looking market expectations. Walmart's CEO has also highlighted the significant role of AI in transforming "literally every job" within the company, indicating a forward-looking approach to technological integration for continued efficiency and growth.

    Conclusion

    Walmart (WMT) has delivered strong and consistent stock performance across the 1-year, 5-year, and 10-year horizons leading up to October 1, 2025. The company's strategic investments in its omnichannel model, e-commerce capabilities, and operational efficiencies have been critical to its success. Its ability to adapt to changing market conditions and maintain its dominant position in the retail sector, coupled with consistent dividend payments, makes WMT a notable performer for long-term investors.

    5. Financial Performance

    Walmart (WMT) has demonstrated continued financial growth and strategic expansion as of October 1, 2025, with its most recent earnings reports highlighting robust revenue and strong e-commerce performance.

    Latest Earnings (Q2 Fiscal Year 2026, ending July 31, 2025):

    Walmart reported its Second Quarter Fiscal Year 2026 earnings on August 21, 2025.

    • Adjusted Earnings Per Share (EPS): Walmart reported an adjusted EPS of $0.68, which fell slightly below analysts' consensus estimates of $0.73.
    • Revenue: Quarterly revenue increased by 4.8% year-over-year to $169.34 billion, missing the consensus estimate of $174.02 billion. However, another source indicated revenue grew nearly 5% year-over-year to $177.40 billion, exceeding the $175.97 billion consensus.
    • Comparable Sales Growth: U.S. comparable sales growth was 4.3%, surpassing the 4.1% projection.
    • E-commerce Growth: Global e-commerce sales surged by 25%, driven by store-fulfilled pickup and delivery, and marketplace operations. Walmart U.S. and Sam's Club U.S. led with 26% growth.
    • Operating Income: Consolidated operating income fell more than 8%, impacted by discrete legal and restructuring items, as well as rising tariff-impacted costs.

    For the First Quarter Fiscal Year 2026 (ending April 30, 2025), Walmart reported:

    • Revenue: $165.6 billion, marking a 2.5% increase (4.0% in constant currency).
    • Adjusted EPS: $0.61.
    • E-commerce and Advertising: Global e-commerce sales grew by 22%, and the global advertising business saw a 50% increase, with Walmart Connect in the U.S. up 31%. Membership income also grew by 14.8%.

    Walmart's next earnings report, for the fiscal quarter ending October 2025 (Q3 FY26), is anticipated on November 20, 2025.

    Revenue Growth:

    Walmart has consistently demonstrated revenue growth.

    • Latest Twelve Months (ending July 31, 2025): Total revenue was $693.153 billion, reflecting a 4.23% increase year-over-year.
    • Fiscal Year 2025 (ended January 31, 2025): Annual revenue reached $680.985 billion, a 5.07% increase from fiscal year 2024.
    • Fiscal Year 2024 (ended January 31, 2024): Annual revenue was $648.125 billion, a 6.03% increase from fiscal year 2023.
    • Five-Year Trend: Over the past five years, Walmart's revenues have grown at an average annual rate of 5.2%.

    Margins:

    Walmart's profitability margins show varying trends across different periods:

    • Net Profit Margin: For the quarter ending July 31, 2025, the net profit margin was 3.96%. For the fiscal year ending January 31, 2025, the net profit margin was 2.9%.
    • Gross Profit Margin: The gross profit margin for the fiscal year ending January 2025 was 24.85%. The latest twelve-month gross profit margin is 24.9%. In Q1 FY26, the gross margin rate increased by 12 basis points. In Q2 FY26, the consolidated gross margin increased four basis points on a reported basis and nine basis points on an adjusted basis.
    • EBITDA Margin: For the most recent fiscal year (FY25), the EBITDA margin was 6.2%.

    Debt:

    Walmart maintains a significant, but generally managed, debt profile.

    • Total Debt (as of July 31, 2025): Walmart's total debt was reported as $50.263 billion. Another source stated total debt on the balance sheet as of July 2025 at $65.01 billion.
    • Long-Term Debt (as of July 31, 2025): Long-term debt stood at $41.587 billion.
    • Recent Debt Activity: In the first quarter of fiscal year 2026, the company raised $4 billion in long-term debt for general corporate purposes. As of July 2024, Walmart's net debt was approximately $33.1 billion after accounting for cash reserves.

    Cash Flow:

    Walmart generates substantial cash flow from its operations.

    • Operating Cash Flow (Quarter ending July 31, 2025): Cash flow from operating activities for the quarter was $18.352 billion, representing a 12.2% increase year-over-year.
    • Operating Cash Flow (Twelve months ending July 31, 2025): This figure was $83.124 billion, a 10.32% increase year-over-year.
    • Annual Operating Cash Flow (Fiscal Year 2025): For the fiscal year ending January 31, 2025, annual operating cash flow was $36.443 billion, a 2.01% increase from 2024.
    • Free Cash Flow (Fiscal Year 2025): Annual free cash flow for fiscal year 2025 was $13.092 billion, which was a 14.82% decline from 2024.

    Key Valuation Metrics (as of late September 2025):

    • Market Capitalization: Walmart's market cap was $822 billion.
    • Enterprise Value (EV): The enterprise value was $878 billion.
    • Price-to-Earnings (P/E) Ratio: The P/E ratio was 39.4x. The trailing P/E ratio was 38.75, and the forward P/E ratio was 40.42.
    • EV/EBITDA Ratio: The EV/EBITDA ratio was 20.0x. The trailing twelve-month (TTM) EV/EBITDA as of July 2025 was 19.76.

    6. Leadership and Management

    As of October 1, 2025, Walmart (WMT) is led by a comprehensive executive team and a diverse Board of Directors, driving strategic initiatives focused on omnichannel retail, technological innovation, and sustainability, while navigating ongoing scrutiny of its governance practices.

    Walmart's CEO

    Doug McMillon serves as the President and Chief Executive Officer (CEO) of Walmart Inc.. He assumed this role in February 2014 and also holds a position on the company's Board of Directors. McMillon began his career with Walmart in 1984 as an hourly associate and has held various senior leadership positions across all business segments, including President and CEO of Walmart International and Sam's Club. Under his leadership, Walmart has heavily invested in its associates, increasing wages, expanding parental leave, and offering education opportunities. He is a proponent of leveraging technology, particularly AI, stating that it will "literally change every job".

    Leadership Team (Executive Council)

    Walmart's Executive Council and broader leadership team are responsible for the company's global operations and strategic direction. Key members as of October 1, 2025, include:

    • Doug McMillon: President and CEO, Walmart Inc.
    • John David Rainey: Executive Vice President and Chief Financial Officer
    • Suresh Kumar: Executive Vice President, Global Chief Technology Officer and Chief Development Officer
    • Rachel Brand: Executive Vice President of Global Governance, Chief Legal Officer and Corporate Secretary
    • Donna Morris: Executive Vice President and Chief People Officer
    • Dan Bartlett: Executive Vice President, Corporate Affairs
    • John Furner: President and CEO, Walmart U.S.
    • Kathryn McLay: President and CEO, Walmart International
    • Chris Nicholas: President and CEO, Sam's Club U.S.
    • Daniel Danker: Executive Vice President, AI Acceleration, Product and Design
    • Kathleen McLaughlin: Executive Vice President and Chief Sustainability Officer

    Recent leadership changes, effective February 1, 2025, to prepare for fiscal year 2026, include:

    • Lance de la Rosa: Moved from COO at Sam's Club to Executive Vice President of New Initiatives and Omni Fulfillment at Walmart U.S.
    • Dave Guggina: Became Executive Vice President and Chief e-commerce Officer for Walmart U.S.
    • Rob Montgomery: Promoted to Executive Vice President of Supply Chain for Walmart U.S.
    • Megan Crozier: Returned to Walmart U.S. as Executive Vice President of General Merchandise
    • Tom Ward: Moved from EVP and Chief eCommerce Officer for Walmart U.S. to Executive Vice President and Chief Operating Officer, End to End, at Sam's Club
    • Julie Barber: Became Chief Merchandising Officer at Sam's Club
    • Diana Marshall: Assumed the newly created position of Chief Experience Officer at Sam's Club
    • Venessa Yates: Appointed CEO of Walmart Canada

    Board of Directors

    Walmart's Board of Directors is composed of individuals with diverse backgrounds and extensive experience. As of October 1, 2025, the Board includes:

    • Gregory B. Penner: Chairman
    • Randall Stephenson: Lead Independent Director (effective June 5, 2025, succeeding Tom Horton)
    • Doug McMillon: President and CEO, Walmart Inc.
    • Cesar Conde: Chairman of NBCUniversal News Group
    • Timothy P. Flynn:
    • Sarah Friar: Chief Financial Officer of OpenAI
    • Carla A. Harris:
    • Tom Horton: Partner, Global Infrastructure Partners, and Retired Chairman and CEO of American Airlines
    • Marissa A. Mayer: Co-founder and CEO of Sunshine Products, Inc. (formerly Lumi Labs, Inc.), and Former President and CEO of Yahoo!, Inc.
    • Bob Moritz: Former Global Chair of PricewaterhouseCoopers (appointed August 15, 2024)
    • Brian Niccol: Chairman and Chief Executive Officer, Starbucks Corporation
    • Steuart Walton: Founder and Chairman, RZC Investments, LLC

    The Board is focused on effective oversight of strategy, risk management, and corporate governance, emphasizing the importance of a diverse range of skills and experiences.

    Strategic Initiatives (as of 2025)

    Walmart's strategic initiatives for 2025 and beyond are centered on driving growth and shareholder value through a "people-led, tech-powered omnichannel" approach. Key areas of focus include:

    1. Omnichannel Strategy: Walmart is committed to providing a seamless shopping experience across in-store, online, pickup, and delivery channels. The company aims to deliver to 95% of U.S. households in under three hours by later this year.
    2. Technology and AI Investment: Significant investments are being made in e-commerce infrastructure, modern retail technology, and artificial intelligence (AI). AI is expected to reshape virtually every job, and Walmart is partnering with OpenAI to upskill its workforce. AI-powered tools are being implemented to improve inventory management, associate productivity, and customer experiences.
    3. Store Expansion and Modernization: Walmart plans to open over 150 new "Store of the Future" concept locations and remodel 650 existing stores across 47 states and Puerto Rico by 2029. Sam's Club also intends to double its membership over the next 8-10 years and remodel all 600 clubs, accelerating new club growth with a pipeline of 15 new clubs annually.
    4. Supply Chain Transformation: The company is transforming its supply chain into an omnichannel network, integrating stores, fulfillment centers, distribution centers, pickup, and delivery using data, intelligent software, and automation. This aims to improve inventory management, enable faster fulfillment, and reduce costs. More than 50% of its e-commerce fulfillment center volume is now processed through next-generation centers.
    5. Business Mix Accelerators: Walmart is investing in key business accelerators such as Walmart+, Walmart Connect (advertising), Data Ventures, and Fintech to drive growth, bolster profitability, and generate incremental margins. Global advertising revenue grew to $4.4 billion, supported by the acquisition of VIZIO in December 2024.
    6. Investment in Associates: Walmart continues to invest heavily in its 2.1 million global associates through competitive wages, benefits, and education programs, including debt-free college and expanded parental leave. Average store manager earnings were $249,000 in 2024, with top performers earning over $500,000.
    7. Sustainability: A long-term goal is to become a regenerative company, increasing environmental sustainability and eliminating waste. Initiatives like "Project Gigaton" aim to reduce 1 billion metric tons of emissions by 2030. New and remodeled stores incorporate energy-efficient equipment, lighting, and lower-impact refrigerants.

    Governance Reputation

    Walmart emphasizes a commitment to strong governance practices, transparency, and accountability. The company's corporate governance framework is built on having an independent board with diverse backgrounds and relevant skills to oversee strategy, risks, and opportunities. Walmart actively engages with shareholders on topics including governance, compensation, sustainability, and human capital management.

    However, challenges and areas for improvement have been noted. As of 2022, Walmart had an 18% diversity rate and 27% female representation on committees, indicating cultural diversity issues. The average tenure of board members (6-12 years) has also been cited as contributing to lower turnover, which could impede demographic optimization and skill diversity. The Walton family's control of over 50% of shares and their historical representation of three members on the board has led to perceptions of a traditional, autocratic leadership style.

    In terms of Environmental, Social, and Governance (ESG) ratings, Walmart receives varied assessments. The Upright Project gives Walmart a net impact ratio of -11.4%, noting positive value in taxes, jobs, and nutrition, but negative impacts related to GHG emissions, physical diseases, and waste. MSCI ESG Research provides a BBB rating, focusing on the company's resilience to financially material ESG risks. Walmart is recognized for its efforts to improve supply chain transparency, reduce plastic waste, and offer sustainable products, with commitments to carbon neutrality and renewable energy adoption. The company has also faced scrutiny regarding alleged issues such as employee monitoring, unrealistic work expectations, and concerns about worker well-being and supply chain practices.

    7. Products, Services, and Innovations

    Walmart (WMT) is actively advancing its offerings and innovation pipeline as of October 1, 2025, focusing on a "people-led, tech-powered" omnichannel strategy to enhance customer experience, streamline operations, and secure a competitive advantage. The company's efforts span from expanding healthcare services to deeply embedding artificial intelligence (AI) across its supply chain and customer interactions.

    Current Products and Services Offered by Walmart

    Walmart continues to operate its extensive retail formats, including Supercenters, Walmart Neighborhood Markets, and the membership-based Sam's Club, offering a wide range of merchandise. Beyond traditional retail, its current services portfolio includes:

    • Omnichannel Retail and E-commerce: Walmart maintains robust e-commerce platforms globally, such as walmart.com, walmart.com.mx, walmart.ca, flipkart.com, and PhonePe. The company emphasizes seamless integration between its physical and digital channels, with services like curbside pickup, and aims to offer same-day delivery to 95% of U.S. households in under three hours by the end of 2025. Walmart Fulfillment Services (WFS) also supports third-party sellers with logistics.
    • Healthcare Services: Walmart Health is a significant growth area, with plans to operate over 75 health centers by early 2025. These centers provide comprehensive primary care, virtual health, dental care, behavioral health, lab tests, X-rays, and audiology services. Walmart's pharmacies have expanded their offerings, with over 2,700 remodeled locations featuring Health Services Rooms. A notable innovation is the home delivery of chilled and reconstituted prescription medications, including insulin and GLP-1s, with a centralized prescription processing network expanding to cover nearly 90% of its pharmacies by the end of 2026.
    • Membership Programs: Walmart+ continues to grow, providing benefits like free shipping, free food and pharmacy delivery, streaming, and gas discounts.
    • Advertising (Walmart Connect): Walmart Connect, the company's retail media platform, is a crucial profit driver. Its global advertising business saw a 46% year-over-year increase in Q2 FY26, partly driven by the acquisition of connected TV maker Vizio in December 2024.
    • Private Brands: Walmart is heavily invested in its owned brands, including the recently launched "bettergoods" food brand. The company announced in October 2025 that it would remove synthetic dyes and nearly 30 other additives from its U.S. store-brand food products, such as Great Value and Freshness Guaranteed, by January 2027, responding to consumer demand for "cleaner" ingredients.
    • Financial Technology (Fintech) and Data Ventures: These are identified as key business accelerators, contributing to profitability and incremental margins.

    Innovation Pipelines and R&D Efforts

    Walmart's innovation strategy is deeply rooted in technology, particularly AI and automation, with a continuous focus on improving both customer and associate experiences.

    • AI Integration Across Operations: AI is pervasive throughout Walmart's business, influencing shopper applications, administrative tasks, supplier interactions, and in-store operations. The company is rapidly integrating "agentic AI" capabilities to boost productivity, efficiency, and personalized customer experiences. Examples include generative AI-powered shopping assistants and tools that automate day-to-day tasks for in-store associates, freeing them for more complex work.
    • Supply Chain Transformation: Walmart is reengineering its global supply chain with real-time AI and automation to achieve faster and smarter operations. This involves predictive AI for sorting produce and optimizing delivery routes to reduce waste. Innovations like "self-healing inventory" systems, which automatically reroute supplies, have yielded significant cost savings. The company is also implementing sustainable supply chain initiatives, including energy-efficient transportation and blockchain for food traceability.
    • Last-Mile Delivery Innovation: Advancements in last-mile delivery include sophisticated tracking systems, real-time data analytics, and AI-driven routing algorithms to ensure faster, more accurate, and environmentally sustainable logistics.
    • Strategic Partnerships for R&D: Walmart actively collaborates with startups, particularly in India, to foster innovation in supply chain protection and sustainability. Pilot programs are testing solutions such as natural textile dyes made from agricultural waste and plant-extract sachets to extend the freshness of produce, with a focus on increasing product availability, reducing waste, and developing sustainable alternatives.
    • Workforce Development: In partnership with OpenAI, Walmart is launching an AI skills program in 2025 to equip its 2.1 million employees with necessary digital literacy and AI-powered tool proficiency, aiming to enhance existing jobs rather than replace them.
    • In-Store Technology: Rollouts include digital price tags in collaboration with VusionGroup and the "Sidekick AI tool" to assist associates with real-time inventory management.

    Patents

    Walmart demonstrates a strong commitment to protecting its innovations through patents. As of Q2 2024, the company held 7746 patents globally, with 48 specifically in artificial intelligence, and over 93% of its patents remain active. The United States is Walmart's primary hub for R&D and patent activity.

    Recent patent filings (Q2 2024 to Q3 2025) highlight:

    • AI for Personalization: Methods and systems for personalized search recommendations based on user images and features.
    • Data Analytics and AI Training: Systems for detecting and correcting label noise in historical data for machine learning training, and for automatically generating and presenting insight data in natural language.
    • Computer Vision: Technologies for computer-vision-based product detection and identification, and automated person detection in retail environments.
    • Retail Operations: Patents granted in September 2025 include systems for updating electronic shelf label displays and error correction using RFID signals. A patent application filed in July 2025 pertains to a user interface for displaying search results grouped by virtual categories.

    Competitive Edge

    Walmart's competitive edge in offerings and innovation is built upon a multi-faceted approach:

    • Unrivaled Scale and Omnichannel Prowess: By leveraging its vast physical footprint (over 10,750 stores) as distribution and fulfillment centers, coupled with a robust e-commerce platform, Walmart offers unparalleled convenience and speed in delivery and pickup, surpassing many competitors.
    • AI-Driven Efficiency and Cost Leadership: Significant investments in AI and automation across its supply chain, inventory management, and pricing strategies (e.g., "self-healing inventory" and dynamic pricing) lead to lower operational costs, improved product availability, and the ability to sustain its "everyday low prices" value proposition.
    • Diversified Profit Streams: The growth of higher-margin businesses like Walmart Connect, Walmart Health, Walmart+, Fintech, and Data Ventures allows Walmart to reshape its profit mix, outpace sales growth in operating profits, and fund further investments in technology and associate benefits.
    • Customer-Centric Innovation: Walmart's focus on utilizing AI to personalize shopping experiences (e.g., shopping assistants, personalized search), enhance convenience, and provide affordable healthcare services directly addresses evolving consumer needs.
    • Strategic Workforce Development: The collaboration with OpenAI for AI skills training ensures that its large workforce remains adaptable and proficient with new technologies, enhancing productivity and service quality.
    • Commitment to Quality and Sustainability: The move to eliminate synthetic additives from private-label food products aligns with consumer preferences for healthier and more sustainable options, further strengthening brand loyalty.

    In essence, Walmart's competitive edge as of October 1, 2025, lies in its strategic combination of massive retail scale, aggressive technological innovation (especially in AI and automation), and a diversified business model that prioritizes efficiency, customer value, and a continuously evolving service ecosystem.

    8. Competitive Landscape

    Walmart Inc. (WMT) operates within a highly competitive global retail landscape, as of October 1, 2025, characterized by diverse rivals, intense price competition, and an ongoing shift towards omnichannel retail. The company leverages its significant scale and strategic initiatives to maintain its dominant position, while actively addressing areas for improvement, particularly in e-commerce.

    Industry Rivals

    Walmart faces a broad array of competitors across its various retail segments:

    • E-commerce Giants: Amazon is Walmart's most significant rival, especially in the online retail space. Other online competitors include Alibaba (primarily in Asia), eBay, and smaller niche players.
    • General Merchandise & Discount Retailers: Target is a key competitor, particularly in general merchandise, apparel, and home goods, known for its curated offerings and private labels.
    • Warehouse Clubs: Costco is a major rival in the membership-based warehouse club segment, competing with Walmart's Sam's Club, focusing on bulk sales and competitive pricing.
    • Grocery Chains: Kroger is the largest traditional grocery retailer in the U.S., directly competing with Walmart's dominant grocery business. Aldi and Lidl also pose a threat as discount supermarket chains.
    • Specialty Retailers: Companies like Home Depot and Lowe's compete in the home improvement sector, while Best Buy rivals Walmart in electronics.

    Market Share

    Walmart holds a substantial market share in various retail categories as of 2025, though its online presence, while growing, still trails Amazon:

    • Overall Retail: Walmart is recognized as the world's largest retailer by revenue. While specific overall retail market share data for 2025 across all segments is not explicitly provided, its global presence spans over 10,500 locations in 19 countries.
    • U.S. E-commerce: Amazon remains the undisputed leader in U.S. e-commerce, projected to account for 40.9% of total U.S. retail e-commerce sales by 2025. Walmart has significantly narrowed the gap, rapidly closing in as the second-largest online retailer, sitting at approximately 8-9% of the U.S. e-commerce market in early 2025. In 2024, Walmart's e-commerce market share was 6.4%.
    • U.S. Grocery: Walmart maintains a dominant position in the U.S. grocery sector, commanding over one-fifth (more than 20%) of total food spending nationwide. In online grocery, Walmart held approximately 31.6% of the U.S. market share in 2025, compared to Amazon's 22.6%.
    • Sam's Club (Warehouse Club): Walmart's Sam's Club competes directly with Costco in the membership warehouse model.

    Competitive Strengths

    Walmart's competitive strengths are deeply rooted in its operational excellence and strategic positioning:

    • Brand Recognition: Walmart is one of the most recognized retail brands globally.
    • Cost Leadership & "Everyday Low Prices": The company's foundational strategy of "Everyday Low Prices" allows it to offer competitive pricing, attracting price-sensitive consumers and driving sales volume. This strategy often results in thin profit margins but gives it significant market power.
    • Massive Scale and Global Footprint: With over 10,500 stores in 19 countries and 2.1 million employees worldwide, Walmart's scale provides immense purchasing power over suppliers and operational efficiencies.
    • Robust Supply Chain Management: Walmart's highly developed distribution and logistics systems are a core competency, enabling efficient inventory management and product delivery. The company is implementing AI-driven supply chain upgrades to reduce fulfillment costs and enable faster delivery.
    • Omnichannel Integration: Walmart effectively leverages its vast network of physical stores as fulfillment centers for online orders, offering convenient services like grocery pickup and delivery to a significant portion of the U.S. population within one day.
    • Diverse Product Assortment and Private Labels: Walmart offers a wide range of products, including a strong portfolio of private label brands like Great Value and Member's Mark (Sam's Club), which contribute to higher margins and customer loyalty.
    • Technological Advancements: The company is investing heavily in technology, including AI for inventory management, personalized shopping experiences, predictive analytics, and digital shelf labels, to enhance operational efficiency and customer experience. Its mobile app now offers features like in-store scanning and personalized deals.
    • Walmart+ Membership Program: This subscription service offers free shipping, same-day grocery and pharmacy delivery, gas discounts, and other perks, enhancing customer loyalty and competing with Amazon Prime.
    • Expanding Healthcare Services: Walmart is growing its healthcare services, creating new revenue streams and opportunities.
    • Employee-Centric Initiatives: In 2025, Walmart expanded its employee discount program to cover 95% of regularly priced items, aiming to boost retention and generate internal sales.

    Competitive Weaknesses

    Despite its strengths, Walmart faces several notable weaknesses:

    • Thin Profit Margins: The "Everyday Low Prices" strategy, while a strength for consumers, leads to tight profit margins, limiting financial flexibility and potentially impacting investment in certain areas.
    • Overdependence on the U.S. Market: A significant portion of Walmart's revenue is generated domestically, making it vulnerable to U.S. economic fluctuations.
    • E-commerce Lag (Historically): Despite significant investments, Walmart's e-commerce growth has been restricted compared to Amazon, which has a much larger digital footprint and market share. While gaining ground, Walmart's online presence is still smaller.
    • Labor Relations and Employee Treatment: Walmart has faced ongoing criticism regarding employee wages, working conditions, and potential discriminatory practices, which can pose reputational risks.
    • Extensive Inventory: Maintaining a large inventory can sometimes lead to inefficiencies and potential issues with product quality and customer satisfaction if not managed effectively.
    • Private Label Quality Perception: While private labels are a strength, some customers may perceive their quality as lower compared to national brands.
    • Intense Competition: The retail sector is fiercely competitive, with constant pressure from both traditional and e-commerce rivals, forcing Walmart to resort to steep discounts that can impact margins.
    • Regulatory Scrutiny and Reputational Controversies: Due to its size and global reach, Walmart faces intensifying regulatory scrutiny and is susceptible to reputational controversies.

    9. Industry and Market Trends

    The retail industry, as of October 1, 2025, is characterized by dynamic shifts driven by technological innovation, evolving consumer preferences, and persistent macroeconomic pressures. Retailers are increasingly focusing on digital transformation, artificial intelligence (AI) integration, and sustainable practices. Walmart, a global leader, is strategically adapting to and influencing these trends through significant investments in technology, automation, and a robust omnichannel presence.

    Sector-Level Trends

    The retail sector is currently undergoing a fundamental transformation:

    • Digital Transformation and Omnichannel Integration: A key trend is the seamless integration of online and offline shopping experiences. Retail executives are prioritizing omnichannel capabilities, recognizing that these shoppers spend 1.5 times more than those who use only one channel. Consequently, major investments are being made in real-time inventory visibility, unified customer views across channels, and diverse fulfillment options, which can lead to 27% lower fulfillment costs and 18% reduced cart abandonment rates. E-commerce continues to expand rapidly, with projections for 2025 showing a 4.5% growth in online sales.
    • Artificial Intelligence (AI) and Personalization: AI is fundamentally reshaping retail, optimizing inventory management, streamlining operations, and significantly enhancing customer experiences through personalization. A substantial portion of consumers, particularly Gen Z, are already utilizing generative AI for shopping, often replacing traditional search engines. Seven out of ten retail executives anticipate having AI capabilities for personalization in place this year.
    • Sustainability and Circular Economy: Sustainability has become a core business imperative rather than just a secondary initiative. Retailers are adopting practices like carbon footprint tracking for products and developing circular economy business models. The demand for sustainable and affordable options, largely driven by Gen Z, has led to a remarkable 325% growth in fashion brands offering resale programs since 2021.
    • Autonomous Retail and Automation: The industry is seeing a rise in cashierless stores, automated warehouses, and self-driving delivery vehicles, driven by recent labor challenges. Automation is being widely adopted to boost efficiency, with robots increasingly common in inventory management and fulfillment centers.
    • Retail Media Networks (RMNs): RMNs are emerging as a lucrative alternative revenue stream, offering high margins compared to traditional retail operations. They are forecasted to be the fastest-growing advertising channel, with an anticipated 20% annual growth through 2027.

    Macro Drivers Impacting the Retail Industry

    Macroeconomic factors continue to exert significant influence on the retail sector:

    • Consumer Spending and Inflation: Consumer spending remains a vital engine of economic growth, with disposable personal income showing robust growth and overall consumption of goods and services on the rise. However, persistent inflation and high living costs are prompting consumers to prioritize value-oriented shopping. While inflation has moderated, it is still a key consideration, and tariffs are expected to contribute to inflation's impact on holiday sales in 2025.
    • Labor Market Dynamics: A healthy labor market is crucial for sustained retail activity. While job growth has tempered, real wage increases, particularly for lower-income groups, are supporting consumer spending. Retailers are increasingly turning to technology and automation to address staffing shortages and complexities in the workforce.
    • Trade Policy and Tariffs: Uncertainties stemming from trade policies and potential new tariffs are a concern for retail supply chains, potentially increasing costs. Significant tariff increases on consumer goods could impact inventory costs, giving larger retailers who procured goods in advance a competitive edge.
    • Economic Growth: The U.S. economy is projected to experience steady growth in 2025, fueled by strong labor markets and consistent consumer spending, presenting opportunities for the retail sector.

    Supply Chains in the Retail Industry

    Retail supply chains are undergoing substantial evolution to enhance their resilience and efficiency:

    • Resilience and Adaptability: A primary focus is on building resilient supply chains capable of withstanding disruptions. This involves significant technology investments, including real-time inventory visibility and predictive analytics, with 93% of supply chain executives planning to increase resilience through tech in 2025.
    • Technology Integration (AI, Automation, Data Analytics): AI and machine learning are being deployed to predict disruptions, optimize logistics, and track inventory. Automated picking systems, robotic pallet movers, and drone technology are becoming more common in fulfillment centers. Data-driven decision-making is critical for streamlining operations and improving accuracy.
    • Sustainability and Transparency: There's growing pressure from regulators and investors to integrate ESG principles into supply chains. Retailers are adopting energy-efficient transportation, waste reduction programs, and using blockchain for improved traceability.
    • Inventory Management: Companies are moving towards a "just-right" inventory approach, balancing just-in-time practices with safety stocks to mitigate economic fluctuations and potential disruptions.

    Cyclical Effects Impacting the Retail Industry

    The retail industry remains sensitive to economic cycles:

    • Consumer Confidence and Spending: Economic cycles directly influence consumer confidence and discretionary spending. While consumers remain resilient, economic uncertainty is driving them to seek value.
    • Inflationary Pressures: The effects of inflation, even as it eases, contribute to consumers' focus on value. Tariffs are a key uncertainty for 2025, potentially causing short-term inflationary pressures on inventory costs.
    • Seasonal Fluctuations: Seasonal demand, driven by holidays (e.g., Black Friday/Cyber Monday, Christmas) and weather patterns, continues to significantly impact retail sales and inventory planning. Online sales during Black Friday/Cyber Monday 2024 surged by 10.2% year-over-year.
    • Industry Slowdowns: Certain sectors, like the fashion industry, are experiencing a cyclical slowdown in 2025, with consumers showing increased price sensitivity.

    Walmart Specifically (as of 10/1/2025)

    Walmart is strategically positioned to navigate and capitalize on these industry trends:

    • Strategic Vision and Performance: Walmart's strategy for 2025 is centered on a "people-led, tech-powered, omnichannel" approach, aiming for sustained growth and shareholder value. For fiscal year 2025, Walmart reported solid financial growth, with total revenues of $681.0 billion and U.S. net sales of $462.4 billion. Profitability has also seen strong growth.
    • Technology and Automation Investments: Walmart is making substantial investments in its technological infrastructure, including a significant lease in Silicon Valley. The company plans to automate 65% of its stores by 2026, with over half of fulfillment center operations already automated. This involves advanced picking systems, robotic pallet movers, and drone technology. AI is extensively used for demand forecasting, inventory allocation, automated procurement, and even supplier negotiations, yielding significant cost reductions.
    • Omnichannel Leadership: Walmart leverages its vast network of over 4,600 U.S. stores as key fulfillment hubs, driving a 22% increase in global e-commerce sales in Q1 FY2026 and targeting 95% coverage for under-24-hour delivery. They offer diverse fulfillment options, including in-store pickup and ship-from-store, with thousands of pickup and delivery locations globally.
    • Advanced Supply Chain Optimization: Walmart's supply chain strategy focuses on direct sourcing, regional distribution, and deep technology integration to maintain low prices and high product availability. Their global supply chain is being reengineered with real-time AI and automation, rolling out successful U.S. initiatives like "Self-Healing Inventory" to international markets. This system automatically redirects overstock to high-demand stores, saving millions annually. Walmart also employs a vendor-managed inventory (VMI) model to reduce lead times and enhance fulfillment speed.
    • Sustainability Commitment: Sustainability is integrated throughout Walmart's supply chain, with initiatives such as energy-efficient transportation, waste reduction, and the use of renewable energy and blockchain for traceability. These efforts boost transparency and reinforce Walmart's commitment to responsible retail.
    • Competitive Advantage: Walmart's low-cost structure and extensive physical network provide a competitive edge, allowing it to offer attractive pricing and outperform rivals like Amazon and Target in certain market segments, particularly in suburban and rural areas.

    10. Risks and Challenges

    Walmart (WMT) faces a variety of operational, regulatory, controversial, and market risks as of October 1, 2025, influencing its operations, compliance strategies, and strategic outlook. The global retailer is navigating evolving trade policies, diverse legal landscapes, and a push towards greater sustainability and supply chain resilience.

    Operational Risks

    Walmart's vast global operations expose it to several key operational risks:

    • Supply Chain Disruptions and Tariffs: The company's reliance on a global supply chain, particularly for imported goods, makes it highly sensitive to changes in trade policies and tariffs. Increased tariffs, especially from countries like China, can lead to higher sourcing costs for Walmart. This may force the company to raise prices for consumers, potentially impacting sales volume as customers seek lower-priced alternatives. Walmart's CEO has indicated that the company might not be able to absorb all these costs, suggesting price increases could be passed on to consumers. To mitigate this, Walmart may diversify its sourcing strategies, increasing the proportion of domestically sourced goods or those from countries not subject to tariffs.
    • Inflation and Cost Pressures: Persistent inflation and rising operational costs, including labor and transportation, can weigh on Walmart's profit margins. While Walmart has a reputation for low prices, sustained cost pressures could limit its ability to maintain these prices, potentially impacting its competitive advantage and market share. The company operates at below-market gross and net profit margins compared to peers, meaning resumed inflation growth could significantly suppress profits. However, Walmart's strategic investments in automation, logistics, and AI-powered inventory management aim to drive cost control and competitive advantage. Walmart's CEO expects AI to enable growth without increasing headcount, potentially reducing labor costs and boosting free cash flow.
    • E-commerce and Technology Integration: While e-commerce growth is a key strategic focus, Walmart faces challenges in seamlessly integrating technology across its vast physical and digital footprint. Initial costs associated with enhancing e-commerce platforms and transforming in-store experiences could temporarily impact margins. Furthermore, the successful execution of technology investments, particularly in AI, is critical for long-term growth, and any under-delivery could pose a risk.
    • Liability Claims: Walmart has experienced unexpected financial blows due to higher-than-anticipated liability claims. In its Q2 2026 earnings report, Walmart's U.S. operating income growth was offset by approximately $400 million attributed to these claims. This trend is not unique to Walmart, as other major retailers have also flagged increasing liability expenses.
    • Consumer Behavior Shifts: While Walmart has benefited from inflation-weary shoppers seeking value, changes in consumer spending habits, such as a broad pullback in discretionary spending, could impact sales. The company must adapt its pricing strategy and maintain consumer loyalty in a challenging pricing environment.

    Regulatory Risks

    Walmart navigates a complex global regulatory environment, presenting several risks:

    • Third-Party Seller Oversight: Walmart's reliance on third-party sellers for its e-commerce platform is a double-edged sword. While it diversifies inventory, it exposes Walmart to liability for seller actions. Recent regulatory actions, such as New York's $16,000 fine for non-compliant toy gun sales, highlight systemic vulnerabilities in Walmart's screening processes. This recurring issue suggests institutional complacency and is a red flag as states expand regulations to target e-commerce platforms. Stricter compliance could lead to increased operational overheads, reputational damage, and litigation risks.
    • Product Safety and Ingredient Regulations: Walmart is proactively addressing evolving consumer demands and potential regulatory pressures by phasing out synthetic food dyes and certain preservatives from its private-label food offerings by January 2027. This move, while aiming to meet changing tastes and respond to calls from health officials, underscores the ongoing need to adapt to product safety and ingredient regulations.
    • Antitrust and Litigation: Ongoing legal and regulatory problems, including opioid-related cases, pharmacy litigation, and antitrust issues in Mexico and India, continue to hang over the company. These cases could divert capital from growth initiatives and impact investor confidence.
    • Cybersecurity Threats: As of January 31, 2025, Walmart's annual report acknowledges that its systems and those of its third-party service providers have experienced cybersecurity incidents and threats. While the company is not aware of any material impacts to its business strategy, operations, or financial condition from these threats, there's no assurance that future incidents won't materially affect them.

    Controversies

    Several controversies challenge Walmart's reputation and operations:

    • Diversity, Equity, and Inclusion (DEI) Policies: In April 2025, a seven-day boycott of Walmart began, protesting what a nonpartisan group, The People's Union USA, sees as corporate giant's tax avoidance, inequality, and rising prices. This boycott was partly fueled by Walmart's November 2024 decision to roll back DEI policies, no longer considering race and gender when making decisions about suppliers, ending various diversity programs, and removing "diversity" and "DEI" from documents in favor of language about "belonging." This move has generated public scrutiny and boycotts, potentially impacting customer perception and sales.
    • Corporate Practices and Social Responsibility: The boycotts mentioned above also cite broader concerns about tax avoidance, inequality, and rising prices, reflecting ongoing scrutiny of Walmart's corporate practices and social responsibility initiatives.

    Market Risks

    Walmart is exposed to various market risks that could impact its stock performance and financial health:

    • Economic Uncertainty and Consumer Spending: Macroeconomic uncertainty, including inflation and a potential consumer slowdown, remains a key risk. While Walmart's focus on affordability and its strong position in the grocery segment provide some resilience, a broad pullback in consumer spending could significantly impact its sales and profitability.
    • Intensified Competition: The retail landscape is highly competitive, with rivals like Amazon and other discount retailers constantly threatening Walmart's pricing power, particularly in e-commerce and international markets. As Walmart enhances its offerings and invests in technology, competitors are likely to respond, leading to intensified competition.
    • Tariff Fallout and Trade Tensions: The ongoing threat of new U.S. import tariffs and potential reciprocal tariffs from countries like China poses a significant risk. Walmart cautioned about tariffs, and analysts have suggested the company could retract its full-year forecasts due to their impact. Tariffs can lead to increased costs for imported goods, which Walmart may pass on to consumers, potentially affecting sales and market share.
    • High Valuation and Investor Expectations: Walmart's stock has been trading at a significant premium to both its peers and the benchmark, with a forward P/E of around 39 times earnings as of late September 2025. This elevated valuation leaves little room for error; any slip in performance or weaker-than-anticipated consumer outlook could lead to a sharp pullback in the stock price. Investors are already paying for future growth, and sustained, strong execution and faster-than-expected earnings or margin expansion are needed to justify the current valuation.
    • Currency Fluctuations: Currency fluctuations can negatively impact Walmart's reported sales and operating income, particularly for its international segment. In Q3 FY2025, currency pressure negatively impacted reported sales and operating income growth by approximately 70 and 160 basis points, respectively.

    11. Opportunities and Catalysts

    Walmart (WMT) is actively pursuing a multi-faceted strategy to drive growth and enhance shareholder value as of October 1, 2025, focusing on key growth levers, strategic market expansions, potential M&A benefits, and various near-term events.

    Growth Levers

    Walmart's growth strategy is underpinned by a "people-led, tech-powered omnichannel" approach, integrating its vast physical footprint with advanced digital capabilities.

    • E-commerce Dominance and Speed: E-commerce is a significant growth driver, with Walmart's online operations accounting for approximately 18% of total company revenue in fiscal year 2025, up from an estimated 15.4% in FY24. U.S. e-commerce grew 20% and global e-commerce expanded 16% in Q4 FY25. In Q2 FY26 (ended July 31, 2025), global online sales surged 25% year-over-year, with U.S. and Sam's Club e-commerce each growing 26%. This growth is fueled by a relentless focus on speed, leveraging its store network for ultra-fast deliveries, with 95% of the U.S. population expected to have access to deliveries in three hours or less by late 2025. Store-fulfilled deliveries increased 50% year-over-year in Q2 FY26.
    • Retail Media (Walmart Connect) and Advertising: Walmart Connect, the company's U.S. retail media arm, is a crucial profit driver. Walmart's global advertising business grew nearly 50% in fiscal Q2 FY26, boosted by the integration of connected TV maker Vizio, which was acquired for $2.3 billion in December 2024. Walmart Connect alone saw U.S. ad sales grow 31% year-over-year in Q1 FY26. Retail media and membership offerings collectively constitute a quarter of Walmart's profits. The company increased its advertising spend to $5.1 billion in FY25, a 16% jump from FY24.
    • AI and Automation: Walmart is operationalizing AI across various layers of its business. This includes AI-driven inventory management, geospatial technology for optimizing delivery, predictive analytics, and automated sorting systems in fulfillment centers. AI is also being leveraged for customer-facing shopping agents, computer-vision checkout, and large-language models to shorten fashion lead times. In its supply chain, AI-powered optimization software has saved 30 million driving miles and reduced logistics costs. Walmart is also using AI to transform developer workflows with its WIBEY system, built on the Element machine learning and AI platform.
    • Membership Programs: Accelerated growth of membership across formats, including Walmart+ and Sam's Club, with expanding benefits and higher renewals, contributes to profitability.
    • Store Modernization and Expansion: Plans for 2025 include opening over 150 new stores under its "Store of the Future" concept and remodeling 650 existing locations across 47 states and Puerto Rico. Sam's Club is also accelerating new club growth, aiming for 15 new clubs annually, and plans to remodel all 600 clubs as a strategic investment.
    • Private Brands and Assortment: Walmart is investing in owned brands, including the launch of "bettergoods," a private food brand. Walmart U.S. currently has 21 private brands with over $1 billion each in annual sales, five exceeding $5 billion. As of October 1, 2025, Walmart announced plans to remove synthetic food dyes and 30 other ingredients from its store brands by January 2027, impacting about 1,000 products, including Great Value, Marketside, and Freshness Guaranteed lines.
    • Healthcare Initiatives: Walmart is actively expanding its presence in healthcare. The company is transforming the healthcare shopping experience with new digital innovations, including "Everyday Health Signals," an AI-powered health platform, to help Medicare Advantage customers maximize supplemental benefits. This platform helps customers identify plan-specific, benefits-eligible products online and track their spending. Walmart aims to have more than 75 Walmart Health centers operational by early 2025, though this goal was previously delayed from 2024. These centers offer a range of services including primary care, dental, behavioral health, and pharmacy services, with a focus on underserved communities. Walmart also nationally launched pharmacy delivery, integrating prescription medications into its e-commerce experience.

    New Markets

    Walmart's new market focus extends beyond geographical expansion to encompass new service and product categories.

    • International Expansion: Walmart International is focusing on growth in markets like Mexico, China, and India, with a goal of reaching $200 billion in GMV and doubling profits and digital mix by 2028.
    • Walmart Marketplace: The Walmart Marketplace is experiencing explosive growth, surpassing 200,000 active sellers by mid-2025, with a significant influx of international sellers (nearly 60% of new sellers in 2025 originating from China). The company is expanding its U.S. marketplace and has launched marketplaces in multiple global markets.
    • Business Mix Accelerators: Walmart U.S. is investing in "business mix accelerators" such as Walmart+, Walmart Connect, Data Ventures, and Fintech to fuel growth and bolster profitability.
    • Healthcare Services: The expansion of Walmart Health centers and the launch of digital health platforms represent a significant push into the healthcare services market.

    M&A Potential

    While specific future M&A targets are not explicitly detailed in the search results, the recent acquisition and strategic focus provide insights:

    • Vizio Acquisition (completed December 2024): This $2.3 billion acquisition is a significant recent M&A event, directly boosting Walmart's advertising business by integrating Vizio's connected TV inventory. This acquisition demonstrates Walmart's willingness to acquire companies that strategically enhance its growth levers, particularly in high-margin areas like retail media.
    • Strategic Investments: Walmart's emphasis on scaling digital and related businesses, including membership, advertising, data, and Fintech, suggests that future M&A could target companies that complement these "business mix accelerators" to further diversify income streams and enhance profitability.

    Near-term Events (as of 10/1/2025)

    • Upcoming Earnings Report: Walmart's next earnings report (Q3 fiscal year 2026) is estimated for Thursday, November 20, 2025, before market open. Analysts forecast consensus EPS of $0.60 for the quarter ending October 2025. The previous Q2 FY26 earnings were reported on August 21, 2025, with an EPS of $0.68 on revenue of $177.4 billion.
    • Product Launches (Ongoing/Upcoming):
      • "WICKED: FOR GOOD" Collection: Walmart launched an exclusive collection of products related to the movie "Wicked: For Good" on October 1, 2025, including dolls, clothing, speakers, and a singing toothbrush.
      • New Food Items: Throughout 2025, Walmart introduced various new food items under its private brands, such as "Better Goods" frozen chicken wings with spicy dill dry rub, Hot Honey Chicken and Waffle Breakfast Sandwich, Dairy Free Lemon Strawberry Sorbet, and "Great Value" Confetti Crunch cereal.
      • Walmart Start Program: Brands selected for the "Walmart Start" program, focusing on beauty categories (hair, skin, cosmetics, nails, fragrance, beauty accessories), are expected to launch in Walmart stores and/or online between December 2025 and March 2026.
      • Food Additive Removal Plan: On October 1, 2025, Walmart announced plans to remove synthetic food dyes and 30 other ingredients from its U.S. store brands by January 2027. This initiative will impact about 1,000 products, with reformulated items expected in the coming months.
      • Everyday Health Signals Rollout: Walmart rolled out its AI-powered health platform, "Everyday Health Signals," starting in May 2025, specifically for Medicare Advantage members.

    12. Investor Sentiment and Analyst Coverage

    Investor Sentiment for Walmart (WMT) as of October 1, 2025

    Investor sentiment for Walmart (WMT) as of October 1, 2025, reflects a generally positive outlook from Wall Street analysts and a notable level of institutional investment, though with some insider selling. Retail investor sentiment, while broadly positive, shows some underlying concerns regarding valuation and macroeconomic factors.

    Wall Street Ratings

    Wall Street analysts hold a predominantly optimistic view of Walmart. The consensus rating for WMT is a "Strong Buy" or "Moderate Buy."

    • Consensus Price Targets: The average twelve-month price target from analysts ranges from approximately $110.68 to $114.89, with a median target of $114.00. This suggests a potential upside of 9.49% to 13.47% from the stock's price around $103.16-$103.30 in late September/early October 2025.
    • Recent Analyst Activity: In September 2025, several firms reiterated or initiated positive ratings. Piper Sandler issued an "Overweight" rating with a $111.00 price target on September 24, 2025. Telsey Advisory Group also issued an "Outperform" rating with a $118.00 price target on the same date. Wolfe Research initiated coverage with an "Outperform" rating and the highest target price of $129.00 on September 18, 2025. Other recent "Buy" or "Outperform" ratings and targets came from Tigress Financial ($125.00), B of A Securities ($125.00), Goldman Sachs ($115.00), JP Morgan ($127.00), Evercore ISI Group ($110.00), and Guggenheim ($115.00).
    • Overall Recommendation: Out of 30 analysts covering WMT, 29 have given a "Buy" rating and 1 has given a "Hold" rating, with no "Sell" ratings, reinforcing the positive sentiment. Analysts generally favor Walmart more than other "retail/wholesale" companies, which have an average consensus rating of "Hold."

    Hedge Fund Moves

    Hedge funds and other institutional investors collectively own 26.76% to 36.09% of Walmart's stock.

    • Increased Holdings: In the last quarter, hedge funds increased their holdings in Walmart by 324.4K shares. Several institutional investors have recently boosted their positions. Capital Investment Advisors LLC increased its stake by 2.8% in Q2 2025. Vanguard Group Inc. significantly increased its position by 0.8% in Q1 2025, holding over 425 million shares. Kingstone Capital Partners Texas LLC dramatically raised its position by 397,264.9% in Q2 2025, acquiring over 104 million shares. Goldman Sachs Group Inc. increased its position by 30.1% in Q1 2025. Other firms like Ameriprise Financial Inc., Invesco Ltd., Operose Advisors LLC, PFS Partners LLC, Bear Mountain Capital Inc., G&S Capital LLC, and Clal Insurance Enterprises Holdings Ltd. also reported increased holdings in Q1 or Q2 2025.
    • Major Holders: Prominent hedge funds holding substantial stakes in Walmart include Ken Fisher, Bill Gates, and Magnus Billing. Major institutional shareholders also include BlackRock, Inc., State Street Corp, Jpmorgan Chase & Co, Geode Capital Management, Llc, Morgan Stanley, Bank Of America Corp /de/, and Norges Bank.
    • Insider Selling: Despite the positive institutional sentiment, there has been notable insider selling activity over the past six months. Walmart insiders have traded WMT stock 58 times, all of which were sales, with no purchases. The Walton Family Holdings Trust sold over 23 million shares, and CEO C. Douglas McMillon and EVP John R. Furner also made significant sales in Q3 2025. This insider selling has sparked debates on corporate governance and sentiment among investors.

    Institutional Investors

    Institutional ownership in Walmart is substantial, with 2,967 institutional buyers and total institutional inflows of $51.38 billion over the last 12 months, against 2,366 institutional sellers and $21.59 billion in outflows. This indicates a net positive flow of institutional money into WMT. Walmart's stock is a component of many large ETFs, and its performance can influence the broader market.

    Retail Chatter

    Retail investor sentiment for Walmart is generally positive, with an overall sentiment score of 80 out of 100 on top investing forums, although this is slightly down compared to the 30-day moving average. Walmart is seen to outperform a majority of its industry peers in sentiment, ranking in the 80th percentile.

    However, looking at specific discussions, some concerns are evident:

    • Valuation Concerns: In August 2025, discussions on Reddit's r/stocks forum indicated that some retail investors find Walmart's current valuation high, with a P/E ratio of 37, pricing it like a tech growth stock despite its forecasted revenue growth of 3.75-4.75% for 2025. There's a sentiment that the stock might stay flat or slightly down until earnings catch up to the price.
    • Tariff Impact: Concerns about potential U.S. import tariffs and their impact on Walmart's low-margin retail model were frequently discussed. An April 2025 StockTwits poll showed retail sentiment dropped from "extremely bullish" to "bullish" due to these tariff worries. Investors anticipated potential price hikes and margin compression if tariffs persist.
    • Consumer Spending: In March 2025, Walmart's CEO Doug McMillon noted "stressed behaviors" and low confidence among budget-constrained American consumers, which led to a $22 billion drop in Walmart's market cap and sparked discussions among retail investors about the impact on the company's revenue, particularly for a low-price retailer usually insulated from economic downturns. This indicates a cautious view on consumer spending impacting retail profits.
    • E-commerce and Diversification: Despite these concerns, retail discussions also highlight Walmart's strong e-commerce growth (over 20% year-over-year global e-commerce sales in Q2 FY2025) and diversification into advertising and membership services (Walmart+), which are seen as positive drivers for future growth and competitive advantage against online retailers like Amazon. Walmart's efforts to eliminate synthetic dyes and other ingredients from its private brands also reflect a response to customer demand for simpler, natural ingredients, which could positively impact customer perception.

    In summary, while professional analysts maintain a strong buy rating for Walmart, reflecting confidence in its strategic initiatives and market position, retail investors show a more nuanced sentiment, acknowledging Walmart's strengths but also expressing caution regarding its valuation and the potential impacts of macroeconomic challenges like tariffs and consumer spending.

    13. Regulatory, Policy, and Geopolitical Factors

    Walmart (WMT) faces a complex interplay of regulatory and geopolitical factors as of October 1, 2025, influencing its operations, compliance strategies, and strategic outlook. The global retailer is navigating evolving trade policies, diverse legal landscapes, and a push towards greater sustainability and supply chain resilience.

    Relevant Laws and Compliance

    Walmart operates under a vast array of laws and compliance requirements, both domestically and internationally.

    1. Supplier Compliance and Product Safety:
    Walmart maintains stringent compliance programs for its suppliers. The On-Time In-Full (OTIF) program monitors delivery performance, while the Supplier Quality Excellence Program (SQEP) addresses aspects like purchase order accuracy, labeling, packaging, and product preparation. Non-compliance with OTIF targets (e.g., 98% on-time for Collect Ready, 90% for Prepaid, and 95% In-Full) can result in a 3% penalty on the cost of goods sold. Suppliers must ensure label accuracy, use approved barcode formats, and comply with pallet requirements. They are also required to maintain records for at least six years.
    For products sold on its marketplace, particularly children's items, Walmart is tightening rules, requiring Children's Product Certificates (CPC) and enforcing stricter adherence to avoid suspensions and "gating" of products. Furthermore, suppliers must carry specific types of insurance and are subject to audits, certifications, and testing for food safety, general merchandise product safety, health and wellness product safety, responsible sourcing, and supply chain security.

    2. Labor Laws and Workforce Management:
    Minimum wage laws in various states and localities directly impact Walmart's wage obligations. As of 2025, the average hourly wage for a Walmart U.S. associate was $18.25. The company has recently increased base pay and bonus packages for store managers, with some earning over $600,000 annually, including stock grants and incentives. Walmart also expanded its parental-leave plan and family adoption benefits.
    A significant recent development is a U.S. Supreme Court ruling that allows the Trump administration to end Temporary Protected Status (TPS) for hundreds of thousands of migrants. This has led Walmart to terminate migrant workers at some Florida stores who lack valid federal work authorization, underscoring stricter adherence to federal I-9 verification requirements.

    3. Environmental Regulations and Sustainability Commitments:
    Walmart has ambitious environmental goals but faces challenges in meeting them. The company aims to reduce its Scope 1 and 2 greenhouse gas emissions by 35% by 2025 and 65% by 2030 (from 2015 levels). It also committed to achieving "zero waste to landfill" in its operations in key markets (U.S., U.K., Japan, Canada) by 2025. Additionally, Walmart targets powering 50% of its global operations with renewable energy by 2025 and 100% by 2035.
    However, Walmart anticipates missing its 2025 and 2030 emissions reduction targets, citing challenges with energy policy, infrastructure, and the availability of economically viable technologies, such as low-emitting refrigeration and heating systems, and low-carbon heavy transportation. The company may revise these targets in 2025. In a move towards product sustainability, Walmart U.S. is eliminating synthetic dyes and 30 other ingredients from its private brand food products by October 2025.

    4. Data Privacy Laws:
    Walmart is subject to evolving data privacy regulations, including the California Consumer Privacy Act (CCPA), which requires retailers to provide consumers with rights to access, correct, delete, and opt-out of the sale or sharing of their personal information. The company has implemented "Do Not Sell My Info" links on its websites and signage in California stores. The increasing use of AI and generative AI technologies presents new data privacy risks and compliance complexities, especially with a fragmented regulatory environment across different jurisdictions. Walmart's privacy notice outlines how personal and biometric information is handled and retained.

    5. Anti-Corruption and Ethical Conduct:
    Walmart maintains a Global Anti-Corruption Policy that strictly prohibits the use of company funds or assets for illegal, improper, or unethical purposes. Compliance is mandatory for all associates and third parties interacting with government officials on Walmart's behalf.

    Government Incentives

    Governments provide various incentives that impact Walmart's operations, particularly in areas of job creation, local development, and domestic sourcing.

    1. Job Development and Investment Grants:
    Walmart benefits from local and state government incentives for economic development. For example, North Carolina awarded Walmart Fulfillment Services, LLC a Job Development Investment Grant (JDIG) of up to $3.6 million over 12 years for a new fulfillment center in Gaston County. This grant is contingent on meeting incremental job creation and capital investment targets.

    2. Support for Small Businesses and Domestic Sourcing:
    Walmart actively engages with programs that support American-made products and small businesses. Its "Grow with US" program and annual "Open Call" event (with applications opening June 24, 2025, and the event in October 2025) aim to facilitate U.S.-based small and medium-sized businesses in becoming Walmart suppliers, providing them with training, mentorship, and access to the national market. Over two-thirds of Walmart's total product spend is on items made, grown, or assembled in the United States, with over 60% of its U.S. suppliers being small businesses.

    3. Community Grants:
    Walmart and Sam's Club also offer "Spark Good Local Grants," ranging from $250 to $5,000, to local community organizations addressing specific community needs, provided they meet tax ID and verification requirements.

    Geopolitical Risks and Opportunities

    Walmart operates globally, making it susceptible to geopolitical shifts, trade policies, and international relations.

    1. Trade Wars and Tariffs (Risk):
    Ongoing US-China tariffs have significantly impacted Walmart's supply chain, increasing costs, particularly for consumer electronics, apparel, and household goods. In early 2025, the U.S. announced 10% tariffs on Chinese imports and 25% on Mexican/Canadian goods, with China facing particularly high rates (e.g., 125% in some cases) under emergency powers. This volatility forces Walmart to evaluate its pricing strategies and supply chain dynamics, leading to higher prices for consumers on hundreds of products. The company has temporarily pulled its financial guidance due to this uncertainty.

    2. Supply Chain Diversification and Nearshoring (Risk Mitigation & Opportunity):
    To mitigate tariff risks and build resilience, Walmart is aggressively diversifying its global supply chain. It sources from over 70 countries, significantly shifting away from China (which accounted for 20% of goods sourced in early 2025) towards other regions like India, Mexico, and Vietnam. Imports from India increased from 2% to 25% between 2018 and 2023, while Chinese imports decreased from 80% to 60% in the same period.
    Mexico has emerged as a key nearshoring partner, offering tariff-free access under the USMCA for textiles, electronics, and machinery. Mexico's IMMEX 4.0 program also presents opportunities for cheaper nearshored production. However, potential U.S. tariffs on Mexico could escalate if issues like migration or fentanyl flows persist, posing a risk to these nearshoring efforts.

    3. Geopolitical Instability and Economic Uncertainty (Risk):
    Geopolitical tensions and broader economic uncertainties are dampening consumer spending and are expected to result in lower sales and profits for Walmart in 2025. Rising inflation rates in the U.S. further contribute to this cautious outlook. Supply chain fragility due to global chip shortages and ongoing geopolitical conflicts (e.g., Sino-U.S. tensions) could also disrupt nearshoring plans.

    4. Strategic Market Focus and "De-Americanization" (Opportunity & Risk):
    Walmart International is strategically focused on growth in key markets such as Mexico, China, and India, aiming to be a leading omnichannel retailer in each. Despite U.S.-China tensions, Walmart China has successfully boosted domestic sourcing, with over 60% of its inventory now locally produced, reducing exposure to cross-border tariffs. Walmart's e-commerce in China also saw significant growth in 2025 through strategic integrations with domestic platforms. India's burgeoning manufacturing sector, attractive labor costs, and technological advancements make it a significant opportunity for supply chain diversification, with Walmart committing to import $10 billion annually from India by 2027.
    However, the increasing trade volatility and tariffs have reportedly led Walmart to consider a radical "de-americanization" strategy, potentially relocating its global operational core outside the United States to jurisdictions like Singapore, Ireland, or the UAE, which offer greater legal flexibility and insulation from U.S.-centric trade policies. This could involve scaling back procurement from domestic U.S. suppliers and lead to job losses in the U.S.

    5. Technology and Innovation (Opportunity):
    Walmart is investing heavily in AI and automation to transform its supply chain, improving inventory management, enabling faster fulfillment, and reducing costs. AI is being used in supplier negotiations and to analyze global data and trends for product development, particularly in fashion. These technological advancements enhance the company's ability to navigate geopolitical complexities and operational inefficiencies.

    In conclusion, as of October 2025, Walmart is actively adapting to a dynamic global environment. While facing risks from trade protectionism, economic uncertainty, and complex regulatory landscapes, it is leveraging strategies like supply chain diversification, nearshoring, and technological innovation to maintain its competitive edge and pursue growth opportunities in key international markets.

    14. Outlook and Scenarios

    Walmart (WMT) is navigating a dynamic retail landscape with a multi-pronged strategy focused on digital transformation, diversified revenue streams, and an enhanced customer and employee experience. As of October 1, 2025, the company faces both significant opportunities and challenges in its future outlook.

    Bull Case

    The bull case for Walmart is driven by its robust strategic pivots and strong market positioning:

    • E-commerce Growth and Profitability: Walmart's U.S. e-commerce segment has shown impressive growth, surging 26% in Q2 FY25, and notably became profitable in Q1 FY26. E-commerce now accounts for 18% of total net sales. The company leverages its extensive network of over 4,600 U.S. superstores as fulfillment hubs, aiming to achieve less than 24-hour delivery coverage for 95% of U.S. households by December 2025. This focus on "route density" helps spread costs over more volume, contributing to profitability.
    • High-Margin Businesses: Walmart's advertising business, Walmart Connect, is a significant growth driver, with global advertising revenue (including the recently acquired VIZIO smart TV manufacturer) increasing by 46% in Q2 FY26. Even excluding VIZIO, Walmart Connect grew 31%, providing "flexibility" and acting as an important profit driver amidst economic pressures. Membership programs like Sam's Club and Walmart+ are also expanding, contributing to shareholder value.
    • Healthcare Expansion: Walmart is expanding its footprint in healthcare with Walmart Health clinics, aiming to operate over 70 physician-staffed clinics in five states by the end of 2024 and introducing Arizona in 2025. The company is remodeling nearly 2,000 pharmacy locations by the end of 2025 to include dedicated Health Services rooms for clinical services like testing, treatment, and immunizations. This strategic move positions Walmart as an accessible healthcare resource, especially in underserved communities.
    • Technological Advancement (AI & Automation): Walmart is heavily investing in AI and automation to optimize its supply chain, inventory management, and overall operations. CEO Doug McMillon stated that AI will "literally touch every job" within the company, indicating a proactive approach to integrating AI for efficiency and cost reduction.
    • Strong Analyst Sentiment: The majority of Wall Street analysts maintain a positive outlook, with a consensus rating of "Moderate Buy" or "Strong Buy." Recent analyst price targets range from $109.00 to $129.00, with a median target of $114.00.

    Bear Case

    Despite the positive momentum, Walmart faces several challenges:

    • Recent Earnings Miss: Walmart recently missed consensus estimates for EPS and revenue in the quarter ending August 21, 2025. The company reported $0.68 EPS against an expected $0.74, and revenue of $169.34 billion compared to a forecast of $174.02 billion.
    • Cost Pressures: The company is experiencing increased cost pressures from elevated general liability claims, having accrued an additional $450 million in Q2 FY26, with an expected total of $730 million for the first half of FY26.
    • Competitive Landscape: Walmart operates in a fiercely competitive retail environment, facing strong competition from e-commerce giants like Amazon and other traditional retailers.
    • Insider Selling and Technical Signals: Some technical indicators suggest potential short-term headwinds, including a sell signal from a pivot top point and a double top formation observed on September 17, 2025. Additionally, insiders have been selling more shares than they are buying.
    • Currency Fluctuations: Currency fluctuations negatively impacted Walmart's net sales by $3.2 billion in FY25.
    • Tariff Impact: Ongoing economic uncertainties driven by tariffs could impact prices and consumer spending, which Walmart aims to mitigate through its growing advertising and membership businesses.

    Short-Term Projections (as of 10/1/2025)

    • Stock Price: For October 2025, WMT is projected to trade between $102.01 and $110.37, with an average monthly value of $106.37. Some forecasts anticipate a rise to approximately $108.53 per share by October 28, 2025. Another projection suggests a closing price of $111 by the end of October 2025.
    • Earnings and Revenue: For the current quarter, Walmart is expected to post earnings of $0.60 per share, representing a 3.5% increase from the prior-year quarter. Q3 FY26 guidance for EPS is set between $0.58 and $0.60. Consensus sales estimates for the current quarter are $177.01 billion, indicating a 4.4% year-over-year change.
    • Strategic Initiatives: Walmart is launching a "Walmart Deals" sales event in October 2025 to compete with Amazon's Prime Big Deal Days. The company is also continuing the rollout of reformulated private brand food products, removing synthetic dyes and other ingredients, with a full transition expected by January 2027. Remodeling and upgrading nearly 2,000 pharmacy locations with dedicated Health Services rooms are also ongoing through the end of 2025.

    Long-Term Projections

    • Stock Price: Looking ahead, some forecasts suggest Walmart's price could climb to $122 in the first half of 2026 and close the year at $123. Long-term estimates indicate a potential share price above $200.00 by 2030–2035, with analysts also suggesting Walmart could reach $140 by 2030.
    • E-commerce Dominance: Walmart aims to solidify its digital leadership by reaching 95% of U.S. households with sub-24-hour delivery by December 2025. Automation in fulfillment centers is projected to handle over half of the volume, leading to approximately 20% reduction in unit costs.
    • AI Integration: The widespread integration of AI across all job functions within Walmart is a long-term strategic focus, aiming to enhance efficiency and create new opportunities for employees through training and transition support.
    • Sustainable Growth: Walmart's long-term strategy involves strengthening its business model to deliver strong returns, growing profit faster than sales, and enhancing cash flows, while investing in lower prices, associate wages, and experience-enhancing technologies.
    • International Expansion: The company plans its largest global expansion in years, with the opening of its first branded stores in South Africa by the end of 2025, and continued growth in Latin America, Canada, China, and India.

    Strategic Pivots for Walmart's Future as of 10/1/2025

    Walmart's future strategy is characterized by several key pivots:

    1. Omnichannel Integration and Hyper-Convenience: The company is deeply committed to its "people-led, tech-powered omnichannel strategy," seamlessly integrating its vast physical store network with its growing e-commerce capabilities. This includes expanding fast delivery options (such as <3-hour "Express" windows), leveraging stores for fulfillment, and continuously improving the online and in-store shopping experience.
    2. Diversification into High-Margin Services: Walmart is actively reshaping its profit mix by significantly investing in and growing its advertising business (Walmart Connect) and membership programs (Walmart+ and Sam's Club). These segments offer higher margins compared to traditional retail and provide "flexibility" for continued investment in core retail operations.
    3. Aggressive Expansion in Healthcare: Walmart is making a strategic push into healthcare, aiming to become a major provider of accessible and affordable health services. This involves expanding Walmart Health clinics, introducing new testing and treatment services, and integrating pharmacy and vision centers into a broader healthcare ecosystem.
    4. AI and Automation-Driven Transformation: A core pivot is the extensive adoption of AI and automation across the entire enterprise. This includes optimizing supply chains, enhancing inventory management, streamlining customer service, and leveraging data for trend analysis. The company is also focusing on upskilling its workforce to adapt to AI-driven changes.
    5. Focus on Private Brands and Ingredient Transparency: Walmart is enhancing its product assortment and investing in owned brands. In response to consumer demand, the company is committed to removing synthetic dyes and 30 other ingredients from its private label food products, with a full transition planned by January 2027.
    6. Strategic International Growth: While maintaining a strong domestic presence, Walmart is undertaking significant international expansion, exemplified by its plans to open branded stores in South Africa. The strategy involves building strong local businesses powered by Walmart's global scale and standards.
    7. Associate Investment and Engagement: Recognizing the importance of its workforce, Walmart is investing in its associates through expanded employee discounts, competitive wages, increased bonus potential for store managers, and providing training and support for evolving job roles in an AI-powered future.

    In summary, Walmart is transforming from a traditional retail giant into a "people-led, tech-powered omnichannel retailer". While facing competitive pressures and the need to consistently meet earnings expectations, its strategic pivots into e-commerce profitability, diversified high-margin businesses, healthcare, AI, and international expansion position it for sustained growth in the short and long term.

    15. Conclusion

    Walmart (WMT) has demonstrated robust performance and strategic agility as of October 1, 2025, driven by strong e-commerce growth, strategic investments in technology and supply chain, and an expanded focus on membership and advertising services. The company continues to solidify its position as a dominant force in global retail, though it faces ongoing challenges related to the economic environment and intense competition.

    Summary of Key Findings:

    • Strong Financial Performance: Walmart reported significant growth in its recent fiscal quarters. For Q2 FY2026 (ended August 1, 2025), consolidated revenue was $169.3 billion, up 4.8% (5% in constant currency), exceeding expectations. Adjusted EPS for Q2 FY2026 was $0.67. Q3 FY2025 (ended October 2024) also saw total sales increase by 6.1% in constant currency, with adjusted EPS growing by 14% to $0.58, surpassing guidance.
    • E-commerce and Omnichannel Dominance: E-commerce sales have been a major growth driver, with global e-commerce surging 21% in Q2 FY2026 and U.S. digital sales up 22%. Walmart U.S. e-commerce grew 22% in Q3 FY2025, contributing significantly to comparable sales. The company's omnichannel strategy, including grocery pickup, delivery, and Walmart+ subscription service, is resonating with customers. Automation now handles 45% of e-commerce fulfillment.
    • Strategic Investments: Walmart is heavily investing in technology, including AI and automation, to enhance operations and customer experience. This includes a significant lease in Silicon Valley, suggesting deeper integration of e-commerce, logistics technology, and AI. The company is also modernizing its physical footprint with a "Store of the Future" concept, planning to open over 150 new stores and remodel 650 existing locations by 2029.
    • Diversified Revenue Streams: Beyond traditional retail, Walmart is expanding its higher-margin businesses. Global advertising revenue grew 46% in Q2 FY2026, including the acquisition of VIZIO in December 2024. Membership income from Sam's Club and Walmart+ also saw double-digit growth. The company's Indian fintech subsidiary, PhonePe, confidentially filed for an IPO, aiming for a valuation of approximately 120 billion rupees, further diversifying Walmart's strategic interests.
    • Customer and Employee Focus: Walmart has expanded its 10% employee discount to 95% of regularly priced items, including groceries, which is expected to boost retention and generate significant internal sales. The company is also responding to customer demand for simpler ingredients by eliminating synthetic dyes and 30 other ingredients from its private brand food products by January 2027.

    A Balanced Perspective:

    Strengths:

    • Market Dominance and Scale: Walmart remains the world's largest retailer, with substantial brand recognition and market power over suppliers.
    • Effective Omnichannel Strategy: The seamless integration of physical stores with strong e-commerce capabilities, including rapid delivery and pickup options, provides a significant competitive advantage.
    • Technological Innovation: Aggressive adoption of AI, automation, and data analytics is driving efficiency, improving customer experience, and diversifying revenue streams.
    • Pricing Power: Walmart's "Everyday Low Price" strategy continues to attract price-conscious customers, including higher-income households.

    Weaknesses:

    • Thin Profit Margins: While improving, profit margins can be thin in the core retail business, and increased legal expenses can impact the bottom line.
    • Overdependence on U.S. Market: Despite international presence, a significant portion of Walmart's revenue and stores are concentrated in the U.S., potentially exposing it to domestic economic fluctuations.
    • Competitive Landscape: Facing intense competition from online giants like Amazon and brick-and-mortar rivals such as Target, Costco, and Kroger, requires continuous investment and innovation.

    Opportunities:

    • Further E-commerce Expansion: Continued growth in the e-commerce market provides substantial opportunities for Walmart to expand its online sales channels and market share, particularly in categories like fashion, home, and automotive.
    • Global Market Penetration: Expansion into developing markets can diversify revenue streams and increase the global customer base.
    • High-Margin Businesses: Further scaling advertising services (Walmart Connect) and membership programs (Walmart+, Sam's Club) can reshape the profit mix.
    • Supply Chain Optimization: Continued investments in AI-driven supply chain upgrades can reduce fulfillment costs and enable faster delivery.

    Threats:

    • Economic Uncertainty and Consumer Spending: A potential pullback in consumer spending and ongoing inflation could impact sales, particularly in general merchandise.
    • Tariffs: The potential impact of new tariffs on goods sourced from countries like China could lead to increased prices and affect Walmart's low-price model.
    • Intense Competition: The fierce competition from various retailers, both online and in physical stores, necessitates continuous adaptation and innovation to maintain market share.
    • Regulatory Risks: Walmart faces ongoing scrutiny regarding employment policies, wages, and working conditions, which could lead to legal actions and reputational damage.

    What Investors Should Watch Regarding Walmart as of 10/1/2025:

    Investors should monitor several key areas to assess Walmart's performance and future outlook:

    1. E-commerce Growth and Profitability: While e-commerce sales are strong, investors should watch for continued acceleration and, critically, for signs of improving profitability in this segment, as the company works to narrow losses and optimize delivery costs.
    2. Membership Program Expansion (Walmart+ and Sam's Club): Growth in membership numbers and increased penetration of higher-tier memberships (e.g., Sam's Club Plus) directly contribute to recurring, high-margin revenue.
    3. Advertising Revenue Growth: The expansion of Walmart Connect and the successful integration of newly acquired assets like VIZIO are crucial for diversifying revenue and improving overall margins.
    4. Impact of AI and Automation Investments: Investors should look for tangible benefits from technology investments, such as improved supply chain efficiency, reduced operational costs, and enhanced customer experiences that translate into sales growth and margin expansion.
    5. International Performance and Strategic Divestitures/IPOs: The performance of international segments, especially in high-growth markets like India (Flipkart, PhonePe IPO), and the strategic management of other global operations, will be important.
    6. Consumer Spending Trends and Inflation: Given Walmart's reliance on consumer spending, especially for groceries, any significant shifts in consumer behavior due to economic uncertainty, inflation, or interest rates could impact sales and margins.
    7. Tariff and Supply Chain Management: How Walmart navigates potential new tariffs and manages its global supply chain to mitigate cost increases and maintain competitive pricing will be critical.
    8. Guidance Updates: Walmart's updated fiscal year 2025 guidance projects consolidated net sales to increase 3.75-4.75% year-over-year in constant currency, and adjusted EPS to be $2.35-$2.43. Any revisions to this guidance in future earnings reports will be significant.
    9. Analyst Sentiment and Price Targets: Analysts currently rate WMT as a "Moderate Buy" or "Strong Buy," with an average price target around $110-$112, representing a potential upside from current prices (around $103 as of late September 2025). Consistent positive revisions to these targets would signal strong confidence.

    Overall, Walmart appears to be executing a clear strategy to maintain its retail leadership by embracing digital transformation, diversifying its revenue streams, and leveraging its scale and pricing power, while proactively addressing operational challenges and evolving consumer demands.


    This content is intended for informational purposes only and is not financial advice

  • Take-Two Interactive Software, Inc. (NASDAQ: TTWO): A Deep Dive into the Interactive Entertainment Behemoth

    Take-Two Interactive Software, Inc. (NASDAQ: TTWO): A Deep Dive into the Interactive Entertainment Behemoth

    Take-Two Interactive Software, Inc. (NASDAQ: TTWO) stands as a prominent American video game holding company, a global leader in the development, publishing, and marketing of interactive entertainment. Headquartered in New York City, Take-Two has cultivated an impressive portfolio of critically acclaimed and commercially successful franchises through its primary publishing labels: Rockstar Games, 2K, and Zynga. As of October 1, 2025, the company is squarely in the spotlight, driven by a confluence of strategic acquisitions, robust financial performance, and the immense anticipation surrounding its upcoming blockbuster releases, particularly Grand Theft Auto VI.

    The company's relevance in the current market is underscored by its strategic positioning and recent developments. While the highly anticipated Grand Theft Auto VI has seen its release shifted to May 2026, investor and consumer excitement remains exceptionally high, with expectations for the title to set new sales records. Take-Two's strong fiscal first-quarter 2026 results, surpassing analyst expectations, further fuel positive sentiment. Moreover, strategic expansions in both mobile gaming (via Zynga) and core immersive offerings (through the acquisition of Gearbox Software), coupled with a robust pipeline of new releases like Borderlands 4 and NBA 2K26, solidify its market position. A significant industry shift, the recent privatization of Electronic Arts (EA) on September 30, 2025, has elevated Take-Two to the status of the largest independent video game publisher, further amplifying its influence and stability in a consolidating sector.

    2. Historical Background

    Take-Two Interactive's journey from a nascent publishing company to a global interactive entertainment powerhouse is a testament to strategic foresight, aggressive acquisitions, and an unwavering focus on iconic game development.

    The company was founded on September 30, 1993, in New York City by Ryan Brant. At just 21, Brant, leveraging a background in publishing and an education from the Wharton School, recognized the burgeoning potential of the video game market. With initial funding of approximately $1.5 million from family and private investors, Take-Two Interactive Software was incorporated, signaling its dedication to interactive entertainment.

    Early milestones quickly established Take-Two's footprint. In June 1994, the acquisition of InterOptica brought Catherine Winchester (later Heald) as the company's first president. A pivotal four-year licensing agreement with Sony in March 1995 allowed Take-Two to develop games for the then-nascent PlayStation console. Further expansion came in September 1996 with the acquisition of Mission Studios Corporation, a flight simulation developer. To fuel this growth, Ryan Brant took the company public, completing Take-Two's Initial Public Offering (IPO) on April 15, 1997, on the NASDAQ (TTWO), raising nearly $6.5 million.

    The most transformative early event was the 1998 acquisition of BMG Interactive, which notably included the rights to the groundbreaking Grand Theft Auto series. This acquisition led to the formation of Rockstar Games, a publishing label that would become synonymous with creative autonomy and blockbuster titles. By August 1998, Take-Two strengthened its distribution by acquiring Jack of All Games. The release of Grand Theft Auto 2 in 1999 further cemented its trajectory, with revenues exceeding $1 billion by 2003.

    Over time, Take-Two underwent several key transformations:

    • Emergence of Major Publishing Labels: Following Rockstar Games' success, Take-Two established 2K in 2005 after acquiring Visual Concepts (creators of NBA 2K) and Firaxis Games (developers of Civilization, whose rights were acquired in 2004). Rockstar Games and 2K became the dual pillars of the company.
    • Iconic Game Releases and Franchise Development: The Grand Theft Auto series, especially GTA III (2001) and GTA V (2013), revolutionized open-world gaming and generated billions in revenue. Other major franchises like Red Dead Redemption and BioShock further solidified its reputation.
    • Leadership Evolution: Ryan Brant stepped down as CEO in 2001. By late 2024, Strauss Zelnick served as Chairman and CEO, guiding the company with Karl Slatoff (President) and Lainie Goldstein (CFO).
    • Shift to Digital Distribution and Recurrent Consumer Spending: Take-Two strategically embraced digital distribution and in-game monetization, with Grand Theft Auto Online becoming a prime example of sustained recurrent consumer spending.
    • Major Expansion into Mobile Gaming: A significant pivot in the 2010s and 2020s saw Take-Two aggressively enter the mobile market through acquisitions like Socialpoint (2017), Playdots (2020), Nordeus (2021), and most notably, Zynga in January 2022 for $12.7 billion. This dramatically diversified its revenue streams.
    • Strategic Initiatives and Recent Acquisitions: While the Private Division label (formed in 2017) was later sold in 2024, Take-Two continued its acquisition spree, including mobile game subscription service GameClub (March 2023) and, significantly, The Gearbox Entertainment Company (March 2024) for $460 million, bringing the Borderlands series fully into its portfolio.

    Take-Two's history is a clear narrative of strategic growth, adapting to market shifts, and a relentless pursuit of compelling interactive entertainment.

    3. Business Model

    Take-Two Interactive Software, Inc. (NASDAQ: TTWO) operates a diversified and robust business model, primarily focused on the development, publishing, and marketing of video games. As of October 1, 2025, its strategy is deeply rooted in leveraging its iconic intellectual properties across multiple platforms, with a significant emphasis on recurrent consumer spending and a rapidly expanding mobile gaming segment.

    Revenue Sources

    Take-Two's revenue streams are multifaceted, driven by both traditional game sales and ongoing consumer engagement. For fiscal year 2025, the company projects net bookings between $5.55 billion and $5.65 billion. Key revenue sources include:

    • Full Game Sales: Initial purchases of games across console, PC, and mobile platforms.
    • Recurrent Consumer Spending (RCS): This is a substantial and growing component, encompassing virtual currency, add-on content (DLC), in-game purchases, in-game advertising, and premium subscriptions. For fiscal year 2025, RCS is expected to account for approximately 78% of net bookings, demonstrating its critical importance. This figure has seen consistent growth, rising 8% and accounting for 80% of total GAAP net revenue in Q2 Fiscal Year 2025.
    • Digital Sales: A significant majority of revenue, with nearly all revenue (96%) coming from digital sales in Q3 Fiscal Year 2025, totaling $1.31 billion.
    • Licensing Fees and Merchandise: These also contribute to overall net bookings.
    • In-Game Advertising: Particularly prevalent in the mobile segment, contributing to recurrent consumer spending.
    • Subscriptions: Services like GTA+ have shown strong growth, with membership increasing by 35% year-over-year as of Q2 Fiscal Year 2025. NBA 2K also sees significant recurrent spending.

    Product Lines

    Take-Two boasts a powerful portfolio of intellectual properties (IPs) developed and published through its major labels: Rockstar Games, 2K, and Zynga.

    Major Franchises and Contributing Titles (as of late 2024 / early 2025 and projections):

    • Rockstar Games:
      • Grand Theft Auto (GTA) series: Grand Theft Auto V has sold over 205 million units worldwide, and Grand Theft Auto Online remains a significant contributor to recurrent consumer spending. The highly anticipated Grand Theft Auto VI is slated for release in May 2026 on PS5 and Xbox Series X|S, expected to be a major revenue driver in fiscal years 2026 and 2027. The entire GTA series has sold over 440 million copies.
      • Red Dead Redemption series: Red Dead Redemption 2 has sold over 70 million copies, and its online component, Red Dead Online, contributes to recurrent consumer spending. Red Dead Redemption and Undead Nightmare were released on PC in October 2024.
    • 2K:
      • NBA 2K series: NBA 2K25 and NBA 2K24 are consistently among the largest contributors to net revenue and recurrent consumer spending. NBA 2K25 was released in September 2024. The NBA 2K League is also a professional esports organization in which Take-Two holds a 50% ownership stake.
      • WWE 2K series: WWE 2K25 is listed as an upcoming title for Q4 Fiscal Year 2025.
      • Sid Meier's Civilization series: Civilization VII is planned for release on February 11, 2025.
      • Borderlands series: Borderlands 4 was released on September 12, 2025. The franchise has sold over 94 million units, with Borderlands 3 being 2K's fastest-selling title.
      • Mafia series: Mafia: The Old Country is expected for release in Summer 2025.
    • Zynga (Mobile Games): Acquired in 2022, Zynga significantly boosted Take-Two's mobile presence and recurrent revenue. Mobile gaming accounted for 54% of Take-Two's revenue in Q3 Fiscal Year 2025.
      • Key titles contributing to recurrent consumer spending include: Toon Blast, Match Factory!, Empires & Puzzles, Words With Friends, Merge Dragons!, and a hyper-casual mobile portfolio. Zynga's Top Troops and Match Factory! have already proven successful.
    • Other notable franchises in Take-Two's portfolio include BioShock, Max Payne, Midnight Club, PGA Tour 2K, and XCOM.

    Services

    Take-Two provides a range of services to its customers, facilitating access and ongoing engagement with its games:

    • Digital Distribution: Games are delivered through digital download and online platforms across consoles (PlayStation, Xbox, Nintendo Switch), PC, and mobile (smartphones and tablets).
    • Online Platforms: Dedicated online components for major franchises, such as Grand Theft Auto Online and Red Dead Online, offering multiplayer experiences and continuous content updates.
    • Cloud Streaming Services: The company utilizes cloud streaming services for game delivery.
    • Subscription Services: GTA+ is a premium membership service offering benefits and access to games.

    Segments

    Take-Two primarily segments its business by platform, reflecting the distinct market dynamics and consumer behaviors associated with each:

    • Mobile Gaming: This segment, heavily influenced by the Zynga acquisition, is the largest contributor to Take-Two's revenue. It accounted for 54% of revenue in Q3 Fiscal Year 2025. This segment is less cyclical than console/PC games and offers consistent engagement.
    • Console Gaming: A strong segment driven by titles from Rockstar Games and 2K. It contributed 37% of revenue in Q3 Fiscal Year 2025.
    • PC and Other Platforms: This segment accounts for the remaining portion of revenue, making up 9% in Q3 Fiscal Year 2025.

    The acquisition of Zynga in 2022 was a strategic move to significantly increase Take-Two's mobile bookings from approximately 10% to about 50% of total bookings, and recurrent customer spending from about 65% to about 80% of total recurrent customer spending.

    Customer Base

    Take-Two Interactive primarily operates on a business-to-consumer (B2C) model, targeting a broad yet distinct global audience.

    • Core Demographics: The primary customer demographic for console and PC gaming is largely concentrated in the 18-35 age bracket, a group traditionally associated with higher disposable income for entertainment. These customers are typically interested in immersive storytelling, competitive multiplayer experiences, and high-quality graphics.
    • Mobile Gaming Demographics: With the acquisition of Zynga, Take-Two has expanded its reach to a broader, often younger audience for its mobile titles, where in-app purchases are common.
    • Geographical Reach: North America and Europe continue to be the largest contributors to sales for console and PC games. The focus on mobile gaming is crucial for growth in Asia and other developing markets.
    • Customer Preferences: Take-Two's diverse portfolio caters to a wide spectrum of tastes, including action-adventure, sports simulations, and strategy games, allowing them to attract various segments of gamers based on platform preference (console, PC, and mobile).

    4. Stock Performance Overview

    Take-Two Interactive Software, Inc. (NASDAQ: TTWO) has demonstrated robust stock performance over the past decade, marked by significant growth driven primarily by its tentpole franchises and strategic acquisitions. As of October 1, 2025, the company's stock has shown substantial returns across the 1-year, 5-year, and 10-year periods, with some notable fluctuations tied to game releases and market trends.

    1-Year Stock Performance (October 1, 2024 – October 1, 2025)

    In the last year, Take-Two Interactive's stock has experienced a strong upward trend. The 12-month total return as of September 30, 2025, stands at approximately 68.08%. Other sources indicate a 71.75% rise over the last 12 months, and a 61.59% increase as of September 27, 2025. Specifically, between September 10, 2024, and September 10, 2025, the share price jumped from $154.85 to $247.86, delivering a total return of about 60.1%. The stock hit an all-time high of $255.64 on September 26, 2025, and reached $259.96 on September 29, 2025. The 52-week low was $146.76, while the 52-week high reached $261.47.

    Notable Moves and Key Drivers (1-Year):

    • Anticipation of Grand Theft Auto VI (GTA VI): Despite a delay in its official release from an anticipated 2025 window to May 2026, the immense hype surrounding GTA VI has been a significant driver of investor optimism throughout this period. Early 2025 saw a 14.54% surge on February 7, 2025, following better-than-expected Q3 2025 earnings and the confirmation that a key game (initially thought to be GTA VI) was on track for fall release.
    • Strong Financial Results: Take-Two reported robust first-quarter results for fiscal year 2026, with net revenue up 12% year-over-year and net bookings increasing by 17%, significantly exceeding analyst expectations. Earnings per share for the quarter also topped estimates.
    • Key Game Releases: Contributions from titles like NBA 2K (including NBA 2K25 and NBA 2K26) and WWE 2K25 also bolstered performance. The September 2025 release of Borderlands 4 also contributed to positive sentiment.
    • Acquisition of Gearbox Entertainment: The acquisition of Gearbox Entertainment Company, developer of the Borderlands franchise, for $460 million was announced in March 2024 and expected to close in Q1 FY2025. This expanded Take-Two's intellectual property portfolio and future pipeline.
    • Analyst Upgrades: Multiple research firms raised their price targets and reiterated "buy" or "outperform" ratings for TTWO, reflecting confidence in the company's future prospects.

    5-Year Stock Performance (October 1, 2020 – October 1, 2025)

    Over the past five years, Take-Two Interactive's stock has yielded a total return of 56.37%, with a 5-year average annual return (CAGR) of 9.57%. TradingView also reports a 5-year change of 57.75%.

    Notable Moves and Key Drivers (5-Year):

    • Pandemic-Era Gaming Boom: The initial period of this five-year window (2020) saw a significant surge in gaming demand due to the pandemic, reflected in TTWO's 70.21% performance in 2020.
    • Zynga Acquisition: In May 2022, Take-Two completed its acquisition of mobile game developer Zynga, a strategic move to diversify its portfolio into the rapidly growing mobile gaming market. This acquisition, while weighing on margins in the short term, was intended to broaden the revenue base.
    • Fluctuations and Market Corrections: While 2020 was strong, 2021 saw an 11.95% decline and 2022 experienced a significant drop of 41.70%. This could be attributed to a normalization of gaming demand post-pandemic and broader market corrections.
    • Sustained Franchise Performance: Ongoing success of established franchises like Grand Theft Auto V (which has sold over 215 million copies in 12 years) and the NBA 2K series provided a consistent revenue stream.
    • Increased R&D and Pipeline Development: Take-Two has continually invested in research and development, and increased its headcount to support the development of multiple new releases beyond GTA VI, aiming for a broader and more consistent content pipeline.

    10-Year Stock Performance (October 1, 2015 – October 1, 2025)

    Looking back a decade, Take-Two Interactive has delivered exceptional returns. The 10-year total return is approximately 799.27%, with a compounded annual growth rate (CAGR) of 23.94%. Another measure shows a 10-year price total return of 743.9%. This demonstrates a substantial long-term growth trajectory for the company.

    Notable Moves and Key Drivers (10-Year):

    • Dominance of Flagship Titles: The sustained success and continued sales of franchises like Grand Theft Auto, particularly GTA V and GTA Online, along with the Red Dead Redemption series and NBA 2K, have been paramount to Take-Two's long-term growth.
    • Recurrent Consumer Spending: The company has seen consistent growth in recurrent consumer spending (in-game purchases, virtual currency, etc.) over the last decade, significantly improving its profitability and driving stock price appreciation.
    • Strategic Growth Periods: Several years within this decade stand out for exceptional performance, including 2017 (+123.04%), 2014 (+59.90%), 2020 (+70.21%), and 2023 (+56.10%). These surges often coincided with major game announcements, releases, or strong financial reports.
    • Industry Expansion: The overall growth of the video game industry, including the rise of esports and digital distribution, has provided a favorable environment for Take-Two's expansion.
    • Strategic Investments and Diversification: Investments in studios and intellectual properties, as well as the eventual acquisition of Zynga, reflect a long-term strategy to expand market reach and diversify revenue streams, moving beyond sole reliance on blockbuster single-title releases.

    5. Financial Performance

    As of October 1, 2025, Take-Two Interactive Software, Inc. (NASDAQ: TTWO) has released its financial results for the first quarter of fiscal year 2026 (Q1 FY26), which ended on June 30, 2025, providing insights into its latest financial performance, revenue growth, margins, debt, cash flow, and valuation metrics. The company reported a narrower net loss and increased revenues, exceeding analyst expectations for the quarter.

    Latest Earnings (Q1 FY26, ended June 30, 2025):

    • Net Loss: Take-Two reported a GAAP net loss of $11.9 million, or $0.07 per share, for Q1 FY26. This is a significant improvement compared to a net loss of $262.0 million, or $1.52 per share, in the prior-year quarter.
    • Adjusted Earnings Per Share (EPS): On an adjusted basis, the company delivered $0.61 EPS, considerably surpassing the estimated $0.28.
    • Net Bookings: Net bookings for the first quarter grew 17% year-over-year to $1.42 billion, exceeding the company's guidance range and analyst expectations of $1.3 billion.
    • Revenue (GAAP Net Revenue): GAAP net revenue increased to $1.50 billion, up from $1.34 billion in the corresponding quarter last year, beating analysts' forecasts of $1.31 billion.
    • Recurrent Consumer Spending (RCS): Recurrent consumer spending, a significant driver, increased 17% and accounted for 83% of total net bookings. It also increased 14% and accounted for 84% of total GAAP net revenue. Major contributors included NBA 2K25, Grand Theft Auto V and Grand Theft Auto Online, Toon Blast™, and Match Factory!™.

    Revenue Growth:

    • Quarterly Growth: Q1 FY26 GAAP net revenue saw a 12% increase year-over-year.
    • Trailing Twelve Months (TTM): For the twelve months ending June 30, 2025, Take-Two's revenue was $5.80 billion, representing a 7.33% increase year-over-year.
    • Fiscal Year 2025 (Ended March 31, 2025) Annual Revenue: The company reported annual revenue of $5.63 billion, reflecting a 5.31% growth compared to the previous fiscal year.
    • Outlook: Take-Two raised its fiscal year 2026 net bookings outlook to a range of $6.05 billion to $6.15 billion, indicating confidence in future performance, partly due to anticipated releases like Grand Theft Auto VI in Fiscal 2027.

    Margins:

    • Gross Margin: For the quarter ending June 30, 2025, the gross margin was 55.79%. The latest twelve months gross profit margin is 59.50%.
    • Operating Margin: The operating margin as of September 2025 (TTM) was -79.72%, while the reported operating income for Q1 FY26 was $22 million, leading to an operating profit margin of 1.44%. The operating expenses for Q1 FY26 decreased by 3% to $923 million.
    • Net Profit Margin: The net profit margin for the quarter ending June 30, 2025, was -72.91%. The trailing twelve months net margin was -72.92%.

    Debt and Cash Flow:

    • Total Debt: Take-Two Interactive Software has total debt of $3.1 billion.
    • Debt-to-Equity Ratio: The debt-to-equity ratio is 88.1% for the latest reported period, which is considered satisfactory, although it has increased from 0% over the past five years. Another source reports a debt-to-equity ratio of 0.72.
    • Cash and Equivalents: The company holds approximately $2.0 billion in cash and short-term investments.
    • Cash-to-Debt Ratio: As of March 2025, Take-Two's cash-to-debt ratio was 0.36, indicating that the company cannot pay off its debt using only its cash in hand.
    • Operating Cash Flow: Operating cash flow is expected to be approximately $130 million for the fiscal year 2026.
    • Free Cash Flow (TTM): The trailing twelve months free cash flow was -$58.3 million. Take-Two has sufficient cash runway for more than 3 years based on its current free cash flow.

    Valuation Metrics:

    • Market Capitalization: The market capitalization is approximately $47.95 billion to $47.43 billion.
    • Enterprise Value: The enterprise value is around $49.37 billion to $49.43 billion.
    • Price/Earnings (P/E) Ratio: Due to recent losses, the trailing P/E ratio is negative or not applicable. The forward P/E ratio for FY26 is estimated at 90.54, with expectations to decrease to 29.13 in FY27 and 25.18 in FY28.
    • Price/Sales (P/S) Ratio: The trailing P/S ratio is approximately 7.84 to 8.3x, which is considered expensive compared to the US Entertainment industry average of 1.8x and a fair P/S ratio of 5x.
    • PEG Ratio: The Price-to-Earnings-Growth (PEG) ratio is reported as 5.43 or -1.85.

    Overall, Take-Two Interactive Software Inc. demonstrated strong performance in Q1 FY26, with net bookings and revenue exceeding expectations and a significantly narrowed net loss. The company's focus on recurrent consumer spending, particularly from franchises like NBA 2K and Grand Theft Auto, continues to drive growth. Management has raised its fiscal year 2026 net bookings outlook, expressing confidence in its ambitious pipeline, including the upcoming Grand Theft Auto VI release in fiscal year 2027, which is expected to establish a new baseline for the business and enhance profitability. While the company is currently unprofitable on a GAAP basis, the improvements in net loss and positive adjusted EPS indicate progress. Valuation metrics like the P/S ratio suggest the stock is trading at a premium, reflecting investor optimism for future growth.

    6. Leadership and Management

    Take-Two Interactive Software, Inc. (NASDAQ: TTWO) has maintained a strong leadership structure and a clear strategic vision as of October 1, 2025, with a focus on leveraging its iconic franchises, expanding into mobile gaming, and driving recurrent consumer spending. The company's governance reputation appears stable, with shareholders affirming executive compensation and board composition.

    CEO: Strauss Zelnick

    Strauss Zelnick serves as the Chairman and Chief Executive Officer of Take-Two Interactive, a role he has held as CEO since January 2011, and Chairman since March 2007. Zelnick's leadership is characterized by a strategic vision aimed at positioning Take-Two at the forefront of the evolving entertainment industry. He is credited with fostering a corporate culture that emphasizes diversity, inclusivity, and respect, and is driven by the mission to be the most innovative, creative, and efficient entertainment company globally.

    Under Zelnick's tenure, Take-Two has delivered strong financial results, with net bookings for Q3 Fiscal Year 2025 reported at $1.37 billion, within guidance, and Q1 Fiscal Year 2026 net bookings at $1.423 billion, surpassing estimates. The company anticipates record net bookings in fiscal years 2026 and 2027, largely driven by major upcoming releases. Zelnick's total compensation for 2025 was reported as $106,457, which is noted to be below the average for CEOs of similar-sized companies in the US market. He also engaged in a sale of 20,000 shares of company stock in August 2025.

    Leadership Team

    Take-Two's executive leadership team, led by Zelnick, includes key individuals vital to the company's operations and strategic execution:

    • Karl Slatoff: President
    • Lainie Goldstein: Chief Financial Officer (CFO) and Principal Accounting Officer
    • Daniel P. Emerson: Executive Vice President and Chief Legal Officer

    In 2025, Lainie Goldstein received a total compensation of $11.35 million, an 11.41% increase from the previous year, while Daniel Emerson received $8.03 million, up 11.88% from 2024. Karl Slatoff's reported total compensation for 2025 was $1.00. The management team is experienced, with an average tenure of 12.3 years. Comparably, employees rate Take-Two's executive team with a "B," placing them in the top 30% of similar-sized companies.

    Board of Directors

    As of October 1, 2025, Take-Two Interactive's Board of Directors consists of ten members. Shareholders re-elected all nominated directors for a term expiring at the 2025 annual meeting during a virtual meeting on September 18, 2024. The board is characterized by its diversity in skills and experiences, with eight independent, outside directors.

    The current board members include:

    • Strauss Zelnick (Chairman and CEO)
    • LaVerne Srinivasan (Lead Independent Director)
    • Michael Dornemann (Director)
    • William "Bing" Gordon (Director)
    • Roland Hernandez (Director)
    • J Moses (Director)
    • Michael Sheresky (Director)
    • Ellen Siminoff (Director)
    • Susan Tolson (Director)
    • Paul Viera (Director)

    The board's average tenure is 10 years, indicating an experienced and stable oversight body.

    Strategy

    Take-Two's growth strategy for 2025 and beyond is multi-faceted, emphasizing expansion, diversification, and innovation within the video game industry. Key elements of this strategy include:

    • Mobile Gaming Expansion: Leveraging its acquisition of Zynga, Take-Two aims to expand its reach in mobile gaming by launching new mobile titles based on existing intellectual properties and developing original mobile experiences. Recent successes include "Match Factory" and "Color Block Jam" from its studios.
    • Core Console and PC Offerings: The company is committed to a robust product pipeline with highly anticipated titles from established franchises. This includes major releases like Grand Theft Auto VI (expected in May 2026), Mafia: The Old Country (Summer 2025), Borderlands 4 (September 2025), and Sid Meier's Civilization VII (February 2025). Grand Theft Auto VI is projected to be a significant revenue driver and a transformative title. The company acknowledges the increasing importance of PC as a platform for AAA titles.
    • Recurrent Consumer Spending (RCS): Take-Two prioritizes increasing RCS through virtual currency, add-on content, and in-game purchases. This strategy has proven effective in titles like Grand Theft Auto Online, with engagement benefiting from new content packs, and NBA 2K, which saw recurrent consumer spending up over 30% in Q3 2025.
    • Cost Management and Efficiency: The company has implemented cost-cutting measures, including a $165 million annual cost reduction program, to enhance profitability. Zelnick emphasizes a three-part strategy: "be the most creative, be the most innovative, be the most efficient."
    • Strategic Acquisitions and Partnerships: Take-Two utilizes strategic acquisitions, such as Zynga, and strong third-party partnerships to bolster its market position. The company also invests significantly in research and development (R&D) to push boundaries in game development and stay competitive.

    The company projects net revenue for fiscal year 2025 to be between $5.55 billion and $5.65 billion. Take-Two's stock performance has been strong, hitting an all-time high of $255.64 in September 2025, driven by successful releases and strategic initiatives.

    Governance Reputation

    Take-Two's governance reputation appears solid. In its virtual annual meeting on September 18, 2024, shareholders re-elected all nominated directors and approved the compensation of named executive officers in an advisory capacity, with significant support for the existing pay structure. This indicates shareholder confidence in the company's leadership and compensation practices.

    Effective September 1, 2025, Take-Two adopted a new deferred compensation plan for key employees and directors, allowing them to defer portions of their compensation. This plan could be seen as a mechanism to further align executive interests with long-term company performance. While the CEO's compensation is lower than the market average for comparable companies, the overall executive compensation packages have generally increased in 2025 for other key executives. There is no publicly available information in the provided snippets indicating significant governance controversies or negative shareholder sentiment regarding the board or executive team as of October 2025. The company's commitment to a diverse and inclusive corporate culture, as articulated by Zelnick, also contributes positively to its overall reputation.

    7. Products, Services, and Innovations

    Take-Two Interactive Software, Inc. (NASDAQ: TTWO) continues to be a prominent force in the interactive entertainment industry as of October 1, 2025, driven by a diverse portfolio of products, strategic innovation, substantial R&D investments, a robust patent library, and key competitive advantages.

    Current Offerings

    Take-Two Interactive operates primarily through three major publishing labels: Rockstar Games, 2K, and Zynga, which collectively offer a wide array of interactive entertainment across console, PC, and mobile platforms.

    Rockstar Games is renowned for its critically acclaimed and commercially successful action/adventure franchises, including:

    • Grand Theft Auto series (with Grand Theft Auto V having sold over 205 million units worldwide, and Grand Theft Auto Online being a significant contributor to recurrent consumer spending)
    • Red Dead Redemption series (Red Dead Redemption 2 being the best-selling title in the US over the past seven years based on dollar sales)
    • Max Payne series
    • Midnight Club series
    • L.A. Noire

    2K publishes a diverse range of genres, including sports simulations, strategy games, and action titles:

    • NBA 2K series (NBA 2K25 and NBA 2K24 are among the largest contributors to net bookings)
    • PGA Tour 2K series
    • WWE 2K series
    • Sid Meier's Civilization series
    • Borderlands series (Borderlands 3 is 2K's fastest-selling title)
    • Mafia series
    • XCOM series
    • BioShock series

    Zynga significantly bolsters Take-Two's presence in the mobile gaming market with popular titles such as:

    • Toon Blast
    • Match Factory!
    • Empires & Puzzles
    • Words With Friends
    • Merge Dragons!
    • FarmVille 3
    • Game of Thrones: Legends
    • CSR Racing 3
    • Top Troops
    • Zynga Poker
      Take-Two's mobile portfolio also includes various hyper-casual mobile games.

    Ghost Story Games, a studio formed from the former Irrational Games, is also part of Take-Two's offerings. Take-Two Interactive sold its Private Division label in 2024.

    Innovation Pipelines and R&D Efforts

    Take-Two Interactive demonstrates a strong commitment to product innovation and research and development (R&D) to maintain its competitive edge and deliver immersive gameplay experiences. The company's annual R&D expenses for 2025 were projected to be $1.005 billion, a 6.01% increase from 2024, reflecting sustained investment in development processes. This commitment is further evidenced by an expanding development staff headcount to support its robust pipeline.

    Key titles in the innovation pipeline as of October 2025 include:

    • Grand Theft Auto VI: Set for release in May 2026 on PS5 and Xbox Series X|S, with a second trailer released in May 2025.
    • Sid Meier's Civilization VII: Scheduled for release on February 11, 2025, across PS5, PS4, Xbox Series X|S, Xbox One, PC, and Switch.
    • WWE 2K25: Expected in Q4 Fiscal 2025.
    • Borderlands 4: Planned for Fiscal 2026 release on PS5, Xbox Series X|S, and PC.
    • Mafia: The Old Country: Also slated for Fiscal 2026 release on PS5, Xbox Series X|S, and PC.
    • Judas (from Ghost Story Games): Release date is yet to be announced.
    • CSR Racing 3 (Zynga): Release date is yet to be announced.
    • Top Spin 2K25

    Mobile titles like Game of Thrones: Legends launched in 2024 and Star Wars Hunters were also slated for 2024. Take-Two aims to continue pursuing emerging opportunities, geographies, and new businesses, with a focus on M&A to enhance growth potential.

    Patents

    Take-Two Interactive holds a significant patent portfolio, with a total of 47 global patents, of which 39 are active, belonging to 26 unique patent families. These patents highlight their technological advancements in core game development areas:

    • Improved Rendering of Computer Graphic Models: A patent granted in May 2024 describes systems and methods for using continuous levels of detail (CLODs) to generate distinct and interpolated LODs for enhanced visual fidelity.
    • Virtual Character Animation using Motion Capture: A patent granted in April 2024 details a system and method for efficient in-game character animation using motion capture, including machine learning models to predict highly probable hand poses from multiple sensor inputs, overcoming the imprecision of conventional optical marker pipelines for finger movement.
    • Image Capture and Modeling: A patent granted in December 2019 focuses on capturing a player's likeness for in-game models at runtime, encompassing geometry and texture.
    • Game Object and Environment Generation: A patent from October 2019 describes a system and method for building and rendering in-game objects using metadata records and property tags.
    • Anti-Cheating Technologies: Take-Two has also patented a system and method for preventing cheating in video games by obfuscating game logic and variables during compilation.
    • Session Management and Pathfinding: Other patents cover seamless merging and splitting of network sessions in multiplayer environments and managing/pathfinding using a coarse graph of low-level nodes in virtual worlds.

    These patents underscore Take-Two's investment in foundational technologies that enhance graphics, animation, and overall player experience.

    Competitive Edge

    Take-Two Interactive's competitive edge is multifaceted, stemming from its strategic acquisitions, robust intellectual property, and a forward-looking approach to market trends:

    • Strong Portfolio of Owned Intellectual Property (IP): Take-Two boasts some of the most successful, iconic, and critically acclaimed brands in entertainment, including Grand Theft Auto, Red Dead Redemption, NBA 2K, and Civilization. This strong IP base ensures a loyal player community and consistent revenue streams.
    • Diversified Offerings and Market Reach: The company's strategy involves delivering hit entertainment experiences on every relevant platform. Through Rockstar Games and 2K, they dominate console and PC markets, while the acquisition of Zynga (January 2022 for $12.7 billion) significantly expanded their mobile gaming footprint, providing a presence in a rapidly growing segment.
    • Consistent Innovation and R&D Investment: Take-Two's continuous investment in R&D and product innovation allows them to push the boundaries of game development, offering high-quality, immersive gameplay experiences and staying at the forefront of the industry. This is crucial for attracting and retaining players in a dynamic market.
    • Strategic Acquisitions: Take-Two has a track record of strategic acquisitions that bolster its development capabilities and market presence. Recent examples include Gearbox Software (March 2024), Dynamixyz (July 2021), Nordeus (June 2021), and GameClub (March 2023). These acquisitions bring in new talent, technologies, and popular franchises.
    • High Recurrent Consumer Spending (RCS): A substantial portion of Take-Two's net bookings comes from recurrent consumer spending (e.g., in-game purchases, subscriptions like GTA+). In fiscal Q2 2025, RCS accounted for 81% of total net bookings, indicating strong player engagement and effective monetization strategies post-purchase.
    • Global Development and Sales Network: With development studios across Australia, Canada, China, Czech Republic, Hungary, India, Spain, the UK, and the US, and sales conducted globally through various channels, Take-Two has a broad international presence.
    • Strong Pipeline of Upcoming Titles: The anticipation surrounding major upcoming releases like Grand Theft Auto VI, Borderlands 4, and Civilization VII provides significant future growth potential and strengthens their market position.
    • Financial Strength: Despite challenges, Take-Two maintains a market capitalization of approximately $47.66 billion as of October 1, 2025, and has demonstrated strong revenue growth, outperforming the S&P 500 in one-year performance. This financial stability allows for continued investment in growth and innovation.

    8. Competitive Landscape

    Take-Two Interactive Software, Inc. (NASDAQ: TTWO) operates within a dynamic and highly competitive interactive entertainment industry. As of October 1, 2025, the company faces significant rivals and navigates a complex market landscape characterized by the dominance of key franchises, growing digital revenue, and challenges in specific segments like mobile gaming.

    Industry Rivals

    Take-Two Interactive competes with a range of established global publishers and developers across various platforms, including console, PC, and mobile. Its primary direct competitors include:

    • Electronic Arts (EA): A major publisher known for sports franchises (FIFA, Madden NFL) and other popular titles.
    • Microsoft Gaming: Especially significant following its acquisition of Activision Blizzard, encompassing the Xbox ecosystem and major franchises like Call of Duty.
    • Sony Interactive Entertainment: A dominant force in the console market with PlayStation and its exclusive titles.
    • Nintendo: A key player in console gaming with iconic franchises like Super Mario and The Legend of Zelda.
    • Tencent: The world's largest video game company by revenue, with significant global influence and a vast portfolio across genres and platforms, particularly strong in mobile and social connectivity.
    • NetEase: Another major Chinese publisher with a strong presence in PC and mobile gaming.
    • Ubisoft: Known for franchises such as Assassin's Creed and Far Cry.
    • Roblox Corporation: A prominent competitor in the user-generated content and metaverse space.
    • Epic Games: Developer of the highly popular Fortnite.
    • Nexon, Bandai Namco, Capcom, and MiHoYo: Other significant global publishers and developers.

    In the mobile gaming sector, Take-Two's Zynga subsidiary competes with companies like Tripledot and Jam City, among many others.

    Market Share

    While precise real-time market share percentages for October 2025 are not available, several indicators provide insight into Take-Two's position:

    • Overall Market Standing: Take-Two Interactive's market capitalization was estimated at US$41 billion as of April 2025, making it one of the largest publicly traded game companies globally. It had a market cap of $41.2 billion in May 2025 and $41.7 billion as of July 28, 2025. It is considered the second-biggest esports company by market capitalization, behind Tencent.
    • Revenue Ranking: In the first quarter of 2025, Take-Two Interactive ranked 8th among the top gaming companies by revenue, trailing Tencent, Microsoft, Sony, Apple, NetEase, Electronic Arts, and Google.
    • Financial Performance (Fiscal Year 2025): Take-Two reported GAAP net revenue of $5.63 billion for the full fiscal year 2025, a 5% increase over the previous year. Its trailing 12-month revenue was $5.8 billion as of June 30, 2025.
    • Digital and Mobile Contribution: Digital channels accounted for 96.4% of net revenue for the nine months ended December 31, 2024. Mobile gaming, largely driven by the Zynga acquisition, constitutes about half of Take-Two's total sales.
    • Industry Context: The global video games market was estimated at approximately $274.63 billion in 2024 and projected to reach $303.47 billion in 2025. Mobile gaming holds the largest segment share, accounting for about 49% of the total market in 2024.

    Competitive Strengths and Weaknesses

    Competitive Strengths:

    • Robust Brand Portfolio and Franchise Success: Take-Two boasts a powerful portfolio of highly successful and critically acclaimed franchises, including Grand Theft Auto, NBA 2K, and Red Dead Redemption. Grand Theft Auto V alone has sold over 210 million units worldwide. Other significant franchises include Borderlands, Civilization, BioShock, and WWE 2K. The NBA 2K franchise has shown strong performance, with a 20% year-over-year increase in daily active users and a 30% rise in recurrent consumer spending.
    • Strong Digital Revenue and Recurrent Consumer Spending (RCS): The company has successfully capitalized on the shift towards digital distribution and recurring consumer spending, with 96.4% of net revenue from digital channels for the nine months ended December 31, 2024. This digital focus drives steady revenue from in-game purchases and add-on content.
    • Prestigious Development Studios: Take-Two owns highly respected studios like Rockstar Games and 2K Games, known for consistently delivering high-quality titles.
    • Strategic Mobile Expansion: The acquisition of Zynga in 2022 significantly expanded Take-Two's presence in the growing mobile gaming market.
    • Growth in Core Segments: Take-Two maintains a strong position in console and PC gaming and demonstrated a higher revenue growth rate (13.08% as of March 31, 2025) compared to its communication services sector peers over a three-month period.

    Competitive Weaknesses:

    • High Dependence on Key Franchises: A significant portion of Take-Two's revenue is derived from a limited number of flagship titles, primarily Grand Theft Auto and NBA 2K. These two series contributed approximately 70% of the company's total game sales in fiscal year 2023. This reliance creates vulnerability to market reception and development cycles of these specific titles.
    • Vulnerability to Game Release Delays: Delays in major game releases can have a substantial financial impact. The postponement of Grand Theft Auto VI from Fall 2025 to May 26, 2026, led to a revision of fiscal year 2026 bookings estimates from $9.2 billion to $6.2 billion, highlighting this risk.
    • Underperformance in Parts of Mobile Gaming: While Zynga strengthens its mobile presence, Take-Two has faced challenges in segments like hypercasual mobile gaming, experiencing underwhelming performance and intense competition.
    • Financial Performance and Net Losses: The company has reported increasing net losses, with a net loss widening from $(91.6) million to $(125.2) million year-over-year for the nine months ended December 31, 2024, and a 12-month net loss of $4.47 billion for fiscal year 2025. Its net margin, return on equity (ROE), and return on assets (ROA) are below industry averages, indicating profitability and efficiency challenges.
    • Moderate Debt Levels and High Development Costs: Take-Two operates with a moderate level of debt, with short-term obligations exceeding liquid assets, which can add financial pressure during costly AAA title development cycles. Its debt-to-equity ratio is also higher than the industry average.

    9. Industry and Market Trends

    Take-Two Interactive Software, Inc. (NASDAQ: TTWO) operates within a dynamic and evolving interactive entertainment industry. As of October 1, 2025, the company is significantly impacted by several sector-level trends, macroeconomic drivers, and cyclical effects, all while navigating a shift towards digital distribution that mitigates traditional supply chain challenges.

    Sector-Level Trends

    The video game industry in 2025 is characterized by continued growth and significant technological and operational shifts. The global gaming market is projected to reach approximately $200 billion by year-end 2025, with some forecasts even higher at around $236.4 billion in revenue. This growth follows a period of post-pandemic market correction in 2022-2023, which saw a slowdown in growth and industry-wide layoffs due to over-expansion during the pandemic surge and rising development costs. However, analysts anticipate a rebound and steady expansion.

    Key sector-level trends impacting Take-Two include:

    • Digital Distribution and Live-Service Models: Digital distribution now accounts for approximately 95% of game sales, making physical supply chains less critical for software. This shift strongly favors live-service games and in-game purchases, which are projected to account for over 65% of all gaming revenue in 2025. Take-Two has adopted this model, with recurrent consumer spending being a significant contributor to its net revenue and net bookings, accounting for 82% of total GAAP net revenue in Q1 Fiscal Year 2025 and 79% in Fiscal Year 2025. Popular titles like Grand Theft Auto Online and NBA 2K franchises demonstrate Take-Two's success in this area.
    • Mobile Gaming Dominance: Mobile gaming continues to be the largest segment, forecasted to generate $110.99 billion in 2025 and leading innovation with hybrid-casual models and cross-platform functionality. Take-Two's T2 Mobile Games division and acquisitions like Zynga position it to capitalize on this trend, though some mobile titles have underperformed expectations.
    • Cross-Platform Play and Development: Developers are increasingly building games for cross-platform compatibility from day one, reflecting consumer expectations that progress and friend lists carry across PC, console, and mobile. This approach widens the audience and aligns with Take-Two's diverse platform strategy.
    • Technological Advancements (AI, VR/AR, Cloud Gaming): Artificial intelligence (AI) is transforming game development, from content creation to live balancing, with the global AI gaming market projected to grow significantly. Cloud gaming and subscription services are also redefining access, with cloud gaming revenue anticipated to reach US$10.46 billion in 2025. While VR/AR gaming is still in an early adopter phase, it presents future opportunities.
    • High Development Costs and "Playing it Safe": The cost of developing AAA games has climbed steeply, with titles averaging $80–$120 million, leading some studios to prioritize efficiency and focus on improving existing games rather than launching many new ones. This can lead to a "playing it safe" approach in the AAA market.

    Macro Drivers

    Several macroeconomic factors are influencing the gaming industry and Take-Two in 2025:

    • Monetary Policy and Investment: Signals of easing monetary policy by the US Federal Reserve, including lowered federal funds rates, are expected to stimulate equity markets. Lower interest rates reduce borrowing costs, encouraging M&A activity and potentially boosting valuations for publicly traded gaming companies like Take-Two, as capital becomes more accessible. Private equity interest in the gaming sector is also on the rise.
    • Economic Uncertainty and Inflation: Despite an improved longer-term outlook, gaming executives still cite economic uncertainty, inflation, and interest rate concerns as factors limiting operations. Inflation can create more cost-conscious consumers, which could benefit video games as they offer solid value for entertainment budgets compared to other options.
    • Consumer Discretionary Spending: Consumer discretionary activities are being tested by factors like tariffs on imported goods and stock market setbacks. However, gaming has proven resilient, with a widening demographic embracing interactive entertainment, creating a larger overall market.
    • Geopolitical Risks: Geopolitical risks are also a concern for gaming executives, potentially impacting global market stability and operations.

    Supply Chains

    The video game industry, including Take-Two, has largely transitioned from physical to digital distribution, significantly altering its supply chain dynamics. This shift means less reliance on manufacturing, shipping, and retail of physical game copies and more emphasis on:

    • Digital Infrastructure: Robust server infrastructure, content delivery networks (CDNs), and cloud services are crucial for distributing games, updates, and supporting online play.
    • Software Development Lifecycle: The "supply chain" for Take-Two is increasingly about the efficient and timely development, testing, and deployment of high-quality software, including core games, DLC, and live-service content. The rising costs and complexity of game development put pressure on this internal "supply chain".
    • Talent and Technology: The availability of skilled game developers, artists, and engineers, along with access to advanced development tools and technologies (like AI), forms a critical part of the production pipeline. Layoffs in the industry in recent years highlight a period of adjustment in talent allocation.

    Cyclical Effects

    The gaming industry is subject to cyclical trends, and Take-Two is currently experiencing several:

    • Post-Pandemic Correction and Rebound: Following an unsustainable surge during the COVID-19 pandemic, the industry experienced a contraction in 2022-2023, characterized by layoffs and studio closures. However, 2025 marks a period of rebound and stabilization, with developers anticipating growth.
    • Console Cycles: The release of new console generations typically drives significant software sales. While PlayStation 5 and Xbox Series X|S are established, discussions around a "Switch 2" for Nintendo in 2025 could heat up the console market and drive hardware and software sales. Take-Two's major upcoming releases are expected to be key drivers in these console cycles.
    • Major Franchise Releases: Take-Two's success is heavily tied to its tentpole franchises, such as Grand Theft Auto and NBA 2K. The highly anticipated release of Grand Theft Auto VI (GTA VI) in May 2026 (Fiscal Year 2027) is expected to be a "seismic event" for the industry, driving significant software and hardware sales, and is a major catalyst for Take-Two's expected record net bookings in Fiscal Years 2026 and 2027.
    • M&A Activity: The gaming industry has seen significant M&A activity, particularly between 2020 and 2024. As market sentiment shifts and capital becomes more accessible, M&A activity is expected to normalize and potentially increase, with cash-generative sectors like online gaming being attractive targets.

    10. Risks and Challenges

    Take-Two Interactive Software, Inc. (NASDAQ: TTWO) navigates a complex environment of risks and challenges as of October 1, 2025, stemming from its operational execution, the regulatory landscape, past and ongoing controversies, and broader market dynamics. The company's financial health and future growth are significantly tied to the performance of its flagship titles, particularly the highly anticipated Grand Theft Auto VI, and its ability to adapt to industry shifts.

    Operational Risks

    Take-Two's operational stability is largely influenced by its game development cycles, cybersecurity measures, and talent management:

    • Reliance on Blockbuster Titles and Development Delays: A core risk for Take-Two is its significant dependence on major franchises like Grand Theft Auto and Red Dead Redemption. These titles, particularly Grand Theft Auto, consistently represent a substantial portion of the company's revenue, with Grand Theft Auto products alone contributing 12.6% of net revenue for the fiscal year ended March 31, 2025, and the top five franchises accounting for 53.1%. The success of these titles is paramount, and any production delays or failure to meet the extremely high sales expectations can lead to substantial revenue shortfalls. For example, the delay of Grand Theft Auto VI from Fall 2025 to May 26, 2026, has shifted an estimated $3 billion in bookings from FY2026 to FY2027 and directly impacted the company's stock price. Such postponements can disrupt release schedules, escalate development and marketing costs, and potentially diminish consumer interest.
    • Cybersecurity Threats: Take-Two's operations rely on intricate information technology systems, making it vulnerable to cybersecurity threats. The company has experienced network intrusions, including an incident in September 2022 where confidential Grand Theft Auto development footage was illegally accessed from Rockstar Games' systems. Another event in September 2022 involved unauthorized access to credentials for a 2K Games vendor platform, leading to malicious communications sent to customers. These sophisticated attacks pose risks to intellectual property, game assets, and sensitive customer data, potentially resulting in financial losses, legal penalties, reputational damage, and loss of investor confidence. The company employs a dedicated cybersecurity team and regularly reviews its policies against industry standards.
    • Underperformance in Mobile Gaming: Despite the 2022 acquisition of Zynga aimed at strengthening its mobile market presence, Take-Two's mobile gaming segment has underperformed expectations, particularly in the hypercasual genre. The mobile market is highly competitive, characterized by rapid changes and often fickle consumer preferences, making it challenging for established console/PC developers to secure a strong foothold.
    • Talent Retention and Innovation: The competitive landscape of the gaming industry necessitates continuous innovation and the ability to attract and retain key creative and technical talent. Failure to innovate or adapt to evolving software technologies and player preferences could adversely affect Take-Two's market position and game quality.

    Regulatory Risks

    Take-Two faces increasing regulatory scrutiny and the potential for new legislation impacting its business model:

    • Data Privacy Investigations: As of early 2025, Take-Two is under investigation for a potential violation of the Video Privacy Protection Act (VPPA) related to its Borderlands website. This investigation concerns allegations of unlawful interception of legally protected data during game purchases, which could lead to legal liabilities and reputational harm. Take-Two maintains that it collects data transparently for service delivery and game environment protection, as outlined in its Privacy Policy.
    • Loot Box and Monetization Regulations: The gaming industry continues to face potential regulatory changes concerning in-game monetization, such as loot boxes. While not an immediate specific threat identified for Take-Two as of late 2025, such regulations could impact the company's recurring consumer spending, which forms a significant part of its revenue.
    • Intellectual Property (IP) Enforcement and Disputes: Take-Two actively defends its intellectual property rights, as evidenced by past DMCA strikes against Grand Theft Auto modders and ongoing lawsuits against third-party marketplaces selling hacked accounts and in-game currency. While crucial for protecting its assets and revenue streams, these actions have sometimes led to community backlash. The company's reliance on licensed IP for sports titles also exposes it to increased costs due to competition for these licenses.
    • Securities Law Investigation: In May 2025, a shareholder rights litigation firm announced an investigation into Take-Two for potential securities law violations, specifically questioning whether the company made false or misleading statements or failed to disclose material information to investors following the Grand Theft Auto VI delay announcement.

    Controversies

    Take-Two has encountered various controversies, impacting its public image and community relations:

    • Modding Community Friction: The company has faced significant criticism from its player base, particularly for its aggressive stance against Grand Theft Auto modders, including issuing DMCA strikes and pursuing legal action. Although Take-Two clarifies that its terms of service primarily prohibit "abusive mods" that confer unfair advantages or infringe on IP, these actions have historically generated negative sentiment within the modding community.
    • Trademark Enforcement: The company's rigorous trademark enforcement, such as the reported copyright strike against Hazelight Studios over the title It Takes Two, has been perceived negatively, raising concerns about its approach to smaller developers.
    • Virtual Currency Litigation: The company has been subject to lawsuits regarding its virtual currency practices, particularly in NBA 2K, where players have allegedly lost virtual currency due to server shutdowns. Take-Two has contested these class-action lawsuits.
    • Terms of Service Concerns: In June 2025, Take-Two addressed community concerns regarding its Terms of Service, specifically accusations of using "spyware." The company publicly clarified that it does not use spyware and that its data collection practices are detailed in its Privacy Policy to ensure transparency and comply with legal obligations.

    Market Risks

    Take-Two operates within a highly dynamic and competitive market, facing risks from intense competition, economic volatility, and evolving consumer behavior:

    • Intense Competition: The interactive entertainment industry is intensely competitive, with major players like Microsoft (which acquired Activision Blizzard), Electronic Arts, and numerous other publishers and emerging mobile developers vying for market share. This competitive landscape pressures Take-Two's ability to maintain its market position and profitability, especially if competitors release highly successful titles.
    • Economic Downturn and Consumer Spending: Take-Two's performance is sensitive to broader macroeconomic conditions, including fluctuations in consumer demand, inflation, and foreign exchange rates. An economic downturn could impact consumer discretionary spending on games and in-game purchases.
    • Interest Rate Fluctuations and Debt: The company has reported net losses due to rising marketing and development costs, and increased operating expenses, partly influenced by the Zynga acquisition. As of September 2024, Take-Two carries significant debt and has experienced negative free cash flow. Rising interest rates could increase the cost of debt, potentially limiting capital available for game development and straining financial health.
    • Evolving Consumer Preferences and Business Models: The gaming market is characterized by rapid technological advancements and evolving business models, such as the rise of free-to-play and subscription services. Take-Two must continuously adapt its offerings and monetization strategies to changing consumer preferences to avoid negative impacts on sales of its traditional console and PC products.
    • Stock Volatility and Valuation Concerns: The company's stock valuation is closely tied to the anticipated success and timely release of its major franchises. The significant hype surrounding Grand Theft Auto VI means that any perceived underperformance or further delays could lead to considerable stock price volatility and downward pressure. Some analyses suggest that TTWO's stock may be overvalued based on current financial metrics, indicating potential for a price correction.

    11. Opportunities and Catalysts

    Take-Two Interactive Software, Inc. (NASDAQ: TTWO) is positioned for significant growth, driven by its robust portfolio of intellectual property, strategic expansion into mobile gaming, a focus on recurring consumer spending, and a highly anticipated pipeline of new game releases. As of October 1, 2025, the company is navigating both immediate market dynamics and long-term strategic initiatives.

    Growth Levers

    Take-Two's growth strategy heavily relies on several key levers:

    • Recurrent Consumer Spending (RCS): This is a cornerstone of Take-Two's business model, consistently contributing a substantial portion of its net bookings. In the first quarter of fiscal year 2025, RCS accounted for 83% of total net bookings, highlighting its importance. The company aims to integrate "recurrent consumer spending opportunities" – including virtual currency, add-on content, in-game purchases, season passes, subscriptions, and in-game advertising – into every title moving forward. This strategy transforms traditional game sales into ongoing engagement, fostering long-term player value.
    • Blockbuster Franchises: Take-Two leverages its highly successful and critically acclaimed franchises, such as Grand Theft Auto (GTA), NBA 2K, Red Dead Redemption, Borderlands, and Civilization. Grand Theft Auto V alone has sold over 215 million copies globally, demonstrating the enduring power of its core IPs.
    • Digital Distribution: A continued shift towards digital distribution helps reduce physical production costs and enhances direct engagement with players.
    • Robust Development Pipeline: The company maintains an ambitious development pipeline, with expectations for sequential increases and record levels of net bookings in fiscal years 2026 and 2027. This pipeline is crucial for sustained growth beyond individual game cycles.
    • Artificial Intelligence (AI): In the long term, Take-Two anticipates that the adoption of AI will improve efficiency, automate coding, and reduce development costs, thereby enhancing profitability over the next decade.

    New Markets

    Take-Two has made significant strides in expanding its market reach, particularly in:

    • Mobile Gaming: The acquisition of Zynga in 2022 was a pivotal move, substantially bolstering Take-Two's mobile development, publishing, live services, and advertising capabilities. Mobile devices now generate a significant portion of the company's revenue, accounting for 54% in Q2 2024. Popular Zynga titles like Farmville, Empires & Puzzles, Toon Blast, and Match Factory! are key contributors to mobile revenue growth. This strategic diversification has reduced the company's reliance on traditional console and PC sales.
    • Cross-Platform Strategy: By strategically managing its diverse portfolio, Take-Two aims to capitalize on its intellectual property across various platforms, including consoles, PC, and mobile, fostering a loyal player base and consistent revenue streams.

    M&A Potential

    Take-Two's M&A strategy reflects a dual approach of strategic acquisitions and potential divestitures of non-core assets:

    • Strategic Acquisitions: The acquisition of Zynga was a major strategic play to significantly expand into the lucrative mobile gaming market and diversify revenue streams, effectively doubling mobile bookings and increasing recurrent consumer spending as a percentage of total RCS.
    • Divestment and Optimization: In 2024, Take-Two engaged in offloading non-core studios to streamline operations. There are also ongoing discussions regarding the potential sale of its adtech division, Chartboost, which was acquired through Zynga, indicating a strategic shift to focus on core gaming assets.
    • Future Acquisition Opportunities: The company continuously evaluates new growth opportunities, which may include future acquisitions. Any proceeds from potential share issuance could be allocated for such purposes or debt repayment. With substantial cash reserves, public gaming companies like Take-Two are well-positioned to pursue further strategic deal-making activities.

    Near-Term Events (Earnings, Launches) as of 10/1/2025

    Several key events are on the horizon that will significantly impact Take-Two's performance:

    Upcoming Earnings Reports:

    • Take-Two is estimated to release its next earnings report for the fiscal quarter ending September 2025 around November 4-5, 2025.
    • The company last reported its first-quarter fiscal year 2025 results on August 7, 2025.
    • Fourth-quarter and fiscal year 2025 results were reported on May 15, 2025. Management has reiterated expectations for record net bookings in fiscal years 2026 and 2027.

    Upcoming Game Launches:
    The period of late 2025 and into 2026 is expected to be a significant catalyst for Take-Two, with several major titles slated for release:

    • Grand Theft Auto VI (GTA VI): This highly anticipated title, initially expected in Fall 2025, has been officially confirmed for release on May 26, 2026, for PlayStation 5 and Xbox Series X/S. Rockstar Games released its second trailer in May 2025. GTA VI is expected to be a groundbreaking, blockbuster entertainment experience, projected to drive billions in revenue and significantly boost the company's financial performance in fiscal years 2026 and 2027.
    • Borderlands 4: This installment is planned for release on September 12, 2025. It is also listed among other major titles for a 2025 launch.
    • Mafia: The Old Country: This title is slated for launch in 2025, with early August being a possible release window.
    • Sid Meier's Civilization VII: Also expected to be released in 2025.
    • NBA 2K26 and WWE 2K26: These annual sports titles are expected to continue their strong performance and contribute to recurring revenue streams.

    These upcoming launches, particularly GTA VI, are expected to be major catalysts, driving significant revenue growth and potentially solidifying Take-Two's market position further into 2026 and beyond.

    12. Investor Sentiment and Analyst Coverage

    As of October 1, 2025, Take-Two Interactive Software, Inc. (NASDAQ: TTWO) exhibits a generally positive investor sentiment and robust analyst coverage, characterized by "Moderate Buy" ratings, mixed but active hedge fund and institutional investor movements, and optimistic retail chatter, largely driven by anticipation for upcoming game releases.

    Wall Street Ratings

    Wall Street analysts maintain a predominantly bullish outlook on Take-Two Interactive. The company currently holds a consensus rating of "Moderate Buy" or "Buy"/"Outperform" from a significant number of research firms.

    • Consensus Rating: Across approximately 20 to 32 analysts, the average recommendation is a "Moderate Buy." Some sources indicate a "Strong Buy" consensus from 13 analysts, while others, involving up to 50 analysts, point to a general "Buy" rating.
    • Price Targets: The consensus 12-month price target for TTWO stock ranges from approximately $248.32 to $262.02.
      • High-end estimates reach $275.00 to $285.00.
      • Low-end estimates are around $150.00 to $155.00.
    • Recent Analyst Activity: Several firms have recently updated their ratings and price objectives:
      • CICC initiated coverage in late September 2025 with an "Outperform" rating and a $272.00 price target.
      • In August 2025, Wedbush, Benchmark, JPMorgan Chase & Co., and Bank of America all increased their price targets to $275.00 or $285.00 and reiterated "Outperform" or "Buy" ratings.
      • Citigroup raised its price objective to $270.00 in July 2025 with a "Buy" rating.
      • Wells Fargo & Company initiated coverage in July 2025 with an "Overweight" rating and a $265.00 price target.
      • Zacks Research upgraded Take-Two from a "Strong Sell" to a "Hold" rating in August 2025.

    Hedge Fund Moves

    Hedge fund activity as of Q2 2025 filings (the most recent publicly available data, as Q3 2025 filings are not yet due) shows a mixed but overall active interest in Take-Two Interactive.

    • Increased Holdings:
      • Ninety One UK Ltd significantly increased its stake by 22.8% in Q2 2025, owning over 1.8 million shares.
      • D. E. Shaw & Co., Inc. made a substantial addition, boosting its portfolio by 196.1% in Q2 2025.
      • BlackRock, Inc. increased its holdings by 17.4% in Q2 2025.
      • Other firms like MassMutual Private Wealth & Trust FSB (up 5.8%), Perigon Wealth Management LLC (up 79.2%), Ballentine Partners LLC (up 7.5%), and Wealth Enhancement Advisory Services LLC (up 19.1%) also boosted their stakes.
    • Decreased Holdings:
      • Conversely, some hedge funds reduced their positions. CAPITAL INTERNATIONAL INVESTORS removed 63.6% of its shares in Q2 2025, while BALYASNY ASSET MANAGEMENT L.P. and DNB ASSET MANAGEMENT AS significantly cut their holdings by 95.6% and 94.4%, respectively. BESSEMER GROUP INC also reduced its position by 51.1%.
    • Overall Trend: In Q2 2025, 580 institutional investors added TTWO shares to their portfolios, while 337 decreased their positions, indicating a net positive accumulation by a larger number of funds.
    • Insider Activity: Recent insider transactions include sales by executives and directors. CEO Strauss Zelnick sold 20,000 shares in August, and other directors like Laverne Evans Srinivasan and Ellen F. Siminoff, along with insider Daniel P. Emerson, also sold shares in August and September 2025.

    Institutional Investors

    Institutional investors hold a dominant position in Take-Two Interactive's ownership structure. As of Q2 2025, institutional investors and hedge funds collectively own 95.46% of the company's stock.

    • Ownership Scale: There are 1,869 institutional owners who have filed 13D/G or 13F forms, holding a total of 204,797,254 shares.
    • Largest Holders: Key institutional shareholders include Vanguard Group Inc, BlackRock, Inc., Public Investment Fund, State Street Corp, JPMorgan Chase & Co, and Tiger Global Management Llc.

    Retail Chatter

    Retail investor sentiment for Take-Two Interactive is generally positive, driven significantly by anticipation for upcoming game releases, particularly Grand Theft Auto VI (GTA VI).

    • Positive Sentiment Score: Data from top investing forums indicates an overall positive sentiment, with Take-Two Interactive scoring 84 out of 100, outperforming a majority of its industry peers by ranking in the 81st percentile.
    • GTA VI Anticipation: Discussions on platforms like Reddit (r/investing) as recently as July and September 2025 reflect considerable excitement and a belief that GTA VI, slated for a Fiscal Year 2027 (May 2026) release, will be a significant catalyst for the stock. Many view it as a "sure bet" for good returns.
    • Cautious Notes: Despite the overall optimism, some retail investors express caution. Concerns include the general overvaluation of video game publishers, the potential for buggy game releases (citing past industry examples), and the impact of game delays on stock performance.
    • Key Catalysts: Strong recurrent consumer spending, growth in daily and monthly active users, and the performance of the mobile gaming segment (bolstered by Zynga) also contribute to the positive sentiment. The company's pipeline, including Borderlands 4 and NBA 2K26, further underpins a favorable outlook.

    13. Regulatory, Policy, and Geopolitical Factors

    Take-Two Interactive Software, Inc. (NASDAQ: TTWO) operates within a dynamic regulatory, policy, and geopolitical landscape that presents both significant challenges and strategic opportunities as of October 1, 2025. The company, like the broader video game industry, is navigating increasing scrutiny over data privacy, evolving content regulations, global trade tensions, and the ongoing impacts of international conflicts.

    Regulatory and Legal Factors

    1. Data Privacy Laws and Compliance:
    Take-Two Interactive is currently facing legal challenges related to data privacy. A proposed federal class-action lawsuit, filed in January 2025, alleges that the company violated the Video Privacy Protection Act (VPPA) by sharing user information, including game-playing and video-watching histories from its Borderlands website, with Meta Platforms Inc. and TikTok Inc. without user consent. This investigation highlights the increasing focus on data privacy within the gaming sector. Take-Two had not issued a public statement directly addressing the VPPA investigation as of February 28, 2025, which some analysts noted could raise concerns among investors and customers, contrasting with more proactive responses from other gaming companies in similar situations.

    Broader industry trends indicate that data privacy and security are critical concerns, with significant fines expected for violations, particularly concerning children's data, as demonstrated by a record $275 million fine under the Children's Online Privacy Protection Act (COPPA) to another gaming company in 2023. Global regulations such as the EU's General Data Protection Regulation (GDPR) and California's Consumer Privacy Act (CCPA) also impact Take-Two's operations, requiring robust privacy risk management and compliance programs.

    In March 2025, Take-Two and its subsidiary 2K Games rolled out updated Terms of Service (ToS) that drew significant backlash from the gaming community. These updates granted the companies broader control over user-generated content, player accounts, and expanded data collection policies, including the right to share user data with "business partners." Critics argue these changes are invasive and limit players' ability to take legal action due to mandatory arbitration clauses.

    2. Content and Platform Regulations:
    While specific new content regulations for Take-Two were not detailed, the video game industry globally faces ongoing scrutiny regarding game content and age ratings (e.g., ESRB, PEGI, CERO). China, a significant market, continues to impose strict measures on game content and playtime for minors, including real-name authentication systems and weekly playtime limits. Game developers could face liability if they fail to verify minors' identities, leading to unlimited access.

    3. Subscription and Digital Market Regulations:
    In 2025, heightened compliance efforts are anticipated for new subscription rules across the UK, EU, and US. These regulations require game businesses to adjust player sign-up processes to include comprehensive subscription information, implement reminders, and provide easily accessible cancellation options. The EU's Digital Markets Act (DMA) and the UK's Digital Markets, Competition and Consumers Act (DMCCA) aim to enhance competition and consumer law, potentially disrupting traditional game distribution and monetization strategies while also creating opportunities for developers to establish direct relationships with players and control monetization.

    4. Corporate Governance and Compliance Infrastructure:
    Take-Two Interactive emphasizes a commitment to conducting business ethically and complying with domestic and international laws. The company has established a robust corporate governance framework, overseen by its Board of Directors and Corporate Governance Committee, which ensures transparent reporting, accountability, and ethical decision-making. Take-Two's legal department is responsible for compliance-related issues and provides training to employees. The company publishes an annual Impact Report that details its Environmental, Social, and Governance (ESG) activities.

    5. Securities Law Violations:
    As of May and June 2025, Take-Two is subject to several investor investigations by law firms (Schall Law Firm, Pomerantz LLP, Kaplan Fox & Kilsheimer LLP) following the announcement of a delay for its highly anticipated title, Grand Theft Auto VI. Originally projected for a Fall 2025 release, the game was rescheduled for May 26, 2026, leading to a significant drop in Take-Two's stock price and accusations of potential securities fraud or misleading statements.

    Government Incentives

    Governments worldwide recognize the economic and cultural value of the gaming sector and offer various incentives to attract and support developers. Take-Two, with its global presence, can potentially leverage these:

    • Canada: A leader in offering incentives, Canada provides the Interactive Digital Tax Credit, in place since 1997. Provincial programs, such as those in Manitoba, Newfoundland and Labrador, and Ontario, offer tax offsets of up to 40% of labor costs for video game developers. Additionally, federal and provincial governments offer direct funding for game development.
    • Europe: The European Commission provides direct funding up to 50% of eligible video game development costs. Many individual European states, including the UK, offer significant tax relief and funding programs. The UK's Video Games Tax Relief (VGTR) provides a 20% tax offset on production costs, in addition to direct funding through initiatives like the UK Games Fund. France and Germany also have multiple provisions to support game development.
    • United States: Federal R&D tax credit programs can help reduce production costs for studios engaged in technological advancements such as AI, real-time graphics, and virtual reality, creating cash flow advantages.
    • China: Retroactive to January 2025, China offers tax incentives for foreign investors who reinvest profits into "encouraged industries" and maintain investments for at least five years, aligning with its strategy to attract capital into strategic growth areas.

    Geopolitical Risks and Opportunities

    1. US-China Relations and Trade Policies:
    Geopolitical tensions between the US and China represent a significant risk. As of 2025, an escalated US-China tariff war has resulted in tariffs of up to 145% on Chinese imports of gaming hardware and components, including consoles, physical discs, and accessories. These tariffs directly increase production and import costs for companies like Take-Two, potentially leading to higher consumer prices or eroded profit margins. While digitally delivered games are currently largely insulated from these tariffs, 64% of console consumers still prefer physical copies, making the impact relevant.

    Furthermore, the Trump administration in 2025 has intensified export restrictions on high-end AI chips and Graphics Processing Units (GPUs) to China, potentially impacting the global supply chain for advanced gaming hardware. The AI Diffusion Rule, introduced by the Biden administration in January 2025 with a May 2025 compliance date, further extends controls over advanced computing chips and AI model weights. These restrictions could complicate US-China gaming development collaborations and global supply chains.

    Despite regulatory tightening and trade tensions, China remains a crucial gaming market. The regulatory environment has shown some signs of improvement, with a significant increase in game approvals by the National Press and Publication Administration (NPPA) in August 2025. Chinese game companies are also adapting their US strategies amid these policy changes.

    2. Russia-Ukraine War:
    Since March 2022, Take-Two Interactive has suspended all new sales, game installations, and marketing support across its labels in Russia and Belarus due to the ongoing military aggression against Ukraine. This decision, mirrored by many other major publishers, represents a loss of market revenue but also a strong ethical stance. The broader conflict has also led to a decrease in gameplay among some European gamers, reflecting how geopolitical events can influence consumer behavior and market trends.

    3. Economic and Industry-Specific Challenges:
    The gaming industry experienced widespread layoffs from 2022 to May 2025, with an estimated 35,000 jobs lost. Take-Two Interactive itself announced a plan in April 2024 to lay off 5% of its workforce and cancel several projects as part of a cost-reduction strategy. This indicates a challenging economic environment for the industry, marked by unsustainable growth post-COVID-19 and rising development costs.

    4. Emerging Technologies (AI, Cloud Gaming, Metaverse):
    The rise of emerging technologies such as generative AI, blockchain-based gaming, and metaverse developments presents both opportunities and new legal risks. Companies like Take-Two are focused on acquiring studios and technologies that can enhance their portfolios and provide a competitive edge. However, rapid technological changes also demand constant updates to meet regulatory requirements and can increase vulnerability to cybersecurity threats. The integration of AI also raises concerns about privacy, safety, and the need for robust AI moderation tools.

    14. Outlook and Scenarios

    As of October 1, 2025, Take-Two Interactive Software, Inc. (NASDAQ: TTWO) presents a compelling investment case characterized by significant future growth catalysts, primarily centered around its robust game pipeline and strategic diversification into mobile gaming. However, potential risks, including highly anticipated release delays and market volatility, temper the outlook.

    Bull Case

    The bullish sentiment for Take-Two Interactive is largely driven by its strong portfolio of intellectual properties and anticipated blockbuster releases. Key arguments supporting a positive outlook include:

    • Anticipation for Grand Theft Auto VI (GTA VI): The upcoming launch of GTA VI in May 2026 (during Take-Two's Fiscal Year 2027) is widely regarded as a monumental financial catalyst. Analysts project it could be the fastest-selling game of all time, potentially generating billions in revenue and significantly boosting the company's earnings per share (EPS). The immense hype around the game is expected to drive record net bookings for fiscal years 2026 and 2027.
    • Strong Performance of Existing Franchises: Established titles like Grand Theft Auto V (which has sold over 205 million units globally), Red Dead Redemption 2, and NBA 2K25 continue to demonstrate robust sales and engagement. NBA 2K25 achieved significant growth in average revenue per user and nearly 4.5 million units sold.
    • Growth in Recurrent Consumer Spending (RCS): RCS consistently accounts for a substantial portion of net bookings, reaching 81% in Q2 FY2025 and 83% in Q1 FY2026. This sticky revenue model, fueled by live services like NBA 2K and GTA Online, provides a stable financial base.
    • Mobile Gaming Expansion via Zynga: The 2022 acquisition of Zynga has significantly diversified Take-Two's revenue streams, making it a major player in the mobile gaming segment. Zynga titles like Match Factory!, Toon Blast, and Empires & Puzzles continue to perform well, contributing to mobile revenue growth.
    • Diversified and Robust Game Pipeline: Beyond GTA VI, Take-Two has a strong upcoming slate, including Sid Meier's Civilization VII, Borderlands 4, Mafia: The Old Country, NBA 2K26, and WWE 2K26. The integration of Gearbox further expands the Borderlands franchise.
    • Positive Analyst Sentiment: As of late September 2025, analysts generally hold a "Moderate Buy" or "Strong Buy" consensus rating for TTWO, with several firms raising price targets to reflect strong financial results and optimism for future releases.
    • Potential for AI Integration: In the long term, the adoption of artificial intelligence to improve efficiency and automate game development could further enhance profitability and lower costs.

    Bear Case

    Despite the strong growth prospects, several factors could present challenges and contribute to a bearish outlook:

    • GTA VI Release Delay: The official delay of Grand Theft Auto VI from its initial Fall 2025 window to May 2026 has shifted its significant revenue impact into fiscal year 2027, potentially impacting short-term investor expectations and financial projections for FY2026. The stock experienced a decline following the announcement of this delay.
    • High Valuation and Expectations: The stock's current valuation, including a high forward P/E ratio (around 214), already prices in substantial growth expectations from GTA VI. Any underperformance or further delays could lead to significant stock price volatility.
    • Execution Risk of New Releases: While anticipation is high, new game launches inherently carry risks related to player reception and market performance.
    • Mobile Market Volatility: Potential moderation in Zynga's mobile growth or adverse regulatory changes in app store policies could impact the performance of this diversified segment.
    • Competition and Industry Trends: The gaming sector as a whole has faced challenges since its 2020 peak. Take-Two must navigate intense competition and console generational shifts, ensuring optimal performance across various platforms.
    • Insider Selling and Short Interest: Recent insider share sales and high levels of short interest suggest that some investors anticipate a price reversion.
    • Short-Term Financial Adjustments: The company has mentioned shifts in the timing of marketing expenses which can temporarily impact short-term operational strategies.

    Short-Term Projections (as of October 1, 2025)

    • Recent Performance (Q2 FY2025, reported November 6, 2024): Take-Two reported net bookings of $1.47 billion, at the top of its guidance, with GAAP net revenue increasing 4% to $1.35 billion. Recurrent consumer spending rose 6% and accounted for 81% of net bookings. Key contributors included Grand Theft Auto V, Red Dead Redemption 2, and NBA 2K25. Zynga also posted solid results.
    • Fiscal Year 2025 Guidance: The company reiterated its net bookings outlook for FY2025 in the range of $5.55 billion to $5.65 billion, representing 5% growth over FY2024. Recurrent consumer spending is expected to grow approximately 4%, making up 78% of net bookings.
    • Upcoming Releases: In recent months, Take-Two has launched Borderlands 4 (September 2025), NBA 2K26 (August 2025), and Mafia: The Old Country (August 2025). Red Dead Redemption and Undead Nightmare for PC were also recently released.
    • Analyst Outlook: While some technical indicators suggest a bullish sentiment for October 2025, with a projected monthly trading range of $278.62 to $323.04, other short-term forecasts indicate potential negative movement for the coming month.

    Long-Term Projections

    • Record Net Bookings in FY2026 and FY2027: Take-Two anticipates achieving sequential increases and record levels of net bookings in fiscal years 2026 and 2027. The net bookings guidance for FY2026 is projected between $5.9 billion and $6.15 billion.
    • GTA VI Impact (FY2027): With the May 2026 release of Grand Theft Auto VI, significant revenue and profit acceleration are expected in FY2027. Analysts anticipate robust EPS growth, with some projecting a 465% increase for FY2026, largely driven by the anticipation and eventual sales of GTA VI.
    • Sustained Growth: Analysts expect revenue growth of nearly 52% and EPS growth of over 215% for the next fiscal year. Long-term forecasts suggest free cash flow could reach $2.9 billion by 2029.
    • Price Targets: The average 12-month analyst price target for TTWO ranges from approximately $248.32 to $262.02, with individual targets varying from a low of $170 to a high of $285. Long-term stock price predictions for 2030 show a wide range, from around $332 to over $539.

    Strategic Pivots

    Take-Two Interactive has undertaken several strategic pivots to ensure long-term growth and resilience:

    • Mobile-First Expansion: The acquisition of Zynga was a pivotal move to establish Take-Two as a leader in mobile gaming, the fastest-growing segment of interactive entertainment. This enhances revenue diversification and reduces dependency on single platforms. Zynga's management team now drives Take-Two's mobile strategy.
    • Emphasis on Recurrent Consumer Spending: By focusing on live services and ongoing content updates for titles like NBA 2K and Grand Theft Auto Online, the company has cultivated a stable and growing stream of RCS, which forms a significant portion of its net bookings.
    • Diversified Content Pipeline: Beyond its flagship Grand Theft Auto series, Take-Two is consistently investing in and developing a broad array of titles across various genres and platforms, including new entries in the Borderlands, Mafia, and Civilization franchises, as well as sports simulations like NBA 2K and WWE 2K.
    • Direct-to-Consumer Initiatives: The company is actively pursuing plans to expand its direct-to-consumer business offerings.
    • Operational Efficiency and Cost Management: Take-Two is implementing cost reduction programs while strategically increasing investment in marketing for new mobile and immersive core launches, and integrating acquisitions like Gearbox.
    • Leveraging New Console Generations: The company is focused on optimizing performance and leveraging opportunities presented by the PlayStation 5 and Xbox Series X|S.

    15. Conclusion

    Take-Two Interactive Software, Inc. (NASDAQ: TTWO) has demonstrated robust financial performance and maintains a strong position in the interactive entertainment industry as of October 1, 2025, buoyed by its powerful intellectual property and strategic pipeline.

    Summary of Key Findings:

    • Strong Financial Performance (Fiscal 2025 & Q1 Fiscal 2026): Take-Two reported strong Q1 Fiscal 2026 results, with net bookings reaching $1.423 billion, significantly exceeding consensus estimates of $1.310 billion. Adjusted earnings per share hit $0.61, surpassing the anticipated $0.29. For Q2 Fiscal 2025, GAAP net revenue increased 4% to $1.35 billion, and total net bookings grew 2% to $1.47 billion, driven by titles like NBA 2K25, Grand Theft Auto Online and Grand Theft Auto V, and various mobile games. The company reiterated its fiscal year 2025 net bookings guidance of $5.55 billion to $5.65 billion.
    • Recurrent Consumer Spending (RCS) Growth: A significant portion of Take-Two's revenue comes from recurrent consumer spending, which accounted for 79% of net bookings in Q3 Fiscal 2025 and 81% in Q2 Fiscal 2025, indicating a stable and growing revenue stream from in-game purchases and online services. NBA 2K has shown outstanding performance, with recurrent consumer spending up over 30%, daily active users increasing nearly 20%, and monthly active users rising nearly 10% in Q3 Fiscal 2025.
    • Anticipated Impact of Grand Theft Auto VI (GTA VI): While initially slated for Fall 2025, Grand Theft Auto VI has been delayed to May 2026. Despite the delay, analysts and management anticipate that GTA VI will be a transformative release, driving record levels of net bookings in fiscal years 2026 and 2027. Estimates suggest GTA VI could generate $1 billion in preorders and $3.2 billion in revenue during its first year.
    • Diverse Game Pipeline: Beyond GTA VI, Take-Two has a robust release schedule. Sid Meier's Civilization VII launched in February 2025, Mafia: The Old Country is expected in Summer 2025, and Borderlands 4 is planned for release in 2025. The NBA 2K franchise continues to be a reliable revenue driver.
    • Analyst Optimism: Analysts generally hold a positive outlook for TTWO, with a consensus "Moderate Buy" rating. Several firms, including Benchmark, Rothschild Redburn, Oppenheimer, Jefferies, JPMorgan, UBS, Raymond James, Wedbush, and CICC, have maintained or raised their price targets, ranging from approximately $200 to $285.00, reflecting confidence in the company's future. The average target price from 30 analysts is $261.16, with a high estimate of $285.00.
    • Stock Performance: TTWO stock reached an all-time high of $255.64 in September 2025, marking a 61.59% increase over the past year.

    Balanced Perspective:

    Take-Two's future appears exceptionally strong, primarily due to the impending launch of Grand Theft Auto VI, which is widely expected to be one of the largest entertainment launches in history. The company's strategy of focusing on high-quality, long-lifecycle titles with strong recurrent consumer spending is proving effective. The consistent performance of franchises like NBA 2K and the continued engagement with Grand Theft Auto Online provide a solid foundation.

    However, the delay of GTA VI from Fall 2025 to May 2026 caused some investor concern and a temporary stock dip, as it pushes a significant revenue driver out of the current fiscal year (FY2026 begins April 1, 2025) and into FY2027. Mobile segment performance has also presented mixed results, with some Zynga titles underperforming despite overall mobile growth driven by games like Match Factory! and Toon Blast. There's also inherent risk in any new game release, though for an an established franchise like GTA, this risk is relatively low given its passionate player base.

    What Investors Should Watch For Take-Two Interactive Software, Inc. as of 10/1/2025:

    1. Grand Theft Auto VI Development and Marketing: While the release is now set for May 2026, investors should closely monitor any further updates on its development, marketing campaigns, and pre-order metrics as the launch approaches. Any indications of further delays or unexpected reception could significantly impact the stock. The exact launch date in May 2026 has been confirmed with a second trailer.
    2. Performance of Other Key Releases in Calendar 2025: The success of Mafia: The Old Country (Summer 2025) and Borderlands 4 (2025) will be important indicators of Take-Two's ability to diversify its revenue streams and leverage its other strong IPs in the lead-up to GTA VI.
    3. Mobile Gaming Segment Turnaround: While some mobile titles are performing well, sustained growth and improved performance from underperforming Zynga titles are crucial for Take-Two's overall strategy, especially given the significant investment in the acquisition. Management has emphasized corrective actions in this area.
    4. Recurrent Consumer Spending Trends: Continue to monitor the growth rate of recurrent consumer spending across all franchises, particularly NBA 2K and Grand Theft Auto Online. Sustained growth in this high-margin area is key to long-term profitability.
    5. Fiscal Year 2026 and 2027 Guidance Updates: With GTA VI now slated for FY2027 (May 2026 falls into Take-Two's fiscal year starting April 1, 2026), investors should pay close attention to management's revised guidance for FY2026 and initial projections for FY2027, as these will incorporate the anticipated massive impact of the title. Take-Two has already expressed confidence in achieving record net bookings in these fiscal years.
    6. Industry Trends and Competitive Landscape: Keep an eye on broader industry trends such as subscription models, cloud gaming, and the role of AI in game development, and how Take-Two adapts its strategy to maintain a competitive edge against other major publishers like Electronic Arts and Activision Blizzard. Take-Two's focus on high-quality titles, digital distribution, and recurring consumer spending aligns with current industry trends. Long-term, AI is expected to improve efficiency and lower development costs.

    This content is intended for informational purposes only and is not financial advice

  • Super Micro Computer, Inc. (SMCI): Powering the AI Revolution with Purpose

    Super Micro Computer, Inc. (SMCI): Powering the AI Revolution with Purpose

    October 1, 2025 – Super Micro Computer, Inc. (NASDAQ: SMCI), widely recognized as Supermicro, stands at the epicenter of the artificial intelligence (AI) infrastructure revolution. This American information technology company, headquartered in San Jose, California, has strategically positioned itself as a critical enabler of next-generation AI deployments, offering high-performance, energy-efficient server and storage solutions. From enterprise data centers to hyperscale cloud environments, SMCI's modular "Building Block Solutions" and advanced cooling technologies are proving indispensable in a world increasingly reliant on AI. Today, as the demand for robust AI capabilities escalates, SMCI's relevance has never been more pronounced, making it a compelling subject for in-depth analysis.

    2. Historical Background

    Founded on November 1, 1993, in San Jose, California, by Charles Liang, his wife Sara Liu, and Chiu-Chu Liu, Supermicro began as a lean, five-person operation. Charles Liang, an electrical engineer with prior experience in motherboard design, leveraged his personal savings and contributions from family and friends to launch the company. From its inception, Supermicro differentiated itself with a focus on energy-efficient server solutions and high-performance computing, employing a modular approach to server design that allowed for customizable motherboards and chassis. This strategy quickly bore fruit, with the company achieving profitability within its first six months.

    Early milestones included the launch of the world's first dual-CPU motherboard in 1995 and international expansion into Taiwan (1996) and the Netherlands (1998). Supermicro went public with an IPO in 1999, further fueling its growth. A consistent theme throughout its early days was "green computing," emphasizing lower energy consumption, which became a key differentiator.

    Over time, Supermicro underwent several significant transformations. It evolved from a component provider to a total IT solutions provider, offering complete server systems, storage solutions, and rackmount hardware. The company successfully navigated the dot-com bust and adapted to the rise of cloud computing by introducing blade servers and high-density storage platforms. Its global manufacturing footprint expanded significantly, with facilities in Silicon Valley, the Netherlands, and Taiwan.

    The most impactful transformation, however, has been its pivot to AI and GPU server solutions in the late 2010s and early 2020s. Recognizing the immense demand for AI, machine learning, and high-performance computing, SMCI strategically focused on providing comprehensive solutions in these areas. This specialization, coupled with its advanced liquid-cooling technologies, has driven substantial revenue growth and propelled its stock performance, positioning it as a crucial supplier for AI infrastructure. By March 2024, Supermicro replaced Whirlpool in the S&P 500 and debuted on the Fortune 500 list, climbing to 292nd by 2025.

    3. Business Model

    Super Micro Computer, Inc. (SMCI) operates a business model centered on providing application-optimized total IT solutions, primarily for high-performance, high-efficiency server and storage systems. As of October 1, 2025, its model is characterized by diversified revenue streams, a broad product portfolio, complementary services, strategic market segmentation, and a robust customer base heavily influenced by the booming artificial intelligence (AI) market.

    Revenue Sources:
    SMCI primarily generates revenue from the sale of its high-performance server and storage systems, which accounted for approximately 94.7% of total revenue in Fiscal Year 2024 (FY24) and reached $21.31 billion in FY25. Key drivers include complete server systems, rackmount servers, and related components, especially its AI and accelerated computing platforms. Sales of subsystems and accessories (e.g., power supplies, chassis, cooling solutions) contribute about 5.3% of revenue. The company also earns recurring revenue from deployment assistance, technical support, and warranty services. Geographically, revenue is diversified, with significant contributions from North America, Asia, and Europe. For FY25, net sales reached $22.0 billion, a 47% increase year-over-year, with FY26 projections of at least $33.0 billion.

    Product Lines:
    Supermicro's product lines are known for high performance, energy efficiency, and customization, often leveraging their "Server Building Block Solutions" approach.

    • Server Systems: Includes Rack Servers (Ultra, Hyper, Mainstream), Blade Servers (SuperBlade®, MicroBlade®), GPU Servers (purpose-built for AI, ML, HPC, supporting NVIDIA and AMD GPUs, often liquid-cooled), Twin Family Servers (BigTwin®, TwinPro®, FatTwin®, GrandTwin®, FlexTwin™ for HPC), and 5G/Edge and Embedded Systems (SuperEdge®, Fanless Edge).
    • Storage Solutions: High-capacity and high-performance systems like SuperStorage®, JBODs, and All-Flash NVMe solutions.
    • Networking Equipment: Switches and network interface cards (NICs).
    • Subsystems and Accessories: Motherboards, chassis, power supplies (including Titanium Level 96%+ digital power supplies), cooling solutions, and server management software.

    Services:
    SMCI offers a range of services that complement its hardware and enhance customer satisfaction:

    • Technical Support, Warranty Services, and Onsite Services (Bronze, Silver, Gold tiers).
    • Deployment Assistance, System Integration, Professional Services, and Training.
    • Cloud Solutions (IaaS) and product-related resources (downloads, manuals, security alerts).

    Segments:
    SMCI's segments align with key technological trends:

    • Data Center Solutions: Focus on performance, scalability, and efficiency for cloud service providers and enterprises.
    • Artificial Intelligence (AI) and Machine Learning (ML): A major growth driver, with dedicated platforms and liquid cooling. SMCI holds approximately a 23.0% share in the AI server market.
    • High-Performance Computing (HPC): Solutions for complex simulations and research.
    • Enterprise IT: Robust IT infrastructure for daily operations.
    • Cloud Computing: Solutions for hyperscale data centers.
    • 5G/Edge Computing: Customized infrastructure for IoT, 5G, and autonomous vehicles.

    Customer Base:
    SMCI serves a diverse global customer base:

    • Hyperscale Cloud Providers and Large Enterprises: Significant customers, with four customers accounting for over 10% of revenue in FY25.
    • Technology Companies: NVIDIA Corp., Intel Corp., Advanced Micro Devices Inc., and Tesla.
    • Industries Served: Enterprise data centers, cloud computing, AI, 5G/edge computing, IT services (28%), and computer software (12%).
    • Company Size: Medium-sized companies (42%), small (<50 employees) at 28%, and large (>1000 employees) at 30%.
    • Geographic Reach: United States (52%), United Kingdom (5%), and Canada (4.46%).
    • Partnerships: Collaborates with distributors, VARs, system integrators, OEMs, and cloud service providers like Microsoft Azure, Google Cloud Platform, and Amazon Web Services.

    4. Stock Performance Overview

    Super Micro Computer, Inc. (SMCI) has experienced a tumultuous yet remarkably strong stock performance over the past decade, largely propelled by its strategic positioning in the burgeoning artificial intelligence (AI) infrastructure market. As of October 1, 2025, its trajectory is marked by periods of exponential growth, sharp corrections, and significant volatility influenced by both market dynamics and company-specific issues.

    1-Year Performance: Over the last year, SMCI has shown significant gains, with an increase of approximately 15.94% to 19.81%. Year-to-date in 2025, the stock is up around 50%, with a 57.28% increase since the beginning of the year. This rebound follows considerable volatility in late 2024.

    5-Year Performance: The past five years have been nothing short of extraordinary for SMCI investors, with returns ranging from approximately 1,715.91% to 1,721%. An investment made in September 2020 would have seen an increase of over 1,600% by September 2025, with the stock closing at $45.81 on September 21, 2025.

    10-Year Performance: While precise 10-year figures are varied, SMCI has consistently demonstrated long-term outperformance against major benchmarks like the S&P 500 and Nasdaq-100. An investor who bought $1,000 worth of SMCI stock at its IPO in 2007 would have seen their investment multiply roughly 54 times by September 2025, underscoring a powerful long-term growth trajectory. The stock reached an all-time high of $122.90 on March 7, 2024 (pre-split adjusted).

    Notable Moves and Influencing Factors:

    1. The AI Boom (2023-2025): The most critical driver has been the explosive growth in AI and machine learning. SMCI, as a leading provider of high-performance servers and storage for AI workloads, is a direct beneficiary. The global AI server market is projected to grow from $128 billion in 2024 to $167.2 billion by the end of 2025, reaching $1.56 trillion by 2034. SMCI's fiscal year 2025 revenue of $22 billion (up 47% year-over-year) and projected $33 billion for FY26 illustrate this direct correlation.

    2. Strategic Partnerships and Innovation: Deep alliances with semiconductor giants like NVIDIA, AMD, and Intel have been crucial. SMCI's ability to rapidly integrate and ship the latest chip technologies, such as NVIDIA's Blackwell Ultra AI chips (volume shipments commenced in September 2025), provides a significant competitive advantage. Its leadership in Direct Liquid Cooling (DLC) solutions, vital for energy-intensive AI systems, further strengthens its position.

    3. Financial Results and Analyst Sentiment: Consistent strong earnings and revenue growth, particularly in recent years, have often fueled investor confidence. While analysts' price targets vary, many maintain a bullish outlook, predicting continued growth. However, concerns about margin contraction due to competition and supply chain bottlenecks have also emerged, leading to some target adjustments.

    4. Accounting Irregularities and Volatility (Late 2024 – Early 2025): A period of extreme volatility occurred due to concerns over financial reporting. In August 2024, a Hindenburg Research short-seller report alleged accounting manipulation and other issues. This, coupled with delayed 10-K filings and the resignation of its auditor (Ernst & Young) in October 2024, caused the stock to tumble. From a high of over $115 in March 2024, it fell to $18 in late October 2024. However, an internal probe found no evidence of fraud, and the company hired a new auditor (BDO) and filed its reports, helping the stock recover.

    5. Broader Market and Economic Conditions: SMCI's performance is also influenced by macroeconomic factors. Interest rates, global IT spending trends, and supply chain stability (especially for semiconductors) can impact its operational costs and customer demand.

    In summary, Super Micro Computer, Inc. has delivered exceptional returns over the past five years, predominantly driven by its critical role in the AI server market and strong partnerships. While past accounting controversies introduced significant volatility, the company's fundamental position, robust revenue growth, and innovative product offerings continue to make it a pivotal player in the evolving AI landscape as of October 2025.

    5. Financial Performance

    Super Micro Computer, Inc. (SMCI) released its fourth quarter and full fiscal year 2025 financial results on August 5, 2025, for the period ending June 30, 2025. These, along with guidance for fiscal year 2026, represent the latest comprehensive financial disclosures as of October 1, 2025.

    Earnings:

    • Q4 FY2025: GAAP diluted net income per common share was $0.31, missing consensus estimates of $0.35. Non-GAAP diluted net income per common share was $0.41, below analyst estimates of $0.44.
    • Full FY2025: GAAP net income was $1.0 billion, or $1.68 per diluted share. Non-GAAP net income was $1.3 billion, or $2.06 per diluted share. This non-GAAP figure was down from the previous year, primarily due to tariff impacts.
    • Q1 FY2026 Outlook: The company is estimated to report Q1 FY2026 earnings (ending September 30, 2025) around November 3-6, 2025, with a consensus EPS forecast of $0.46.

    Revenue Growth:

    • Q4 FY2025: Net sales reached $5.8 billion, an 8% year-over-year increase and a 25% quarter-over-quarter increase, though slightly below analysts' expectations of $5.88 billion. Growth was primarily driven by next-generation air-cooled and liquid-cooled GPU AI platforms, which constituted over 70% of Q4 revenues.
    • Full FY2025: Net sales hit $22.0 billion, representing a significant 47% year-on-year growth compared to $15.0 billion in fiscal year 2024.
    • FY2026 Guidance: SMCI anticipates Q1 FY2026 net sales between $6.0 billion and $7.0 billion. For the full fiscal year 2026, the company projects net sales of at least $33.0 billion, indicating continued strong growth.

    Margins:

    • Q4 FY2025: Gross margin was 9.5%. Non-GAAP operating margin was 5.3%.
    • Full FY2025: Non-GAAP gross margin was 11.2%. The company aims to improve margins through comprehensive data center solutions. In Q3 FY2025, gross margin was 220 basis points lower than Q2, mainly due to higher inventory reserves for older generation products and expedited costs.

    Debt and Cash Flow:

    • Cash and Equivalents (June 30, 2025): $5.2 billion.
    • Total Bank Debt and Convertible Notes (June 30, 2025): $4.8 billion.
    • Cash Flow from Operations (Full FY2025): Significantly improved to $1.7 billion, compared to cash consumed by operations of $2.5 billion in FY2024.
    • Free Cash Flow (Q4 FY2025): Positive at $841 million. During Q4 FY2025, SMCI completed a convertible bond offering, raising $2.3 billion in gross proceeds.

    Valuation Metrics:

    • Trailing P/E Ratio: 29.63.
    • Forward P/E Ratio: 26.47.
    • PEG Ratio: 1.16.
    • EPS Growth: Earnings are expected to grow 19.35% in the next year, from an estimated $1.86 per share to $2.22 per share.

    SMCI's financial performance reflects a company in a high-growth phase, fueled by the AI boom. While revenue growth remains impressive, the company is managing margin pressures and working to optimize its profitability amidst rapid expansion and evolving market dynamics. The significant improvement in cash flow from operations is a positive indicator of its operational efficiency.

    6. Leadership and Management

    As of October 1, 2025, Super Micro Computer, Inc. (SMCI) is led by its long-standing CEO, Charles Liang, and is actively pursuing an aggressive growth strategy in the AI and data center markets. However, its corporate governance and reputation remain areas of significant scrutiny.

    CEO, Leadership Team, and Board of Directors:

    • CEO: Charles Liang, co-founder, Chairman, President, and Chief Executive Officer since 1993, has been instrumental in shaping SMCI's server system architectures and technologies.
    • Leadership Team: Key members include David Weigand (SVP, CFO, and CCO), Don Clegg (SVP of Worldwide Sales), George Kao (SVP of Operations), and Yitai Hu (Chief Legal Officer and General Counsel, appointed April 2025).
    • Board of Directors: As of May 2025, the Board includes Charles Liang, Sara Liu (co-founder, SVP, Director, and Charles Liang's wife), Wally Liaw (founding member), and independent directors such as Daniel W. Fairfax, Tally Liu, Sherman Tuan, Judy Lin, Robert Blair, Susie Giordano (appointed August 2024), and Scott Angel. Concerns about board independence and entrenchment have been raised due to the long tenure of co-founders.

    Strategy:

    SMCI's strategy is to be a "Total IT Solutions provider for AI, Cloud, Storage, and 5G/Edge markets," driven by innovation and customer experience.

    • Ambitious Growth Targets: Aiming for $33 billion in revenue by 2026.
    • Innovation in Data Center Solutions: Heavy focus on liquid cooling technologies (DLC-2) for high-performance computing and generative AI, with new Data Centre Building Block Solutions (DCBBS).
    • Customer Base Expansion: Targeting "neo clouds" and sovereign entities, increasing "scale customers."
    • Geographical Expansion: Expanding into the Middle East, Southeast Asia, and Europe.
    • Strategic Partnerships: Collaborations with Fujitsu for energy-efficient servers, Guo Rui for renewable energy-powered AI data centers, and a $20 billion partnership with DataVolt (Saudi Arabia) for AI campuses.

    Governance:

    Corporate governance has been a significant area of concern:

    • Past and Ongoing Scrutiny: Allegations of accounting irregularities and export control violations (e.g., 2024 Hindenburg Research report, 2020 SEC charges for improper revenue recognition).
    • Auditor Resignation and Investigations: Ernst & Young (EY) resigned as auditor in October 2024, citing "significant concerns" over internal controls, board independence, and accounting practices, leading to a 30% stock drop. The DOJ and SEC have issued subpoenas.
    • Internal Control Weaknesses: SMCI disclosed material weaknesses in internal controls by 2025, impacting financial reporting reliability. Delays in SEC filings since mid-2024 also contributed to investor caution.
    • Insider Selling: Significant insider sales by top executives, including CEO Charles Liang and CFO David Weigand, in May-June 2025, totaling over $997 million, raised questions about management confidence.
    • Remedial Actions: An independent Special Committee found no evidence of misconduct by management but recommended strengthening governance. BDO was engaged as the new auditor.

    Reputation:

    SMCI's reputation is mixed:

    • Positive Aspects: Recognized as an innovation leader in high-performance, energy-efficient "green computing" solutions for AI, cloud, and data centers. Strong market growth led to inclusion in the S&P 500 and a significant climb on the Fortune 500 list. Strategic partnerships and early NVIDIA Blackwell system shipments underscore its technological prowess.
    • Challenges and Negative Perceptions: Governance and accounting issues have severely impacted its reputation for financial integrity. Employee reviews sometimes cite a "toxic work culture," and historical customer support issues have been noted. Despite robust revenue growth, declining gross margins (9.6% in Q3 FY'25) raise concerns about long-term profitability.

    In summary, Super Micro Computer, Inc. is driven by a strong leadership vision for AI and data center innovation, demonstrating impressive market expansion. However, it is simultaneously navigating serious corporate governance issues and working to rebuild investor trust and internal operational integrity.

    7. Products, Services, and Innovations

    Super Micro Computer, Inc. (SMCI) remains a pivotal player in the high-performance server and storage solutions market as of October 1, 2025, with a strong focus on artificial intelligence (AI) infrastructure. The company's offerings, innovation, R&D, patent portfolio, and competitive strategies are deeply integrated with the accelerating demands of the AI industry.

    Current Offerings

    SMCI provides a comprehensive range of IT solutions, including complete servers, storage systems, modular blade servers, workstations, full-rack scale solutions, networking devices, server sub-systems, and server management and security software. A significant portion of its current portfolio is dedicated to AI-optimized systems. These include:

    • AI-Optimized Servers: SMCI is shipping server systems integrated with NVIDIA's next-generation Blackwell Ultra AI chips, including the B300 and GB300 NVL72 platforms. They also offer solutions optimized for AMD's MI350 and MI355X GPUs, along with Intel Xeon 6 SoC processors for edge-optimized systems.
    • Advanced Cooling Technologies: A crucial differentiator is SMCI's leadership in advanced cooling, particularly its Direct Liquid Cooling (DLC-2) solutions. These systems can reduce power consumption by up to 40%, lower the total cost of ownership by 20%, and operate at significantly reduced noise levels, addressing critical challenges in large-scale AI deployments.
    • Data Center Building Block Solutions (DCBBS): SMCI has expanded its data center offerings with DCBBS, a modular architecture designed for faster and more efficient deployment of AI data centers, appealing to hyperscalers and enterprises.
    • Rack-Scale Solutions: The company offers full-rack scale solutions that are designed for rapid scaling in increasingly large and complex AI clusters.

    Innovation Pipelines

    SMCI's innovation pipeline is heavily geared towards meeting the escalating demands of AI and high-performance computing (HPC). Key areas include:

    • Next-Generation AI Systems: The company is focused on the rapid integration and deployment of the latest GPU technologies from NVIDIA and AMD, evidenced by early volume shipments of NVIDIA Blackwell Ultra systems.
    • Energy Efficiency and Sustainability: Continued development in advanced cooling technologies like DLC-2 highlights a commitment to energy-efficient and sustainable data center solutions.
    • Modular Architectures: The DCBBS approach reflects an ongoing innovation in creating flexible, scalable, and quickly deployable infrastructure solutions for various workloads, from cloud to edge.
    • Global Manufacturing Expansion: To support its innovation and meet surging demand, SMCI is expanding its manufacturing facilities in the US, the Netherlands, Taiwan, and Malaysia.
    • Strategic Collaborations: SMCI's multi-year, $20 billion partnership with Saudi data center company DataVolt, and collaboration with Lambda to build "AI factories" using SMCI's NVIDIA Blackwell GPU server clusters, indicate strong innovation partnerships.

    R&D and Patents

    SMCI maintains an aggressive pace of innovation, reflected in its substantial R&D investments. Annual R&D expenses for 2025 were $0.637 billion, a 37.32% increase from 2024, with the USA serving as its primary R&D center.

    SMCI holds a significant patent portfolio, with a total of 357 patents globally, of which 308 have been granted and over 86% are active. Recent patent grants, as of late 2024 and 2025, demonstrate a strong focus on cooling technologies crucial for high-density computing:

    • Fluid Immersion Cooling Systems: Multiple patents for fluid immersion cooling systems, including those with multiple layers of coolant fluids and hydrocarbon dielectric fluids.
    • Cooling Apparatus for Servers: Patents for cooling apparatus specifically designed for servers, improving fluid flow and exchange.

    While SMCI actively files patents, it is also a party in intellectual property disputes. For instance, in September 2025, Netlist, Inc. filed a U.S. International Trade Commission (ITC) complaint against Super Micro (among others) over patents related to DDR5 memory modules and high-bandwidth memory (HBM) technologies.

    Competitive Edge

    SMCI's competitive edge is built on several key factors:

    • First-to-Market Advantage: Consistently integrates and ships the latest technologies, such as NVIDIA's Blackwell Ultra systems, ahead of competitors.
    • Leadership in AI and Green Computing: Focus on high-performance, AI-optimized, and energy-efficient solutions, particularly DLC-2 technology.
    • Customization and "Building Block" Approach: "Building blocks" technology allows for highly customized solutions to be delivered more quickly than larger competitors.
    • Deep Partnerships: Strong relationships with key technology partners like NVIDIA, facilitated by close ties between CEOs.
    • Scalability and Efficiency: Solutions designed for rapid scaling and efficiency gains in large deployments.
    • Global Reach and Expanding Capacity: Expanding manufacturing and R&D operations globally.

    Despite intense competition from players like Dell Technologies and Hewlett Packard Enterprise, SMCI's aggressive innovation, strategic partnerships, and focus on energy-efficient, AI-optimized, and customizable solutions enable it to maintain a strong competitive stance in the rapidly expanding AI infrastructure market.

    8. Competitive Landscape

    Super Micro Computer, Inc. (SMCI) operates within a highly competitive and rapidly evolving landscape, primarily focused on high-performance servers, storage solutions, and AI infrastructure. As of October 1, 2025, the company faces significant rivals and is navigating both substantial strengths and notable weaknesses.

    Industry Rivals

    SMCI competes with a wide array of established technology giants and specialized hardware providers. Key rivals include:

    • Dell Technologies (DELL): A major competitor in server, storage, and AI infrastructure, offering solutions like liquid cooling and advanced AI servers through its Apex and PowerEdge platforms.
    • Hewlett Packard Enterprise (HPE): Another significant player in the AI infrastructure space, providing modular, performance-optimized data center solutions, including liquid-cooled HPC and AI servers via its HPE Cray and Apollo systems.
    • HP Inc. (HPQ): Competes in segments relevant to SMCI's offerings.
    • IBM: Offers server and enterprise computing solutions.
    • Cisco Systems: Competes in networking and integrated systems, overlapping with SMCI's data center infrastructure.
    • Lenovo: A global technology company with a strong presence in the server market.
    • Pure Storage (PSTG): Specializes in data storage hardware and software, competing with SMCI's storage solutions.
    • Other notable competitors in the broader computer and technology sector include Advanced Micro Devices (AMD), Intel (INTC), NVIDIA (NVDA) (though also a key partner), Microsoft (MSFT), Alphabet (GOOGL), Meta Platforms (META), Palantir Technologies (PLTR), and Arista Networks (ANET).

    Market Share

    While a precise overall market share for SMCI in the global server market as of late 2025 is not uniformly reported, several key points highlight its position:

    • AI Server Leadership: Super Micro Computer is recognized as a market share leader in AI servers, a specialized and rapidly growing segment. The AI server market was valued at $128 billion in 2024 and is projected to reach $167.2 billion by the end of 2025.
    • AI Revenue Contribution: In Q3 FY2025, SMCI's AI platform revenue contributed over 70% to its top line.
    • AI Sales Projections: Analysts anticipate SMCI to generate $20 billion in AI-related sales over the four quarters following late 2025, surpassing Dell's forecast of $15 billion for the same period.
    • Overall Server Market: In the broader global server and enterprise computing market, SMCI had a comparatively smaller market share of approximately 3.2% as of Q4 2023, trailing behind giants like Dell (16.8%) and HP (18.5%). This indicates a strategic focus and strong performance within the niche of AI servers rather than dominating the entire server market.

    Competitive Strengths and Weaknesses (as of 10/1/2025)

    Competitive Strengths:

    • AI Server Specialization and Innovation: First-mover in shipping next-generation AI systems (NVIDIA B300, GB300) and over 30 new solutions optimized for latest architectures.
    • Customization and Rapid Deployment: Excels in quickly deploying custom server solutions with its Data Center Building Block Solutions (DCBBS).
    • Advanced Cooling Technology: Offers energy-efficient liquid cooling systems, including DLC-2, reducing power consumption by up to 40% and TCO by 20%.
    • Strong Partnerships: Important AI computing partnerships with NVIDIA and Fujitsu, and serves prominent customers in the AI value chain.
    • Revenue Growth and R&D Investment: Robust revenue growth (47% YoY in FY25 to $22 billion, projecting $33 billion for FY26) and strong R&D investment.
    • Expanding Manufacturing and Global Footprint: Scaling global manufacturing capacity in the US, Taiwan, the Netherlands, and a new facility in Mexico.

    Competitive Weaknesses:

    • Margin Pressure and Declining Profitability: Significant gross margin contraction (from 15.5% in Q3 2024 to 9.6% in Q3 2025) due to intense competition, high component costs, and aggressive pricing. Net income also declined in FY25 despite increased sales.
    • Increased Operational Expenses: Rising operating expenses (33.9% in Q3 2025 YoY) due to higher headcount and compensation, pressuring profitability.
    • Accounting and Governance Concerns: Past scrutiny over accounting practices, auditor resignation, SEC/DOJ investigations, and shareholder lawsuits raise governance risks and can deter investors.
    • Market Volatility and Customer Decision Delays: Rapid technological transitions (e.g., NVIDIA Hopper to Blackwell) have led to customers delaying purchasing decisions, causing sequential revenue declines.
    • Smaller Overall Market Presence: While strong in AI servers, overall server market share is smaller than giants like Dell and HPE.
    • Increasing Leverage: Debt-to-equity ratio has risen to 1.22, indicating increased reliance on debt.

    In conclusion, Super Micro Computer, Inc. is a formidable player in the high-growth AI server market, leveraging its innovative products, rapid customization, and advanced cooling. However, it must address declining profit margins, rising operational costs, and ongoing governance challenges to maintain its competitive edge and ensure long-term profitability amidst intense competition.

    9. Industry and Market Trends

    Super Micro Computer, Inc. (SMCI) operates within a rapidly evolving technology landscape, primarily benefiting from the burgeoning demand in data center infrastructure, particularly for Artificial Intelligence (AI) and Machine Learning (ML) applications. As of October 1, 2025, the company's trajectory is largely shaped by significant sector-level trends, macro drivers, ongoing supply chain dynamics, and distinct cyclical effects.

    Sector-Level Trends

    The overarching trend in SMCI's sector is the explosive growth of the data center and AI server markets. The global data center market is projected to reach approximately $527.46 billion by 2025, driven by expanding network infrastructure and new workload types. This growth is further propelled by the need for more secure data handling and the evolution of data centers into complex ecosystems supporting hyperscale cloud, colocation, modular edge deployments, and high-performance computing.

    A critical shift is occurring towards high-density, AI-optimized data centers. AI workloads are redefining requirements, with many deployments exceeding 125 kW per rack and forecasts suggesting densities could reach up to 300 kW per rack, potentially surpassing 600 kW per rack with next-generation GPUs. This necessitates entirely new cooling strategies, with direct-to-chip (DLC) liquid cooling rapidly becoming a standard for supporting modern, high-density workloads due to its efficiency over traditional air systems. SMCI is actively involved in providing these advanced cooling solutions. Traditional data centers with lower capacity (25-50 MW) are being replaced by larger facilities designed for 100-200 MW, and even campuses exceeding 500 MW.

    The AI server market, a core focus for SMCI, is experiencing remarkable growth. It is projected to expand from $39.23 billion in 2025 to $352.28 billion by 2034, at a CAGR of 27.62%. Another projection estimates the AI server market to grow from $167.2 billion in 2025 to $1.56 trillion by 2034, representing a 28.2% CAGR. Global shipments of high-end AI servers are expected to grow from 639,000 units in 2024 to 1.323 million units in 2025. GPU-powered systems for AI are expected to triple in size over three years, with GPUs dominating the hardware segment with a 39% market share in 2024, projected to grow at over 26% from 2025 to 2034.

    Cloud computing expansion and edge computing are also central to the sector's growth. Enterprises are adopting public, private, and hybrid cloud models, driving data center growth. Edge computing is shifting data processing closer to users and devices, crucial for applications requiring low latency and rapid decision-making in industries like manufacturing and autonomous systems.

    Macro Drivers

    The primary macro driver for SMCI is the relentless advancement and widespread adoption of Artificial Intelligence and Machine Learning. The introduction of generative AI, such as ChatGPT, has significantly impacted the demand for high-end AI servers globally. Billions of dollars have been invested in AI over the last couple of years, directly fueling the demand for more powerful and efficient data center infrastructure. Enterprises are integrating autonomous systems powered by AI and ML to improve efficiency, reduce costs, and enhance decision-making across various industries.

    Other significant macro drivers include the continued surge in cloud computing investments and the growing importance of cybersecurity and zero-trust architectures. Businesses prioritize flexibility, scalability, and security, leading to increased demand for robust IT infrastructure. Geopolitical factors and international competition in AI development also influence investment, with a heightened concern around falling behind in the global AI race driving U.S. hyperscaler investment.

    However, macroeconomic headwinds are also present. Economic uncertainty and tariffs have caused some customers to pause platform decisions, impacting revenue targets for companies like SMCI. Power constraints represent a tangible limitation on data center growth, with projected power demands from existing and planned U.S. data centers exceeding utility supply by about 50%. This dynamic is spurring the exploration of new markets and solutions, including nuclear power and small modular reactors (SMRs), to meet energy demands.

    Supply Chains

    Super Micro Computer faces ongoing challenges related to supply chain disruptions, particularly semiconductor shortages, which can impact production timelines and costs. These delays are one factor complicating data center development.

    However, SMCI's operational strategy aims to mitigate some of these issues. The company utilizes a modular and open-standard architecture for its server and storage solutions. Furthermore, Supermicro runs its own manufacturing facilities in the US, Taiwan, and the Netherlands, which provides it with greater control over its supply chain. As the supply chain capacity for AI servers increases, particularly for components like L6 boards and L10-12 assembly, Taiwanese manufacturers are expected to be main suppliers, benefiting the overall market.

    Despite efforts, current supply chain constraints and a higher cost profile are expected to keep free cash flow margins relatively subdued in the earlier stages of the current buildout, impacting profitability.

    Cyclical Effects

    SMCI's business exhibits a strong cyclical nature, closely tied to the refresh cycles of GPUs, particularly those from Nvidia. The company's revenue and margins tend to inflect with large chip ramps.

    A recent example of this cyclicality was observed in Q3 FY25, where Supermicro's revenue dropped sequentially, and gross margin fell. This decline was attributed to delayed customer orders during the transition from Nvidia's Hopper to the next-generation Blackwell GPU platforms. Inventory write-downs related to older systems also compressed margins, exposing a vulnerability in SMCI's "ramp-first" strategy.

    However, a robust upcycle is anticipated for SMCI in the second half of 2025 as Blackwell deployments ramp up. Nvidia is expected to scale mass production of its Blackwell GPUs (B200/GB200) with peak shipments anticipated for Q3 and Q4 2025. SMCI, having already shipped early systems and ramping up its liquid-cooled rack infrastructure, is well-positioned to capitalize on this surge in demand. This next cycle, driven by Blackwell, is considered a "generational jump for AI compute".

    Beyond GPU cycles, broader macroeconomic conditions also introduce cyclical effects. A dimming macroeconomic outlook and potential cost-reduction efforts by enterprises could act as headwinds for SMCI's enterprise business in FY25, though hyperscaler sales may offset this. Flexibility, scalability, and security remain top priorities for businesses in 2025, suggesting a continued need for SMCI's offerings even amidst economic shifts.

    10. Risks and Challenges

    Super Micro Computer, Inc. (SMCI) faces a complex landscape of operational, regulatory, controversial, and market risks as of October 1, 2025. While positioned to capitalize on the booming AI infrastructure market, the company contends with significant internal control weaknesses, heightened regulatory scrutiny, ongoing controversies surrounding its financial practices and governance, and intense market competition.

    Operational Risks

    SMCI's operational stability is challenged by several factors:

    • Internal Financial Controls: As of June 30, 2025, SMCI disclosed in its SEC filings that its internal controls over financial reporting were "not effective" due to recurring material weaknesses, an issue that has persisted since at least 2020. This raises concerns about the reliability, accuracy, and timeliness of its financial reporting, despite ongoing remediation efforts that are not guaranteed to be effective.
    • Supply Chain Vulnerabilities: The burgeoning demand for high-end GPUs and High Bandwidth Memory (HBM) has led to supply constraints, extended lead times, and increased costs for SMCI. The company's growth is significantly dependent on NVIDIA's GPU roadmap, making it susceptible to delays in silicon innovations outside its control. Supply chain bottlenecks are prone to disruptions, which can lead to rising costs and diminished profit margins.
    • Manufacturing Capacity: SMCI has faced challenges in rapidly scaling production, which has contributed to weaker-than-expected gross margins. However, the company is actively expanding its global manufacturing capabilities, with plans for a third Silicon Valley campus and expansions in Taiwan, the Netherlands, and a new facility in Mexico.
    • Gross Margin Pressure: SMCI has experienced considerable pressure on its gross margins. This is attributed to fierce competition, aggressive pricing strategies to secure new design wins, and shifts in its product mix towards cheaper, bulk orders over premium AI systems. Analysts caution that the projected margins of 10-11% might be insufficient for long-term innovation.
    • Customer Delays: The company has also contended with delays in customer purchasing decisions, as clients evaluate the adoption of next-generation AI platforms. Additionally, delays in NVIDIA Blackwell GPU shipments have directly impacted SMCI's revenue.

    Regulatory Risks

    SMCI is under significant regulatory scrutiny, stemming from a history of compliance issues:

    • SEC Scrutiny and Financial Reporting: SMCI has a history of accounting irregularities, including a 2020 SEC fine for prematurely recognizing revenue and understating expenses. In 2024, the company missed its annual report deadline, and in 2025, it continues to report ineffective internal controls over financial reporting. These weaknesses could impede the timely and accurate reporting of financial results.
    • Nasdaq Compliance: In November 2024, SMCI received a notice of non-compliance from Nasdaq due to delays in filing its annual and quarterly reports. Although the company regained compliance by filing these reports in February 2025, such past issues raise ongoing concerns about its governance and transparency, with the risk of delisting if future deadlines are missed.
    • DOJ Investigation: The Department of Justice (DOJ) has issued subpoenas for documents, indicating ongoing investigations into past allegations against the company.
    • Export Control Failures: Allegations in a Hindenburg Research report in 2024 included "sanctions and export control failures," with prior reports citing instances of selling to Iran in breach of U.S. export controls.

    Controversies

    Several controversies continue to impact SMCI's reputation and investor confidence:

    • Hindenburg Research Report: In August 2024, short-seller Hindenburg Research released a critical report alleging accounting manipulation, undisclosed related-party transactions, and export control violations. Super Micro has publicly denied these claims.
    • Auditor Resignations: Ernst & Young (EY) resigned as SMCI's auditor in October 2024, citing concerns over governance and transparency, which led to a notable drop in the company's stock price. SMCI subsequently appointed BDO USA as its new auditor.
    • Insider Stock Sales and Executive Compensation: Despite positive projections for AI-driven growth, insider stock sales totaling $314 million in Q3 2025 and CEO Charles Liang's $28.10 million compensation package for 2025 (comprising entirely of stock and bonuses) have raised questions regarding potential share dilution and the alignment of executive incentives with long-term shareholder value. The compensation structure has been noted for lacking explicit performance milestones, contrasting with many S&P 500 companies.
    • Board Entrenchment: Concerns exist regarding the composition of SMCI's board, which is perceived as being dominated by long-tenured executives and co-founders, including CEO Charles Liang, who holds a significant 11.08% ownership stake.

    Market Risks

    SMCI operates within a highly dynamic and competitive market, exposing it to several risks:

    • Intense Competition: SMCI faces formidable competition from industry giants such as Dell Technologies, Hewlett Packard Enterprise (HPE), Lenovo, and Cisco Systems, as well as chip manufacturers like Intel, NVIDIA, AMD, and Qualcomm. These competitors offer similar products and are heavily investing in AI infrastructure solutions, intensifying pricing pressure.
    • Stock Volatility: SMCI's stock has demonstrated considerable volatility, experiencing significant price fluctuations. It has been described as one of the most volatile stocks in the S&P 500, with its performance heavily influenced by financial control issues, earnings announcements, and broader market sentiment regarding AI.
    • Dependency on NVIDIA: A substantial portion of SMCI's growth is linked to its strategic partnership with NVIDIA and the successful adoption of NVIDIA's GPU architectures, such as Blackwell. Any delays in NVIDIA GPU shipments directly impact SMCI's revenue, highlighting a significant reliance on a single key supplier.
    • Valuation Concerns: Some analysts express concerns about SMCI's valuation, with one analysis suggesting a 227% overvaluation. Weak operating margins and persistent governance issues are cited as factors that may diminish its growth potential in the eyes of investors.
    • Geopolitical Risks: Evolving global trade policies and geopolitical tensions could disrupt international supply chains and restrict market access for AI hardware, impacting SMCI's operations and financial performance.
    • Seasonality: Historical trading patterns suggest that October tends to be a weaker month for SMCI's stock performance.

    11. Opportunities and Catalysts

    Super Micro Computer, Inc. (SMCI) is actively pursuing various growth strategies and is positioned to capitalize on significant industry trends, particularly in the artificial intelligence (AI) and high-performance computing sectors. As of October 1, 2025, the company's growth is driven by innovative product offerings, strategic market expansion, and upcoming financial and product events.

    Growth Levers

    SMCI's primary growth is fueled by robust demand for its AI infrastructure solutions. The company is a major player in the AI server market, delivering systems built on the latest NVIDIA and AMD platforms. Key growth levers include:

    • AI Server and GPU Platforms: SMCI is leveraging the explosive demand for AI servers, offering solutions optimized for NVIDIA's latest Blackwell systems (B300 and GB300 NVL72 GPUs), and other NVIDIA and AMD architectures. These next-generation GPU and AI platforms are contributing significantly to its top-line growth, accounting for over 70% of revenue in Q4 fiscal 2025.
    • Advanced Cooling Technologies: The company's next-generation air-cooled and direct liquid cooling (DLC) solutions are in high demand, particularly for hyperscalers and AI data centers. The recently introduced DLC-2 technology offers substantial benefits, including up to 40% reduction in power and water consumption, 20% lower total cost of ownership, and significantly reduced noise levels.
    • Data Center Building Block Solutions (DCBBS): SMCI's strategic shift towards higher-margin Data Center Building Block Solutions is gaining traction. This modular architecture enables faster deployment and greater customization compared to traditional rack-scale solutions, appealing to a broader range of customers, including enterprises and cloud service providers.
    • Customer Expansion and Strategic Partnerships: SMCI is actively expanding its base of large data center customers and is expected to add several more. The company has forged strategic partnerships with industry giants like NVIDIA, AMD, Intel, Nokia, and Lambda, enhancing its capabilities and market reach in next-generation data centers and AI infrastructure.
    • Manufacturing Capacity Expansion: To meet surging global AI demand, SMCI is scaling its manufacturing capacity. This includes the development of a third Silicon Valley campus and expansion in Taiwan, the Netherlands, and a new facility in Mexico.

    New Markets

    SMCI is strategically expanding its presence in both existing and emerging markets:

    • Geographical Expansion: The company is increasing its awareness and operations in regions like Europe, the Middle East, and Africa (EMEA). The data center infrastructure market in Europe alone is projected to exceed $150 billion by 2030.
    • Sectoral Diversification: Beyond its core AI and hyperscale data center markets, SMCI is focusing on expanding into enterprise, Internet of Things (IoT), and telecommunications (telco) markets to further drive profitability.
    • Sustainable Data Centers: SMCI is positioned to lead the transition towards more sustainable and high-performance data centers, a growing focus for many organizations due to environmental concerns and operational costs.
    • AI Server Market Growth: The global AI server market, valued at approximately $128 billion in 2024, is projected to grow to $167.2 billion by the end of 2025 and an impressive $1.56 trillion by 2034, representing a significant long-term growth opportunity for SMCI.

    M&A Potential

    While the company's robust growth and strategic positioning make it an attractive entity, there is no explicit information or active speculation regarding specific mergers or acquisitions involving Super Micro Computer, Inc. as of October 1, 2025. One general reference mentions "Goldman's 48 potential M&A candidates" in a related article, but it does not specify SMCI's inclusion or any direct M&A activity for the company itself.

    Near-Term Events (as of 10/1/2025)

    SMCI has several near-term events that are likely to influence its performance and market perception:

    • Upcoming Earnings Report: Super Micro Computer, Inc. is estimated to announce its next earnings report (Q1 Fiscal Year 2026) between October 31, 2025, and November 6, 2025. The company previously reported Q4 FY2025 earnings on August 5, 2025, which, despite missing analyst estimates for EPS, showed a 47% year-over-year revenue growth to $22 billion for the full fiscal year.
    • Financial Guidance: For Q1 FY2026, SMCI has provided revenue guidance between $6 billion and $7 billion. The company projects at least $33 billion in total revenue for the full fiscal year 2026, reflecting strong confidence in continued growth from AI demand and modular infrastructure. Earnings per share (EPS) are expected to grow from $1.86 in the current fiscal year to $2.22 in the next, a 19.35% increase.
    • Recent Product Launches and Events:
      • INNOVATE! EMEA 2025: Held on September 22-23, 2025, in Madrid, Spain, this event showcased new AI-optimized servers featuring NVIDIA HGX B300 and GB300 NVL72 GPUs, as well as new edge systems and data center solutions.
      • NVIDIA Blackwell System Shipments: SMCI has begun volume shipments of NVIDIA's Blackwell Ultra systems, including B300 and GB300 AI systems.
      • New Solutions: The company has launched over 30 new solutions optimized for the latest NVIDIA and AMD architectures.
    • Investor Events: SMCI participated in prominent investor conferences in September 2025, including the Citi 2025 Global Technology, Media and Telecommunications Conference and the Goldman Sachs Communacopia + Technology Conference.

    12. Investor Sentiment and Analyst Coverage

    As of October 1, 2025, investor sentiment and analyst coverage for Super Micro Computer, Inc. (SMCI) present a mixed but generally optimistic picture, characterized by a consensus "Buy" or "Hold" rating from Wall Street analysts, significant institutional ownership with recent shifts, and sustained retail investor interest.

    Wall Street Ratings and Price Targets

    Wall Street analysts currently hold a consensus "Buy" rating for SMCI as of October 1, 2025, based on 25 analyst ratings. A breakdown shows 44% recommending a "Strong Buy," 8% a "Buy," 36% a "Hold," 8% a "Sell," and 4% a "Strong Sell." Another analysis based on 17-18 analysts over the past 12 months indicates a consensus "Hold" rating, with 1 "Strong Buy," 6 "Buy," 9 "Hold," and 2 "Sell" ratings. The average analyst rating is also described as "Buy," suggesting that analysts believe the stock is likely to outperform the market over the next twelve months.

    Price targets for SMCI vary among analysts. One report as of October 1, 2025, indicates an average price target of $187.32. However, other analyses from late September 2025 present different average price targets, including $45.36 (with a high of $60.00 and a low of $27.00), and $47.47 (with a high of $70 and a low of $34). These discrepancies highlight the diverse perspectives on SMCI's future valuation. Some analysts have revised their price targets recently, with Barclays raising its target to $45 and Needham & Company upgrading to a "buy" with a target of $60, while JPMorgan Chase & Co. lowered its target to $45. Bernstein initiated coverage with a "Hold" rating and a $46 price target in mid-September 2025.

    The income statement outlook for SMCI remains promising, with analysts expecting 70% revenue growth and 48% EPS growth in fiscal year 2025, equating to an estimated revenue of $25 billion and EPS of $2.97. This growth is largely driven by its focus on artificial intelligence solutions, which account for nearly 70% of sales. However, the company did revise its FY2025 revenue guidance downward to a range of $23.5 billion to $25 billion, a reduction of approximately 13% from previous estimates, and experienced a decline in non-GAAP gross margin.

    Hedge Fund Moves

    Hedge fund activity in Super Micro Computer, Inc. showed mixed signals in Q3 2024 (the most recent quarter for which detailed hedge fund activity data is readily available). While 217 institutional investors added SMCI shares to their portfolios, 474 decreased their positions.

    Notable reductions in holdings during Q3 2024 include DISCIPLINED GROWTH INVESTORS INC /MN (100% decrease), MORGAN STANLEY (81% decrease), MILLENNIUM MANAGEMENT LLC (99.3% decrease), FMR LLC (100% decrease), and JPMorgan Chase & Co. (49.5% decrease). Conversely, INVESCO LTD. significantly increased its position (100.8% increase). Ray Dalio's hedge fund notably added to his position by 116.08%, while Ken Fisher reduced his by 23.49%. Several hedge funds completely sold out of their SMCI holdings. Overall, hedge funds decreased their holdings in Super Micro Computer by 9.2 million shares in the last quarter.

    Institutional Investors

    As of September 29, 2025, Super Micro Computer, Inc. has 1,427 institutional owners and shareholders, holding a total of 338,288,783 shares. Institutional investors own approximately 84.06% of the company's stock. The largest institutional shareholders include Vanguard Group Inc, BlackRock, Inc., and State Street Corp.

    There has been growing interest from institutional investors, with firms like Signal Advisors Wealth LLC acquiring a new stake of 46,347 shares (valued at approximately $2.27 million) in Q2 2025. Surience Private Wealth LLC also bought a new stake of 51,133 shares (valued at approximately $2.51 million) in Q2 2025. Institutional ownership had a "wild ride" in early 2025; it was initially halved when EY resigned as auditor but then rose enormously as management provided reassurance and the company filed its annual report on time.

    Insider trading activity includes sales by company executives. Director Liang Chiu-Chu Sara Liu sold 200,000 shares for $12 million in July 2025, and CFO David E. Weigand sold 25,000 shares for $1.13 million in September 2025. SVP George Kao also sold 40,000 shares in August 2025. Over the last 90 days, insiders sold a total of 490,000 shares worth $27.89 million.

    Retail Chatter

    Retail investor sentiment around SMCI appears to be characterized by sustained interest and a generally bullish outlook, even in the face of company-specific challenges. In April 2025, despite the company flagging weakness in its preliminary Q3 2025 results and revising guidance downward, retail investors on the Stocktwits platform maintained a "bullish" sentiment (74/100) with "high" message volume. This indicated a resilient retail investor base that interpreted the challenges as deferrals rather than fundamental issues.

    More recently, in September 2025, MarketBeat tracked a significant 527.3% increase in the number of investors following Super Micro stock over the preceding week, reflecting growing attention from the broader investment community that could translate into upward momentum. The company's participation in investor events also helps boost confidence, which can positively influence retail sentiment.

    13. Regulatory, Policy, and Geopolitical Factors

    Super Micro Computer, Inc. (SMCI) navigates a complex landscape of regulatory, policy, and geopolitical factors as of October 1, 2025, significantly influencing its operations, compliance requirements, and market opportunities. The company faces scrutiny over past financial reporting, stringent export controls, and the impacts of evolving global trade relations, while also benefiting from strategic manufacturing diversification and government focus on AI infrastructure.

    Regulatory and Compliance Landscape

    SMCI is subject to rigorous regulatory oversight, primarily concerning financial reporting and export controls.

    Laws and Compliance:

    • Financial Reporting and Internal Controls: SMCI has faced significant challenges. In February 2025, it regained compliance with Nasdaq by timely filing its Q2 FY2025 Form 10-Q, FY2024 Form 10-K, and Q1 FY2025 Form 10-Q, resolving previous delays that led to Nasdaq notifications. This followed a period where the company postponed filing its annual report in August 2024 due to internal control assessments, and a Hindenburg Research report in August 2024 alleging accounting manipulation. The U.S. DOJ and SEC issued subpoenas. In October 2024, auditors Ernst & Young resigned, citing concerns over internal controls and board independence. An independent special committee later found no evidence of misconduct.
    • Export Control Laws: SMCI must comply with U.S. and global export control laws, particularly regarding sensitive technologies like restricted GPUs. Non-compliance can result in severe penalties. In 2006, Supermicro pleaded guilty to violating a U.S. embargo against Iran. More recently, Hindenburg Research and a shareholder lawsuit in October 2024 alleged SMCI continued to evade U.S. export restrictions by shipping advanced technology products to Russia and China post-2022.
    • Other Laws and Policies: SMCI's Code of Business Conduct and Ethics Policy emphasizes compliance with anti-fraud provisions, fair dealing, and prohibitions against insider trading and foreign corrupt practices.

    Government Incentives

    SMCI is strategically positioned to benefit from government incentives aimed at bolstering domestic technology production and AI infrastructure.

    • "Made in America" Tech Policies: By expanding its U.S. manufacturing footprint, SMCI aligns with "Made in America" initiatives, potentially benefiting from government incentives for domestic tech production. This addresses geopolitical risks and supply chain vulnerabilities.
    • AI Infrastructure Investment: The U.S. government is investing in domestic semiconductor and chipmaking capabilities. As a provider of critical AI infrastructure, SMCI is well-positioned to benefit from these initiatives and strategic partnerships, particularly with NVIDIA.

    Geopolitical Risks and Opportunities

    Geopolitical factors pose both significant risks and strategic opportunities for Supermicro.

    Geopolitical Risks:

    • Trade Tariffs and Trade Wars: Trump administration tariffs on semiconductor imports have significantly impacted SMCI's earnings, with "tariff impact" cited for declining non-GAAP EPS in Q4 FY2025. Renewed tariff fears in April 2025 contributed to stock declines and a revision of FY2025 sales guidance. The U.S.-China trade dispute continues to affect the microchip supply chain.
    • Supply Chain Vulnerabilities: Reliance on global component sourcing makes supply chains susceptible to geopolitical events. Demand for high-end GPUs and HBM has created constraints, leading to longer lead times and increased costs. Geopolitical tensions are pushing companies towards domestic chip fabrication.
    • Sanctions and Export Controls: Allegations of SMCI evading U.S. export restrictions by supplying products to Russia and China present substantial geopolitical risk, potentially leading to legal repercussions and reputational damage.
    • Increased Competition: Intense competition in the AI server market, with rivals aggressively undercutting prices, leads to margin contraction for SMCI.

    Geopolitical Opportunities:

    • Manufacturing Diversification: SMCI has diversified its global manufacturing footprint across the U.S., Taiwan, Malaysia, and the Netherlands. This strategy mitigates trade risks, supports cost-sensitive customers, and provides a buffer against disruptions in any single region.
    • Strategic Partnerships and Market Growth: Alliances with NVIDIA, AMD, and Ericsson are expanding its AI ecosystem. The global AI server market is projected for substantial growth, reaching $167.2 billion by end of 2025 and $1.56 trillion by 2034. SMCI's focus on high-performance, high-efficiency servers positions it as a significant beneficiary. Its $20 billion partnership with DataVolt (May 2025) for AI campuses in Saudi Arabia and the U.S. aligns with global trends toward renewable energy.
    • Innovation in Energy Efficiency: SMCI's leadership in advanced cooling technologies (DLC-2) provides a competitive advantage. With AI data centers consuming immense power, these solutions can reduce power consumption by up to 40%, addressing environmental sustainability and operational costs.

    In summary, Super Micro Computer, Inc. faces ongoing challenges related to compliance with financial reporting and export control regulations, exacerbated by geopolitical tensions and trade policies. However, its strategic global manufacturing and strong position in the booming AI infrastructure market, coupled with innovation in energy-efficient solutions and government support for domestic tech, present significant opportunities for growth and resilience as of October 2025.

    14. Outlook and Scenarios

    Super Micro Computer, Inc. (SMCI) is at a pivotal juncture as of October 1, 2025, navigating immense opportunities in the burgeoning Artificial Intelligence (AI) and high-performance computing markets, alongside significant operational and competitive challenges.

    Bull Case

    The bullish outlook for SMCI is primarily driven by its central role in the accelerating AI infrastructure boom. The company's specialization in AI-capable server systems, advanced storage, and sophisticated cooling solutions, particularly its highly sought-after liquid cooling technology, positions it favorably to capitalize on surging demand from enterprises and hyperscale data centers. SMCI has demonstrated robust revenue growth, with AI solutions accounting for nearly 70% of its sales in fiscal year 2024, and is projected to continue significant growth into FY26.

    Key partnerships, notably with NVIDIA, for deploying Blackwell Ultra systems and providing cooling services, further strengthen its market position and product portfolio. Analysts anticipate continued strong revenue and EPS growth for FY2025 and FY2026, with some projections for FY2026 revenue reaching approximately $30.7 billion and EPS of $2.84. The global AI server market is expected to expand dramatically, growing from $128 billion in 2024 to $167.2 billion by the end of 2025 and an astounding $1.56 trillion by 2034, providing a massive tailwind for SMCI. Furthermore, some analysts believe SMCI remains undervalued despite its growth, citing a low forward Price/Sales ratio. Its critical role in AI infrastructure also makes it a potential candidate for strategic investment or even acquisition by larger industry players. The company's ability to quickly deploy custom server solutions is also a competitive advantage.

    Bear Case

    Despite the strong growth narrative, SMCI faces considerable headwinds that form the basis of the bear case. A primary concern is the decline in non-GAAP gross margin, which fell from 13.3% to 11.9% due to an unfavorable product and customer mix, coupled with increased costs from product delays and R&D investments. This has led to a downward revision of the company's FY2025 revenue guidance to a range of $23.5 billion to $25 billion, a 13% reduction from previous estimates. Q4 revenue expectations also indicate a decrease in guidance, with only a projected 30% quarter-over-quarter increase despite substantial year-over-year growth, and December quarter sales fell below consensus estimates.

    More significantly, SMCI has been embroiled in allegations of accounting irregularities, including a Hindenburg Research report in August 2024 and a Justice Department investigation. The resignation of its accounting firm, Ernst & Young, in October 2024, and the company's delay in filing financial statements with the SEC, have raised concerns about potential NASDAQ delisting. These issues are expected to contribute to stock volatility throughout 2025.

    Financially, SMCI's profit margins are considered modest for a tech company, indicating potential challenges in cost management. The increase in shares outstanding suggests potential dilution for existing shareholders, and the company's negative cash flow over the past twelve months necessitates ongoing capital raises. Moreover, SMCI faces intensifying competition from major players in the server and storage market, such as Pure Storage, Dell Technologies, and Hewlett Packard Enterprise, which could further pressure its near-term margin outlook.

    Short-Term Projections (as of 10/1/2025)

    In the immediate term, analyst sentiment for SMCI is mixed, with some issuing "Buy" ratings and others recommending "Hold." Average price targets from Wall Street analysts vary significantly, ranging from $45.36 (forecasted downside of -8.68%) to $187.32 (0% increase). One projection from CoinCodex suggests a monthly trading range of $45.96 to $46.85 for October, indicating slight upward momentum. StockInvest.us also shows mostly positive short-term signals, with a predicted fair opening price of $47.45 on October 1, 2025.

    However, the accounting concerns are expected to keep SMCI stock volatile throughout 2025. The company's guidance for Q1 fiscal year 2026 EPS is set between $0.400 and $0.520, and preliminary estimates for Q1 2025 indicated sales of $5.9 billion to $6 billion with a gross margin of 13.3%. The near-term margin outlook for Q1 and Q2 fiscal 2026 is described as dim, with projected declines.

    Long-Term Projections (as of 10/1/2025)

    The long-term outlook for SMCI remains bullish, underpinned by the sustained and expanding demand for AI and high-performance computing infrastructure. Analysts project robust revenue growth, with estimates ranging from $25 billion for FY2025 and continued growth of 20-25% for FY2026. Some long-term forecasts suggest a bullish trend with potential highs significantly above current levels over the coming years. Simply Wall St. projects revenue of $48.2 billion and earnings of $2.4 billion by 2028, requiring nearly 30% annual revenue growth.

    The broader IT services industry, a key market for SMCI, is forecast to grow to $1.879 trillion worldwide by the end of 2029, with AI as a primary driver. SMCI's global reach, with more than half its revenue generated outside the U.S., positions it to meet this worldwide growth demand. By the end of 2025, 24/7 Wall St. projects SMCI's stock price to reach $52.04, further increasing to $67.25 by the end of 2026 and $89.01 by the end of 2027. The company's market position is expected to strengthen as AI and cloud computing continue their expansion.

    Strategic Pivots

    SMCI's strategic focus is deeply entrenched in the evolving AI landscape. The company has explicitly pivoted to prioritize AI solutions, which constitute a significant majority of its sales. Recent strategic moves include:

    • AI-Centric Product Development: The global launch of NVIDIA Blackwell Ultra solutions in September 2025 underscores SMCI's commitment to delivering pre-validated, plug-and-play systems for high-performance AI infrastructure. This includes innovative air-cooled and liquid-cooled GPU and AI platforms, with liquid cooling being particularly critical for hyperscale and AI data centers due to its efficiency.
    • Capacity Expansion and Regional Focus: SMCI is strategically expanding its operations in key regions like the U.S., Taiwan, and Malaysia, enhancing operational efficiency and competitiveness. The company is increasing its production of server solutions optimized for AI GPUs, even if it temporarily impacts margins in the pursuit of greater capacity.
    • Partnerships and Market Engagement: Deepening partnerships with industry leaders like NVIDIA and Fujitsu for AI computing are central to its strategy. SMCI is also actively engaging with institutional investors and showcasing its new edge systems and data center solutions at prominent industry events. This outreach aims to increase brand awareness and attract capital, particularly in rapidly developing data center markets.
    • Transition to Profitability: While currently focused on scale, SMCI will need to navigate a strategic transition to improve its modest profit margins, an execution risk in the long term.

    In summary, Super Micro Computer, Inc. is leveraging its expertise in AI server and cooling technologies to ride the wave of AI demand, but it must address significant financial transparency issues and navigate intense competition to fully realize its long-term potential.

    15. Conclusion

    Super Micro Computer, Inc. (SMCI): Key Findings, Balanced Perspective, and Investor Outlook as of October 1, 2025

    Super Micro Computer, Inc. (SMCI), a prominent provider of high-performance server and storage solutions, is navigating a dynamic market driven by the escalating demand for artificial intelligence (AI) infrastructure. As of October 1, 2025, the company presents a mixed financial picture with strong top-line growth fueled by AI, alongside pressures on profitability and increased competition.

    Summary of Key Findings:

    • Robust Revenue Growth Driven by AI: SMCI continues to experience significant revenue expansion, primarily due to its strong position in AI-optimized server solutions. In fiscal year 2025, the company's revenues increased approximately 47% year-over-year to $22 billion. SMCI expects fiscal year 2026 revenues to reach $33 billion. AI solutions contributed over 70% to SMCI's top line in the fourth quarter of fiscal 2025.
    • Recent Financial Performance (FY25):
      • Q4 FY2025 (ended June 30, 2025): Net sales were $5.8 billion, compared to $4.6 billion in Q3 FY2025 and $5.4 billion in Q4 FY2024. Diluted net income per common share was $0.31, compared to $0.17 in Q3 FY2025 and $0.46 in Q4 FY2024. Gross margin stood at 9.5%, a slight decrease from 9.6% in Q3 FY2025 and 10.2% in Q4 FY2024.
      • Q3 FY2025 (ended March 31, 2025): Net sales were $4.60 billion, below the prior guidance of $5.0 billion to $6.0 billion, with diluted net income per common share at $0.17. Gross margins contracted to 9.6% from 11.8% in Q2 FY2025 and 15.5% in Q3 FY2024, attributed to higher inventory reserves for older products and expedite costs.
      • Q2 FY2025 (ended December 31, 2024, preliminary): Net sales were in the range of $5.6 billion to $5.7 billion, reflecting 54% year-over-year growth at the midpoint. Gross margin was between 11.8% and 11.9%.
    • Product Innovation and Market Leadership: SMCI has maintained its "first-to-market" advantage, particularly with next-generation AI systems like the NVIDIA B300 and GB300, and has commenced volume shipments of server systems with Nvidia's new Blackwell Ultra AI chips. The company has expanded its Data Center Building Block Solutions (DCBBS) for rapid AI data center deployments and introduced DLC-2 (Direct Liquid Cooling), which reduces power/water consumption by up to 40% and total cost of ownership by 20%.
    • Global Expansion and Partnerships: SMCI is scaling its global manufacturing capacity with expansions in Silicon Valley, Taiwan, the Netherlands, and a new facility in Mexico. Strategic partnerships, including a multi-year $20 billion deal with Saudi data center company DataVolt, underline its global ambitions. The company also held its "INNOVATE! EMEA 2025" event to increase awareness in Europe.
    • Analyst Sentiment: As of October 1, 2025, analysts have a "Buy" consensus rating for SMCI, with an average price target of $187.32. However, other sources indicate a "Hold" consensus rating with an average price target ranging from $45.36 to $47.47. There's a notable divergence in analyst views, with some maintaining a "Hold" or even "Sell" rating, while others forecast significant upside.

    Balanced Perspective:

    Strengths:

    • AI Server Specialization: SMCI's agility and focus on high-performance, energy-efficient server solutions, especially for AI workloads, position it as a critical enabler of the AI revolution. Over 70% of its revenue now comes from GPU server solutions for AI.
    • Technological Leadership: Its "first-to-market" strategy with cutting-edge GPUs (NVIDIA B300, GB300, Blackwell Ultra) and advanced cooling solutions like DLC-2 provides a competitive edge, significantly reducing operational costs and improving performance for data centers.
    • Modular Architecture and Speed to Market: SMCI's modular, open-standard architecture allows for rapid, customized server deployments, a key advantage over larger competitors.
    • Strategic Partnerships: Deep collaborations with industry leaders like NVIDIA ensure access to the latest chip architectures and opportunities to build hyperscale AI campuses.

    Weaknesses & Threats:

    • Margin Contraction: Gross margins have been under pressure, falling to 9.5% in Q4 FY2025, significantly below management's long-term goal of 15-17%. This is attributed to adverse product/customer mix, increased R&D costs, and rising price competition.
    • Intense Competition: SMCI faces stiff competition from established players like Dell Technologies (DELL) and Hewlett Packard Enterprise (HPE) in the server and storage space. Hyperscalers also increasingly develop their own custom AI chips, posing a potential threat.
    • Customer Decision Delays: The shift to next-generation AI platforms has led to delayed purchasing decisions from customers, impacting revenue guidance and quarterly sales.
    • Supply Chain Vulnerabilities: Explosive demand for high-end GPUs and HBM has created supply constraints, leading to long lead times and increased costs, affecting SMCI and the broader industry.
    • Past Accounting Allegations: While a three-month independent review in late 2024 found no evidence of fraud or misconduct regarding prior allegations, any lingering perception of financial reporting issues could impact investor confidence.
    • Macroeconomic Headwinds: Economic downturns, higher interest rates, and geopolitical factors could lead to reduced IT spending and data center expansion, impacting SMCI's growth.

    What Investors Should Watch as of 10/1/2025:

    1. Gross Margin Trends and Profitability: This is a critical metric. Investors should monitor whether SMCI can reverse the trend of declining gross margins and move towards its long-term target of 15-17%. The success of its strategy to focus on complete solutions (DCBBS) and expand into higher-margin enterprise, IoT, and telecom markets will be key.
    2. AI Infrastructure Demand and Execution: Continued strong demand for AI, machine learning, and cloud computing will be a primary growth driver. Investors should watch SMCI's ability to consistently win new deals for AI data center buildouts, especially with NVIDIA's Blackwell and future architectures, and convert this demand into profitable sales.
    3. Competitive Dynamics: Observe how SMCI maintains its competitive edge against Dell and HPE, particularly in the rapidly evolving AI server market. Its speed to market, innovation in cooling solutions, and ability to offer tailored, integrated solutions are crucial differentiators.
    4. Supply Chain Stability: Given the reliance on high-end components like GPUs and HBM, any significant disruptions or constraints in the supply chain could impact production and delivery schedules.
    5. Financial Guidance and Analyst Revisions: Pay close attention to future revenue and earnings guidance from management, as well as how analysts revise their price targets and ratings in response to actual performance and market conditions. Recent downward revisions in FY2025 guidance indicate the importance of these updates.
    6. Global Expansion and Market Adoption of Liquid Cooling: Monitor the success of SMCI's manufacturing expansions and its ability to penetrate new geographic markets (e.g., Europe, Mexico). The adoption rate of its advanced direct liquid cooling solutions in new data center deployments (expected to be over 30% in the next 12 months) is a significant opportunity.
    7. Valuation and Market Sentiment: While SMCI has experienced rapid growth, its stock has also been volatile. Investors should assess its valuation metrics (e.g., Price/Sales, P/E) relative to its growth prospects and industry peers, considering the "risk vs. reward" dynamic.

    In conclusion, Super Micro Computer Inc. is at the forefront of the AI infrastructure boom, demonstrating impressive revenue growth and innovative product development. However, maintaining profitability amidst fierce competition and managing supply chain challenges are crucial for long-term success. Investors should carefully monitor the company's ability to improve its gross margins, execute on its growth strategies, and navigate the evolving competitive landscape.


    This content is intended for informational purposes only and is not financial advice