The tech world is still reeling from the announcement made on February 5, 2026, during Amazon.com Inc. (NASDAQ: AMZN) Q4 2025 earnings call. CEO Andy Jassy stunned investors and analysts alike by unveiling a staggering $200 billion capital expenditure (capex) target for the 2026 fiscal year—a nearly 60% jump from the previous year. While traditional analysts were largely caught off-guard by the scale of this spending, prediction markets had been signaling a massive escalation in AI infrastructure investment for weeks.
In the days surrounding the announcement, traders on platforms like Kalshi and Polymarket shifted from optimism about revenue growth to a cautious, data-driven skepticism regarding near-term margins. As of February 7, 2026, the probability of Amazon maintaining its pre-earnings stock price above $232 has plummeted, with prediction markets now pricing in an "AI Accountability" era where results must finally justify the unprecedented costs of data centers and custom silicon.
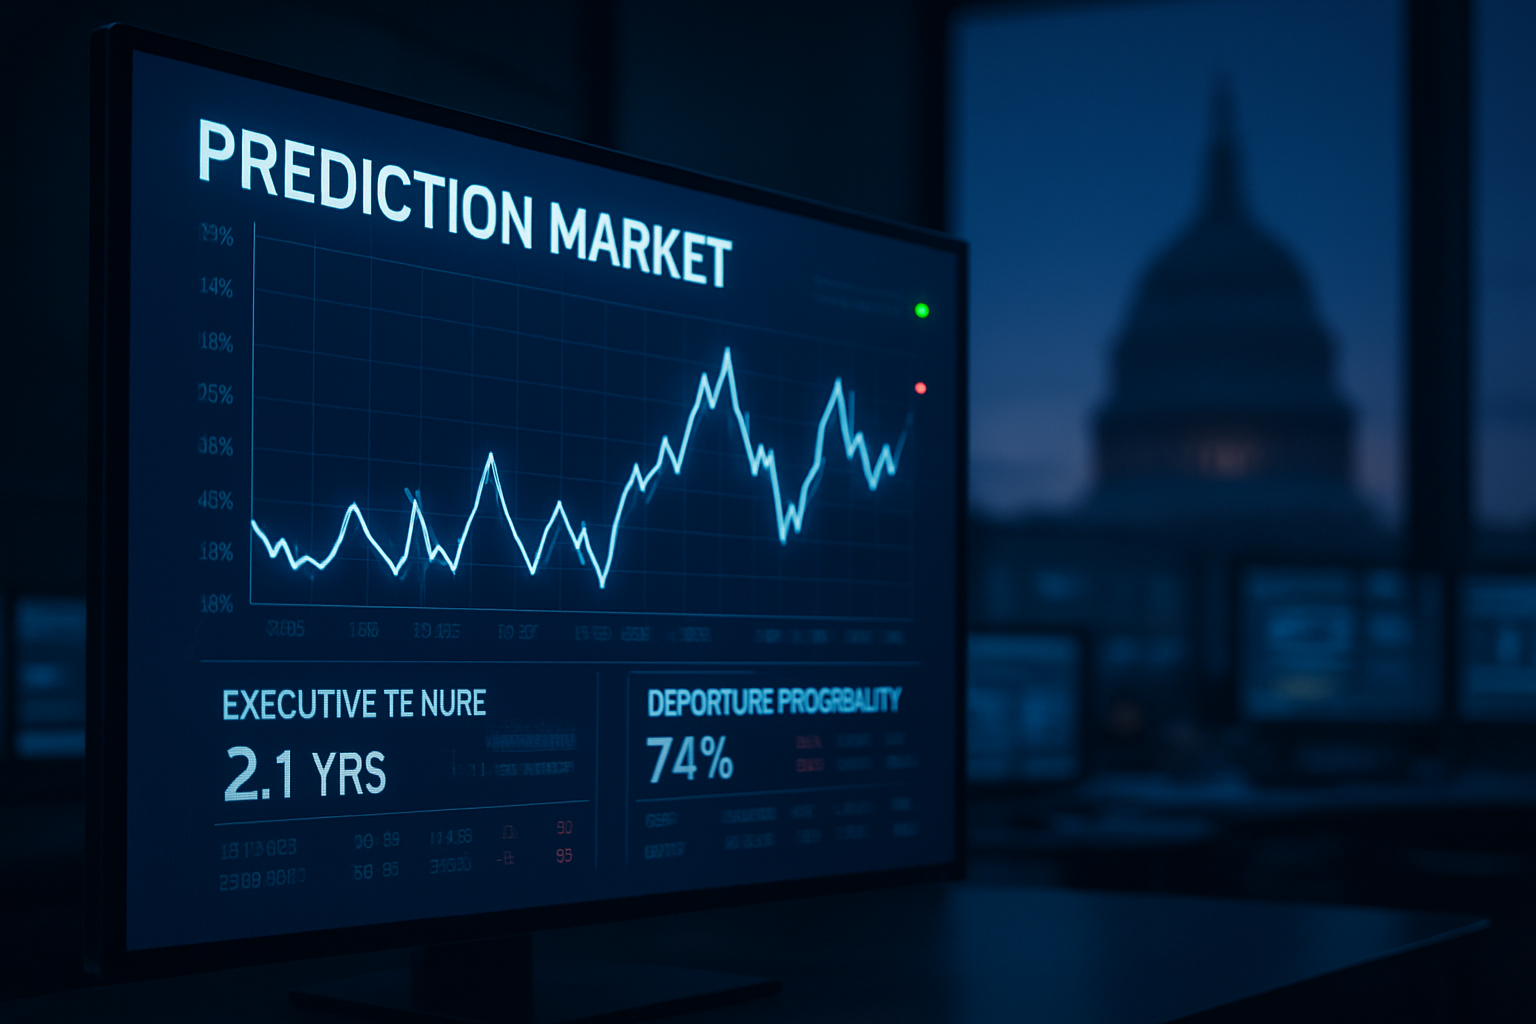
The Market: What's Being Predicted
Leading up to the earnings release, prediction markets were heavily focused on several key metrics beyond just the share price. On Kalshi, high-volume contracts were trading on whether AWS would reach specific revenue milestones and if the company would confirm a "model-agnostic" overhaul for Alexa. However, the most active markets were those tracking corporate event milestones, specifically focusing on the number of "AI-dedicated data center groundbreakings" and the deployment of Project Rainier, Amazon's massive AI computing cluster.
At Polymarket, the sentiment was even more granular. Traders had placed millions of dollars in bets on the "Amazon Q4 Earnings Range," with 99.6% conviction that the company would trade above $232 prior to the call. Once the $200 billion capex figure was revealed, the probability for the "higher" price tiers ($248–$268) collapsed from 69% to a mere 18% within minutes of the after-hours session. This rapid re-pricing highlighted the immediate impact of the "capex bombshell" on trader sentiment.
Liquidity in these markets has been exceptionally high, with tens of millions in trading volume as institutional desks increasingly use prediction markets to hedge against corporate spending shocks. The resolution of these markets is tied to SEC filings and official company press releases, providing a hard timeline that traders have used to time their entries and exits around the earnings volatility.
Why Traders Are Betting
The primary driver of the current odds is the tension between Amazon’s impressive cloud growth and its astronomical spending. While AWS revenue grew 24% year-over-year to $35.6 billion—its fastest acceleration in years—the market is now hyper-focused on the "Capex explosion." Traders are weighing the potential of Project Rainier, which utilizes nearly 500,000 in-house Trainium2 chips, against the reality of a shrinking free cash flow, which fell to $11.2 billion as 90% of operating cash was redirected into infrastructure.
Recent news regarding Amazon's collaboration with Anthropic and rumors of a $50 billion partnership with OpenAI have fueled speculation. Some traders believe this spending is a necessary defensive move to prevent Google, a subsidiary of Alphabet Inc. (NASDAQ: GOOGL), from dominating the GenAI space with its Gemini models. Others view it as an aggressive offensive play to capture the $244 billion AWS backlog, which has grown 40% over the last year.
Notable "whale" activity has been observed on Kalshi, where large positions were taken in favor of AWS maintaining its 28% market share despite the rise of specialized AI competitors. These positions suggest that while the "capex shock" is real, sophisticated bettors still believe Amazon’s scale will eventually create a wide enough moat to justify the $200 billion price tag. This contrasts with some traditional forecasting methods from firms like Morgan Stanley (NYSE: MS), which, while bullish, did not fully anticipate the severity of the market's negative reaction to the spending guidance.
Broader Context and Implications
This event marks a significant shift in how prediction markets interact with Big Tech. We are moving away from simple "up or down" bets on stock prices and toward complex forecasting of "capex-to-revenue" ratios and "infrastructure efficiency." This trend reveals a public sentiment that is becoming increasingly sophisticated; retail traders are no longer just looking at the top line—they are scrutinizing the cost of every H200 and B200 GPU cluster purchased from NVIDIA Corp (NASDAQ: NVDA).
The real-world implications of these predictions are profound. If the prediction markets are correct in their "Bearish on Margins" sentiment, it could signal a broader cooling of the AI-driven tech rally. As Amazon goes, so goes much of the cloud sector. This market provides a real-time "fear gauge" for how much spending investors are willing to tolerate before demanding a clear return on investment (ROI).
Furthermore, regulatory considerations are beginning to surface. As prediction markets like Kalshi become more influential in signaling corporate health, there is growing discussion about how "insider sentiment" might manifest in these odds before public disclosures. Historically, these markets have been remarkably accurate at flagging "surprises" in corporate strategy, often moving hours or days before major media outlets pick up on the narrative shift.
What to Watch Next
The next major milestone for these markets will be the rumored "Alexa+" launch, expected in late Q1 2026. Traders on Kalshi are already pricing in the success of this voice-assistant overhaul as a "make or break" moment for Amazon’s consumer AI strategy. If the launch is perceived as a failure, prediction markets suggest we could see another 5–10% decline in valuation as the ROI for the massive capex becomes even more questionable.
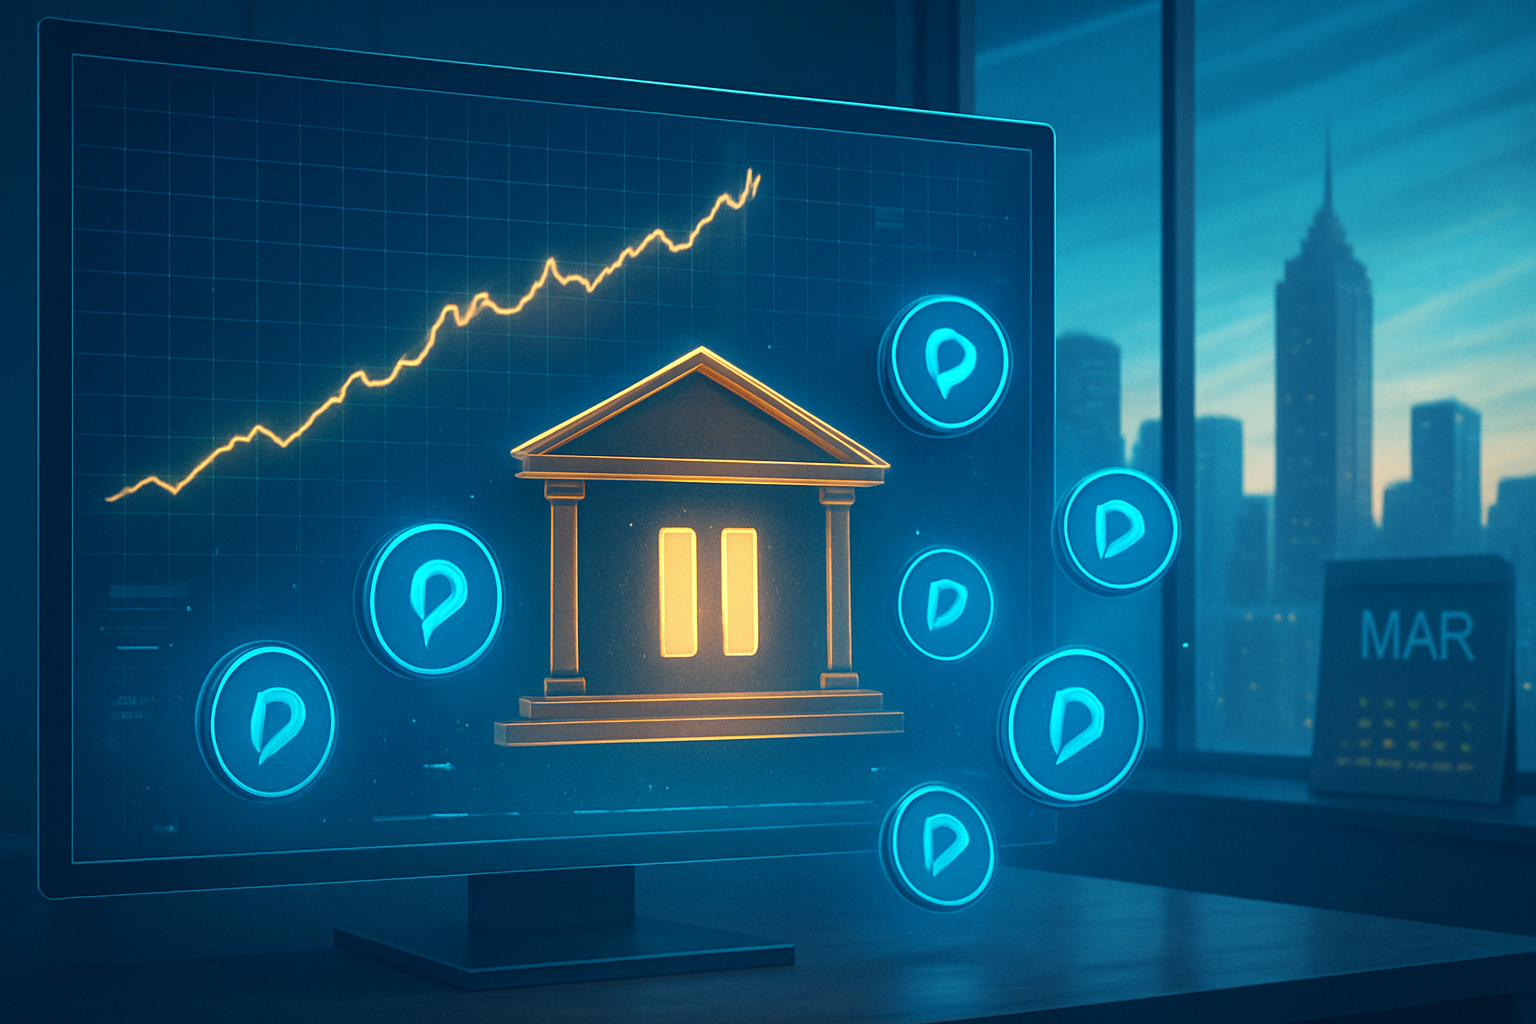
Additionally, the rollout speed of Project Kuiper satellites will be a critical data point. Prediction markets are currently split on whether Amazon can meet its deployment targets, with odds fluctuating based on launch schedules and orbital success rates. Any delay in Kuiper would exacerbate concerns about the $200 billion spend, as it represents a significant portion of non-AWS capex.
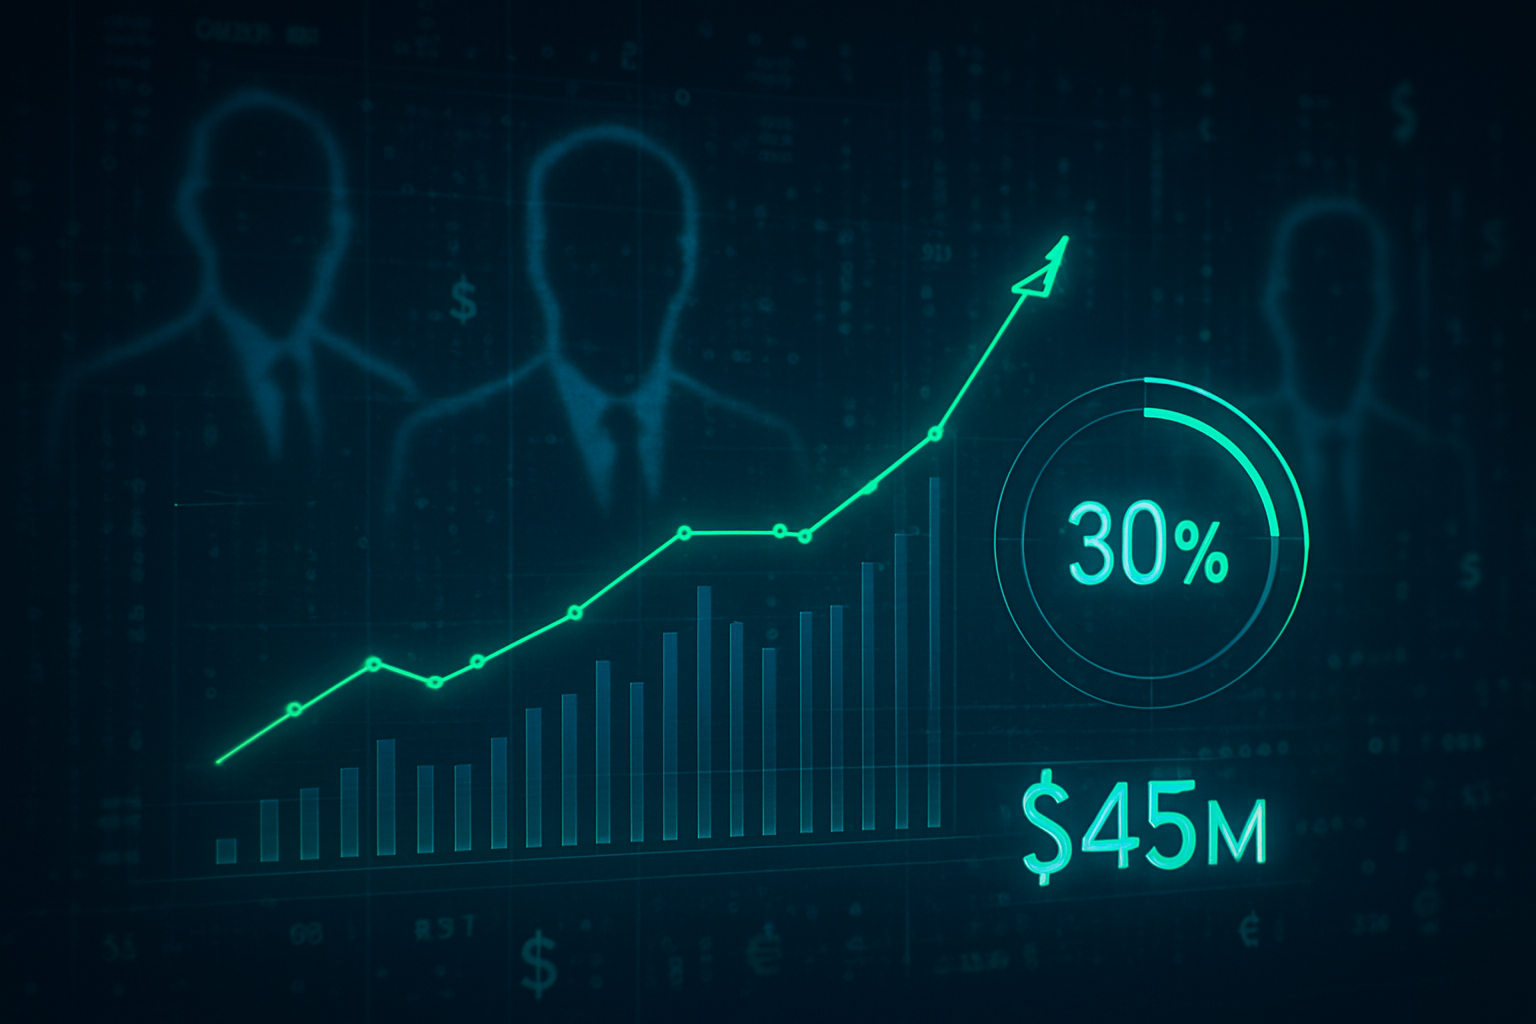
Investors should also keep a close eye on the Q1 2026 earnings preview markets, which will begin trading in late March. These will offer the first look at whether the massive infrastructure investments are translating into the 30%+ AWS growth that many "bullish" traders are counting on to save the stock's valuation.
Bottom Line
The $200 billion capex target has fundamentally changed the conversation around Amazon. Prediction markets have acted as a vital "shock absorber," allowing traders to navigate the transition from a growth-at-all-costs mindset to one of disciplined AI accountability. The sharp decline in Amazon's stock price to the $216–$222 range serves as a stark reminder that even the largest companies are not immune to the scrutiny of capital efficiency.
What this tells us is that prediction markets have become an indispensable tool for understanding the "hidden" expectations of the market. They captured the underlying anxiety about Amazon's spending long before the earnings call, providing a more nuanced view of the risks than traditional financial media.
Ultimately, the odds suggest that while Amazon is building the world's most formidable AI infrastructure, the path to profitability on that $200 billion investment will be long and volatile. For now, the "Show Me the ROI" era is officially here, and the prediction markets will be the first place to look for signs of whether Amazon can deliver on its massive bet.
This article is for informational purposes only and does not constitute financial or betting advice. Prediction market participation may be subject to legal restrictions in your jurisdiction.
PredictStreet focuses on covering the latest developments in prediction markets.
Visit the PredictStreet website at https://www.predictstreet.ai/.